

Smart Irrigation Market: US Size, Growth & Adoption Data
Reviewed September 2026 against USDA NASS’s 2023 Irrigation and Water Management Survey, USDA ERS irrigation water use data, and IMARC Group’s US smart irrigation market report.
Try it: Run your own numbers →
Table of Contents
- Introduction: What the Smart Irrigation Market Actually Looks Like Right Now
- US Smart Irrigation Market Size & Growth
- Irrigation Automation & Irrigation Controller Market
- Precision Irrigation Market: Water Savings and Yield Data
- Segment Breakdown: Mechanized, Greenhouse, Smart Home & Agricultural Machinery
- Costs: Drip, Sprinkler and Controller Pricing
- Drip Irrigation Cost & Water Savings Calculator
- Comparison Table: Irrigation System Types & Adoption
- Challenges Facing Adoption
- Farmonaut’s Role in Precision Irrigation
- How to Verify These Numbers Yourself
- FAQ
Introduction: What the Smart Irrigation Market Actually Looks Like Right Now
The US smart irrigation market was valued at $304.4 million in 2025 and is projected by IMARC Group to reach $460.4 million by 2030, a compound annual growth rate of 8.6% over that five-year window. That growth sits on top of a much larger irrigated-agriculture base: 53.1 million acres across 212,714 US farms used irrigation in 2023, according to USDA’s National Agricultural Statistics Service (NASS), applying 81 million acre-feet of water in that year alone.
This page answers the specific questions behind the “smart irrigation market,” “irrigation automation market,” “precision irrigation market,” “irrigation controller market,” and “agricultural irrigation machinery market” searches: how big each segment actually is, what it costs to install the equipment, and how to verify the numbers yourself as USDA and industry trackers republish them. We also cover the smaller “greenhouse irrigation system market” and “smart home irrigation market” queries, where — as explained in the segment section below — no separate published market-size figure currently exists.
For farmers who want real-time field data behind these irrigation decisions rather than just market statistics, our apps and the put satellite-based soil moisture and crop health monitoring directly in front of individual farmers, cooperatives, and government agencies.
US Smart Irrigation Market Size & Growth
IMARC Group puts the US smart irrigation market at $304.4 million in 2025, growing to a projected $460.4 million by 2030 at an 8.6% CAGR (IMARC Group, United States Smart Irrigation Market). That’s the figure behind the “smart irrigation market,” “us mechanized irrigation market,” and “united states smart irrigation market” searches this page targets — it covers sensor-, controller-, and software-driven irrigation technology sold into US agriculture, not the full value of irrigation hardware (pipes, pumps, pivots) already installed on farms.
To size the addressable base that smart-irrigation vendors are selling into: USDA NASS’s 2023 Irrigation and Water Management Survey counted 212,714 US farms irrigating 53.1 million acres, applying 81 million acre-feet of water — an average water intensity of 1.5 acre-feet per acre (USDA NASS, 2023 Irrigation Survey). Irrigated farms punch above their acreage: irrigated land is under 17% of harvested US cropland yet generates more than half of the value of US crop sales, per USDA’s Economic Research Service (USDA ERS, Irrigation & Water Use). That concentration of value on a relatively small acreage base is exactly why smart-irrigation vendors target it first — the per-acre return on a sensor or controller install is higher on high-value irrigated ground than on rainfed row crops.
Two states account for a disproportionate share of that irrigated base: California leads at 8.2 million irrigated acres, with Nebraska second at 8 million acres (USDA ERS, 2023). By crop, corn is the largest irrigated user at 11 million acres, followed by soybeans at 9 million acres. Agriculture overall accounts for 47% of US freshwater withdrawals across the 2010–2020 period USDA ERS tracked, which is the resource-scarcity backdrop driving both regulatory attention and vendor investment in the space.
Irrigation Automation & Irrigation Controller Market
The “irrigation automation market” and “irrigation controller market” queries point at the hardware layer inside the smart-irrigation figure above: the controllers, valves, and actuators that turn sensor data into an actual watering decision. USDA’s 2023 survey found groundwater supplies 55% of US irrigation water, drawn from wells averaging 241 feet deep — a figure that matters for automation vendors because well-pump control (start/stop timing tied to energy rates and aquifer drawdown) is one of the fastest-growing automation use cases on the NASS-tracked farms.
On system type, pressurized irrigation (sprinkler and drip, as opposed to gravity-fed flood systems) covers 29 million acres in the western United States, 74% of that region’s irrigated cropland (USDA ERS, 2023). Sprinkler systems specifically outpace gravity-fed systems by 12.6 million acres nationally, per USDA NASS — and sprinkler systems are the primary retrofit target for automated controllers, since a pivot or lateral-move system already has the electrical and mechanical infrastructure a controller needs to plug into.
On spend: US farms put $3 billion into irrigation equipment and facilities in 2023, and paid $3.3 billion in irrigation energy costs (pumping water) the same year, according to USDA NASS. USDA’s Environmental Quality Incentives Program (EQIP) contributed $1.5 billion toward water-saving technology funding, which is the federal cost-share channel most US farmers use to offset the upfront cost of a controller or sensor retrofit (per Bhumi Calculator’s 2026 US drip irrigation cost analysis, which cites the EQIP figure alongside current installation pricing).

Precision Irrigation Market: Water Savings and Yield Data
“Precision irrigation market” searches are usually looking for a return-on-investment case, not just a market-size number. The clearest available figures: precision irrigation cuts water consumption by 20–40% compared to conventional scheduling, and carries yield-increase potential of 20–25%, according to 2025 research summarized by Southeast AgNet (Southeast AgNet, Precision Agriculture Benefits, September 2025). Those two ranges — water reduction and yield gain — are the numbers to plug into any on-farm payback calculation, and the calculator further down this page uses the low end of the water-savings range as its default.
Context for why that saving matters at scale: the average irrigated US farm applies 1.5 acre-feet of water per acre (USDA NASS, 2023). A 20% reduction on that baseline is 0.3 acre-feet per acre saved — on an 8.2-million-acre state like California, that’s a meaningful volume even before accounting for the pumping-energy savings that come with using less water. The practical case for installing a precision system on a specific field is set out in the advantages of smart irrigation.
How Precision Irrigation Actually Works
Precision irrigation systems combine three data streams that traditional time-based schedules ignore entirely:
- Soil moisture levels, from dedicated soil moisture sensors placed at root-zone depth
- Weather conditions, from on-farm climate stations or satellite-derived data
- Crop-specific water demand, which changes by growth stage and cannot be captured by a fixed calendar schedule
- Try it: Run your own numbers
Traditional flood or fixed-cycle sprinkler irrigation, by contrast, waters on a schedule regardless of whether the soil profile is already full — which is the direct mechanical cause of the 20–40% water waste that precision systems eliminate.

Segment Breakdown: Mechanized, Greenhouse, Smart Home & Agricultural Machinery
Mechanized Irrigation Systems Market
“Mechanized irrigation” and “agricultural irrigation machinery market” searches typically mean center-pivot, lateral-move, and other powered mechanical systems, as distinct from gravity-fed flood irrigation. USDA doesn’t publish a separate dollar figure under that exact label, but the underlying acreage is measurable: pressurized (mechanized and drip) systems cover 29 million acres in the western US alone, 74% of that region’s irrigated cropland, and sprinkler systems nationally exceed gravity systems by 12.6 million acres (USDA NASS/ERS, 2023). That acreage gap is the market — every acre converting from gravity to mechanized is a unit sale for a pivot, lateral, or drip manufacturer.
Greenhouse Irrigation System Market
There is no USDA or industry figure specifically isolating controlled-environment or greenhouse irrigation spend from the broader smart-irrigation numbers above — this is a confirmed gap in currently published data, not an oversight on our part. What can be said with certainty: greenhouse operations sit inside the same $304.4 million (2025) US smart irrigation market IMARC Group tracks, but as an unquantified subset. If you need a greenhouse-specific figure for a specific analysis, USDA’s Census of Horticultural Specialties (run periodically by NASS) is the closest primary source, and USDA’s Quick Stats database at quickstats.nass.usda.gov lets you query irrigated acreage by operation type once new Census of Horticultural Specialties data is released.
Smart Home Irrigation Market
Residential smart irrigation (lawn and landscape controllers, not farm equipment) is also not separately reported in the sources behind this page — USDA’s surveys cover agricultural operations, and IMARC’s $304.4 million figure is the agricultural smart-irrigation market specifically. Residential adoption rates and revenue are a genuine data gap; if you’re researching that segment, look for a dedicated lawn-and-landscape industry report rather than treating agricultural figures as a proxy, since the buyer, price point, and install base are entirely different.
Drip Irrigation Systems Market
Drip irrigation sits inside the pressurized-systems category above. In Texas specifically, micro-irrigation (drip and micro-spray) accounts for just 1.2% of irrigated land, per the Texas Water Development Board — evidence that even in a water-constrained state, drip adoption remains a small share of total irrigated acreage relative to sprinkler and gravity systems. Installation costs for drip systems are covered in the Costs section below.
Costs: Drip, Sprinkler and Controller Pricing
Actual installation costs, from a 2026 industry cost analysis: standard agricultural drip irrigation runs $1,200 to $3,500 per acre installed, while subsurface drip irrigation (SDI) — where the drip line is buried below the soil surface — costs $800 to $1,200 per acre (Bhumi Calculator, US Drip Irrigation Cost Per Acre, 2026). Subsurface systems land cheaper per acre despite the extra installation labor because they eliminate above-ground tubing and reduce evaporation losses, which lowers the total water volume — and pumping energy — a system needs to be sized for.
Two things determine where a specific field falls in those ranges: field shape and size (larger, more regular fields cost less per acre because mainline and header runs are shorter relative to the area covered) and existing infrastructure (a field with an existing well and power drop costs less than bare ground). USDA’s $1.5 billion EQIP water-saving technology allocation for 2023 is the primary federal cost-share source that can offset a portion of either installation range — check current EQIP funding levels and eligibility through your local USDA Natural Resources Conservation Service office, since annual allocations shift with the federal budget cycle.
Drip Irrigation Cost & Water Savings Calculator
Use the figures above on your own acreage: enter your field size, choose a system type, and see the installation cost range and estimated annual water savings versus a conventional schedule.
Run your own numbers
Assumptions: cost ranges are USDA-adjacent 2026 industry figures for US agricultural drip installation (Bhumi Calculator); water-savings input defaults to the low end of the 20–40% range reported for precision irrigation (Southeast AgNet, 2025). Excludes energy costs, EQIP cost-share, permitting, and site-specific factors like slope or existing well infrastructure. Treat the output as a planning estimate, not a quote.
Comparison Table: Irrigation System Types & Adoption
| System Type | US Footprint | Water Source / Share | Installation Cost | Notes |
|---|---|---|---|---|
| Pressurized (sprinkler + drip), Western US | 29 million acres, 74% of western irrigated cropland | 55% of US irrigation water is groundwater, avg. well depth 241 ft | Varies by sub-type below | USDA ERS / NASS, 2023 |
| Sprinkler systems (national) | 12.6 million acres more than gravity systems | Mix of groundwater and surface water | Not itemized separately in NASS survey | USDA NASS, 2023 |
| Standard drip irrigation | Part of the 1.2% micro-irrigation share of Texas irrigated land | Typically groundwater-fed on high-value crops | $1,200–$3,500 per acre | Bhumi Calculator, 2026; TWDB, 2023 |
| Subsurface drip (SDI) | Subset of drip acreage above | Groundwater or municipal, buried delivery | $800–$1,200 per acre | Bhumi Calculator, 2026 |
| Gravity-fed / flood | Remaining western acreage outside the 29M pressurized figure | Primarily surface water | Lowest capital cost, highest water use | USDA ERS, 2023 |
Challenges Facing Adoption
Five factors slow smart-irrigation adoption on US farms, based on the cost and infrastructure data above:
- Upfront cost: $1,200–$3,500 per acre for standard drip, before controllers or sensors are added, is a real capital barrier on operations with thin margins in a given crop year.
- Well and energy dependence: with 55% of irrigation water drawn from groundwater at an average depth of 241 feet, and $3.3 billion spent nationally on pumping energy in 2023, rising electricity or diesel prices directly affect the payback period on any automation investment.
- Retrofit complexity on gravity systems: the acreage still on flood irrigation outside the 29-million-acre pressurized-system footprint in the western US requires a full system change, not a controller retrofit, to reach smart-irrigation capability.
- Data and calibration needs: soil moisture sensors and weather-driven controllers require field-specific calibration; soil texture and slope variation across even a single quarter-section can require multiple sensor zones.
- Uneven federal cost-share access: USDA's EQIP program allocated $1.5 billion to water-saving technology in 2023, but funding is competitive and regionally allocated — check current-cycle availability with your local NRCS office rather than assuming funding is open.

Farmonaut's Role in Precision Irrigation
Farmonaut's platform pairs satellite-based crop and soil-moisture monitoring with the on-farm cost and water-use data above, so a decision to install drip or upgrade a controller can be made against actual field conditions rather than a fixed calendar.
Farmonaut Technologies Supporting Smart Irrigation
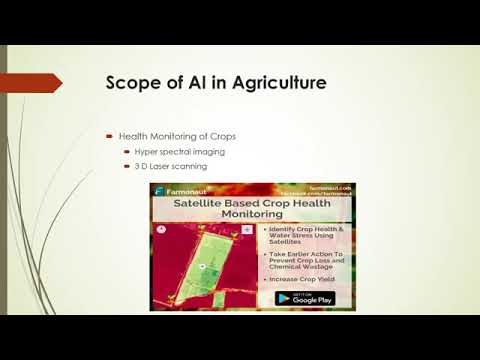
- Satellite-Based Crop Health Monitoring: multispectral satellite imagery tracks crop health and soil moisture indicators, helping farmers time irrigation to actual field conditions rather than a fixed schedule.
- Jeevn AI Advisory System: personalized recommendations and weather forecasts drawn from satellite and field-level data, supporting the kind of responsive scheduling behind the 20–40% water-savings figures cited above.
- Blockchain-Based Product Traceability: secure, blockchain-based traceability for crops and agri-products, supporting verifiable farm-to-market records.
- Fleet and Resource Management: fleet tracking and machinery allocation for operations running center-pivot or lateral-move equipment across multiple fields.
- Carbon Footprinting: real-time carbon emission monitoring, relevant since reduced pumping (from lower water application) also lowers on-farm energy-related emissions.
Farmonaut's tools support:
- Remote access to crop health and soil moisture data
- AI-based alerts for irrigation timing, fertilizer usage, and pest risks
- Precision resource allocation to reduce both water cost and pumping-energy cost
- Transparent, traceable operations via traceability tools
- Financing support through satellite-verified crop loan and insurance products
Access is available through apps and APIs for individual farmers, cooperatives, agribusinesses, and government agencies. API access and developer documentation support integration into existing farm management systems.
Explore More Farmonaut Solutions
- Carbon Footprinting: Track and minimize operational environmental impact.
- Product Traceability: Blockchain-enabled supply chain transparency.
- Crop Loan & Insurance: Satellite-based farm verification for financing and insurance.
- Fleet & Resource Management: Optimize resource allocation across operations.
- Large-Scale Farm Management: High-frequency satellite monitoring for large operations.
- Crop Plantation & Forest Advisory: Real-time analytics for plantation and forestry decisions.
How to Verify These Numbers Yourself
Every figure on this page carries a vintage, and every one of these sources republishes on a cycle — here is how to pull a fresher number than the one printed above:
- USDA NASS Irrigation and Water Management Survey: the 53.1-million-acre, 212,714-farm, and $3 billion/$3.3 billion spending figures come from the 2023 survey cycle, run as part of the Census of Agriculture. Check USDA NASS's newsroom release for the next survey cycle's results.
- USDA Quick Stats: for custom queries on irrigated acres by crop, state, or system type, use quickstats.nass.usda.gov directly — NASS notes this data refreshes annually with roughly a two-to-three-year lag behind the current crop year.
- USDA ERS irrigation water use topic page: the California/Nebraska acreage, crop-level acreage, and the 47% freshwater-withdrawal share are tracked on USDA ERS's irrigation and water use page, which updates as new Census and survey data is released.
- IMARC Group market report: the $304.4 million 2025 value and $460.4 million 2030 projection are IMARC's; check their US Smart Irrigation Market report page directly for a later edition, since market-research firms typically republish sizing reports annually or biennially.
- Installation cost ranges: the drip and SDI cost-per-acre figures are dated 2026; re-check current pricing with local irrigation contractors, since material costs (PVC, emitters, filtration) shift with broader input-price cycles.
As a durable checklist independent of any single year's numbers: before installing or upgrading a system, confirm (1) your current water source and its regulatory status, (2) your field's existing pressurized vs. gravity infrastructure, (3) current EQIP or state cost-share availability through your local NRCS office, and (4) an installer quote benchmarked against the per-acre ranges above. That sequence holds regardless of which year you're reading this.
FAQ
How big is the US smart irrigation market?
$304.4 million in 2025, projected to reach $460.4 million by 2030 at an 8.6% CAGR, per IMARC Group. This figure covers sensor-, controller-, and software-driven irrigation technology, not the full value of all irrigation infrastructure on US farms.
What is the "mechanized irrigation" or "irrigation machinery" market, in numbers?
There's no single published dollar figure under that label, but the underlying footprint is measurable: 29 million acres of pressurized (mechanized/drip) systems in the western US, 74% of that region's irrigated cropland, and sprinkler systems nationally outpacing gravity systems by 12.6 million acres (USDA NASS/ERS, 2023).
Is there a separate greenhouse irrigation or smart home irrigation market figure?
Not one we can cite. Neither USDA's agricultural surveys nor the IMARC smart-irrigation report isolates greenhouse or residential irrigation spend as a standalone figure — both currently sit inside broader categories without a published breakout. Use USDA's Census of Horticultural Specialties via Quick Stats for greenhouse-specific acreage, or a dedicated lawn-and-landscape industry report for the residential segment.
How much does drip irrigation cost per acre in the US?
Standard drip installation runs $1,200 to $3,500 per acre; subsurface drip (SDI) runs $800 to $1,200 per acre, per a 2026 industry cost analysis. Subsurface systems cost less per acre due to reduced above-ground tubing and lower evaporation losses.
How much water does precision irrigation actually save?
20% to 40%, compared to conventional scheduling, based on 2025 agronomic research — alongside a 20–25% yield-increase potential from the same optimized water management.
Which states and crops use the most irrigated acreage?
California leads at 8.2 million irrigated acres, followed by Nebraska at 8 million acres. By crop, corn leads at 11 million irrigated acres, followed by soybeans at 9 million acres (USDA ERS, 2023).
Where can I get funding help for irrigation upgrades?
USDA's Environmental Quality Incentives Program (EQIP) allocated $1.5 billion to water-saving technology funding in 2023. Contact your local USDA Natural Resources Conservation Service office to check current-cycle availability and eligibility for your operation.
Where can I access real-time crop and soil moisture data for irrigation decisions?
Farmonaut's web app, Android, and iOS platforms offer satellite-based crop monitoring, AI-driven advisory, fleet management, carbon tracking, and traceability. Visit the Farmonaut Web App or download the Android or iOS app.
Further reading:
Conclusion: The Numbers Behind the Smart Irrigation Market
The US smart irrigation market ($304.4 million in 2025, heading toward $460.4 million by 2030) sits on top of 53.1 million irrigated acres, 81 million acre-feet of water applied annually, and $3 billion in annual equipment investment. Installation costs of $800–$3,500 per acre depending on system type, and water savings of 20–40% from precision scheduling, are the two numbers that determine whether a specific field upgrade pays for itself — and both are re-checkable through the USDA and industry sources linked throughout this page.
Whether you're evaluating a pivot retrofit in Nebraska, a subsurface drip system in California, or a controller upgrade anywhere in between, the sequence stays the same regardless of the year: confirm your water source, your existing infrastructure, your cost-share eligibility, and a contractor quote against the ranges above.

 Geospatial Lab Africa
 KhetiBuddy
 Agro La Gándara
 Global Agrifood
 HIPSAC
 ZOL Zimbabwe
 Juligerm
 AdBio
AdBio MISE Maroc
 NWNS
NWNS Red August Group
 Farm Inc
 WeMe Global
 Agrotoken
 Blue BearX
 Insignito
 Croptimum
 DnCubed
 Field Capacity
 Indosistim Teknologi
