

Reviewed August 2026 against USDA Agricultural Research Service, Frontiers in Agronomy, and IMARC Group market data.
Try it: Enter your numbers above and click Calculate. →
Crop Analysis Software: Soil, Weather & Wind Data APIs
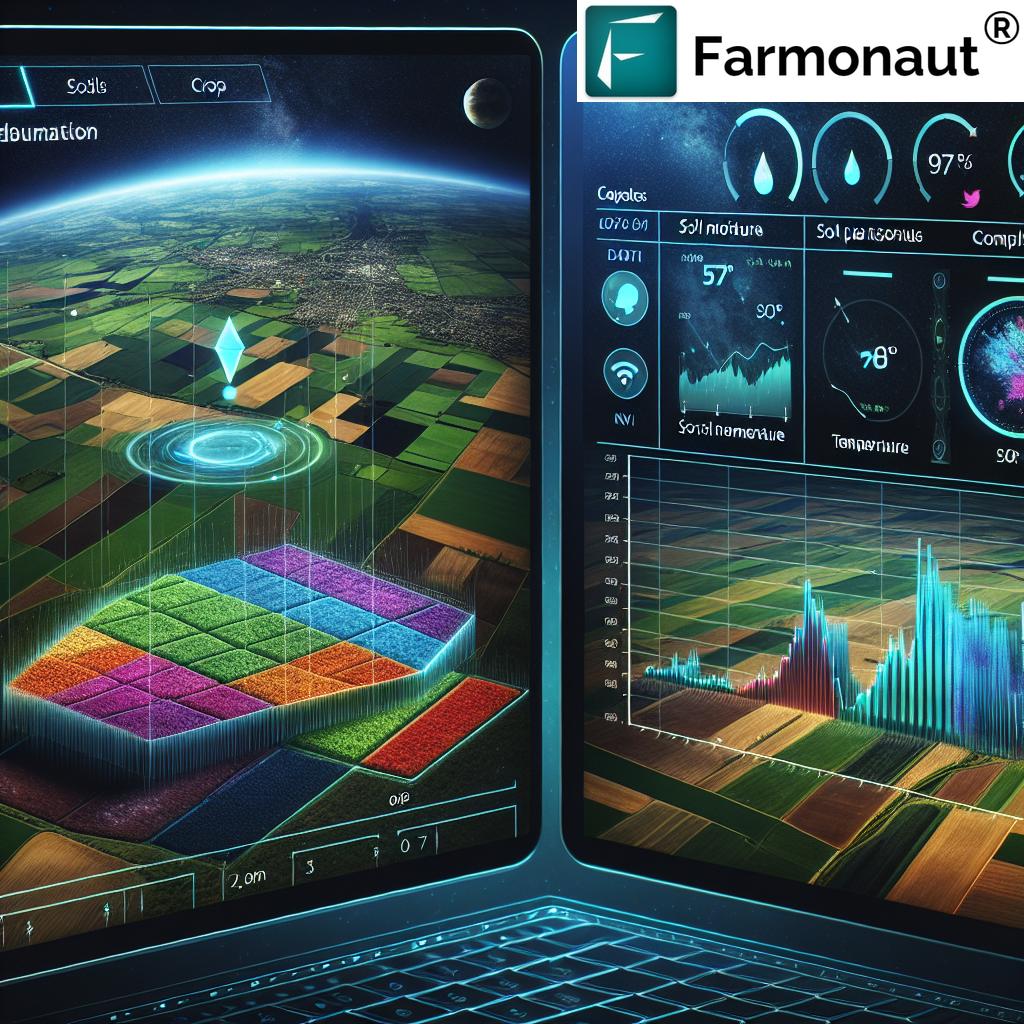
Crop analysis software combines satellite imagery, soil data, and weather feeds into a single API so a grower or an ag-tech developer can pull field-specific numbers instead of regional averages. A 2024 field trial backed by the Michigan Soybean Commission and USDA NRCS found that soil moisture sensor scheduling cut applied irrigation water by 1 inch on a commercial corn field and by 2 inches on a commercial soybean field in a single season. That is the kind of number an AI Overview will not hand you, because it depends on which API you connect, what depth you query, and how you set the trigger threshold. This piece walks through what a crop analysis API, an ag data API, a soil moisture probe, a soil suitability check, and a wind data API each actually deliver, with a calculator at the end so you can size the water savings for your own acreage.
Table of Contents
- How big is the crop analysis software market
- What an ag data API actually returns
- Soil moisture probe vs. satellite-derived moisture
- Soil suitability for crop growth: the USDA method
- Wind data API: spray drift and application timing
- Feature comparison table
- Irrigation water-savings calculator
- Getting started with an API
- FAQ
- Try it: Enter your numbers above and click Calculate.
How Big Is the Crop Analysis Software Market
The global soil moisture sensors market was valued at $273.9 million in 2024 and is projected to reach $708.9 million by 2033, a compound annual growth rate of 11.1% from 2025 to 2033, according to IMARC Group. North America held 37.1% of that global market in 2023 — the largest regional share, ahead of Europe and Asia-Pacific. On the software side, PS Market Research puts the US precision agriculture technologies market at $2.1 billion in 2024, growing to a projected $4.3 billion by 2032 at a 9.3% compound annual growth rate. USDA reported that farmer adoption of precision farming techniques rose 25% over the three years leading up to April 2024. These are demand-side numbers, not API-specific ones — no market firm currently breaks out adoption by soil-API versus weather-API versus crop-modeling-API, so treat the precision-ag totals as the ceiling, not the API segment itself.
What an Ag Data API Actually Returns
An ag data API — sometimes searched as “API in agriculture” or “farm data API” — is a programmatic endpoint that returns field-level values instead of a dashboard screenshot. Farmonaut’s Historical Soil Data API is built on polygon-based agricultural data: you draw the boundary once, and every subsequent request returns values scoped to that exact shape rather than a county-wide average. The API integrates satellite imagery and weather forecasting to produce that field-specific output for both real-time and historical queries.
The data categories most farm data API integrations pull are:
- Soil temperature at multiple depths, historical and current
- Soil moisture content through the soil profile
- UV index, historical trend and forecast
- Weather parameters — historical, current, and forecast
- satellite imagery for agriculture, used to cross-check ground sensor readings against a full-field view
The Weather Company reports that advanced weather data API integration for irrigation, fertilization, and pest management timing can improve yield by 10-18%, with the range depending on region and how tightly the API output is tied to actual field operations rather than left as a dashboard nobody checks. That range is the honest answer to “how much does an ag data API help” — it is a function of integration depth, not a fixed number the API itself guarantees.
Soil Moisture Probe vs. Satellite-Derived Moisture
A soil moisture probe is a physical sensor placed in the ground at one or more depths; it reports a direct reading from that exact spot. A satellite- or API-derived moisture estimate covers the whole polygon but is modeled rather than measured at a single point. The two are complementary rather than competing: probes ground-truth the model, and the model fills in the acres where you don’t have a probe installed.
The economic case for either comes down to irrigation scheduling. In the 2024 Michigan field trial cited above, moisture-triggered scheduling saved 1 inch of applied water on corn and 2 inches on soybeans across the season. Separately, USDA Agricultural Research Service data on irrigation efficiency (via Michigan State University Extension) found that holding soil moisture at a −85 to −100 centibar threshold before irrigating cut water application by as much as 40% for the crop-specific conditions tested, while maintaining or improving yield — and that optimized moisture scheduling carries a yield improvement potential of about 3% depending on crop and field conditions.
Farmonaut’s soil analysis reports temperature and moisture at multiple depths rather than a single surface reading, which is the same principle a multi-depth physical probe uses — the API version just does it across the whole field polygon instead of one install point.


Soil Suitability for Crop Growth: The USDA Method
“Soil suitability for crop growth” queries are usually looking for a rating: is this parcel good for corn, soybeans, or a given rotation? In the United States, the authoritative free source is USDA Soil Data Access (SDA), which provides soil suitability ratings, moisture properties, and crop yield estimates for any US location. SDA is refreshed on a rolling basis as NRCS completes new soil surveys throughout the year — there is no fixed annual release date, so the durable move is to query the live endpoint at sdmdataaccess.nrcs.usda.gov for your parcel rather than relying on any cached figure, including ours.
Farmonaut’s contribution on top of the raw SDA layer is the field-specific overlay: instead of reading a soil-survey polygon that might span several unrelated farms, our agritech soil analysis reports composition, nutrient distribution, and moisture at multiple depths clipped to your exact field boundary. That combination — public soil-survey baseline plus your own polygon — is what turns a suitability rating into a planting decision.
What “Kaegro Global Soil API” Searches Are Looking For
A small number of searches reach this page looking for a “kaegro global soil API” or similarly named soil-suitability-as-a-service product. We could not find published pricing or a public specification for that name in the sources available for this review — vendor pricing for soil APIs is typically disclosed only on request, not in peer-reviewed or government sources, so we are not going to guess at a number. If you’re comparing options, request a quote directly from each vendor and check what depth range, refresh frequency, and polygon precision each returns before comparing price per acre. Farmonaut’s own API portal (linked below) lists current plans directly.
Wind Data API: Spray Drift and Application Timing
A wind data API feeds wind speed and direction into a spray-timing decision. Visual Crossing reports that optimizing spray applications using wind speed and humidity API data improved chemical application efficacy by 15%, primarily by reducing drift loss when applications are timed around calmer wind windows rather than a fixed calendar schedule. Farmonaut’s weather data module includes historical weather patterns, current conditions, short-term and long-term forecasts, and accumulated weather parameters — wind among them — so a spray decision can be checked against both the current reading and the multi-day forecast before equipment rolls.
UV index is the other atmospheric input worth tracking alongside wind: high UV periods raise water stress and can compound with wind-driven evaporative loss during spraying or irrigation. Farmonaut tracks daily and seasonal UV trends so both risks can be checked together rather than separately.

Feature Comparison: What Each API Layer Covers
| Data Layer | Historical Coverage | Current / Live | Forecast | Primary Use |
|---|---|---|---|---|
| Soil Temperature | Past 5 years, 10cm-100cm depths | Real-time, 0-100cm depths | 7-day, 0-50cm depths | Planting date timing |
| Soil Moisture | 5-year history, multiple soil layers | Live readings, surface to 1m | 5-day moisture predictions | Irrigation scheduling |
| Soil Suitability | USDA SDA rolling survey archive | Current survey layer | Not applicable (static land classification) | Crop/parcel selection |
| Wind / Weather | 10-year weather history | Real-time conditions | 14-day forecast | Spray timing, drift control |
| UV Index | Past 3 years | Daily updates | 3-day forecast | Heat/sun stress management |
The row that AI Overviews consistently flatten is the soil suitability one: a generic answer will tell you “check your local soil survey,” but it won’t tell you that USDA’s SDA layer updates continuously rather than annually, which means a suitability rating you pulled a year ago may already be stale for a parcel that got resurveyed.
Irrigation Water-Savings Calculator
Use the field trial figures above to estimate your own season’s water savings from moisture-triggered scheduling instead of a fixed calendar schedule. Enter your crop’s per-season baseline, your acreage, and your local water cost.
Enter your numbers above and click Calculate.
Assumptions: based on a single 2024 commercial-field trial (Michigan Soybean Commission / USDA NRCS) showing 1 inch saved on corn and 2 inches saved on soybeans over one growing season using soil moisture sensor-triggered scheduling versus calendar-based irrigation. Excludes equipment, sensor, or API subscription costs; excludes rainfall variability, soil type differences, and years other than the trial season. Treat the output as a planning estimate, not a guarantee for your field.
Getting Started with an Agricultural Monitoring API
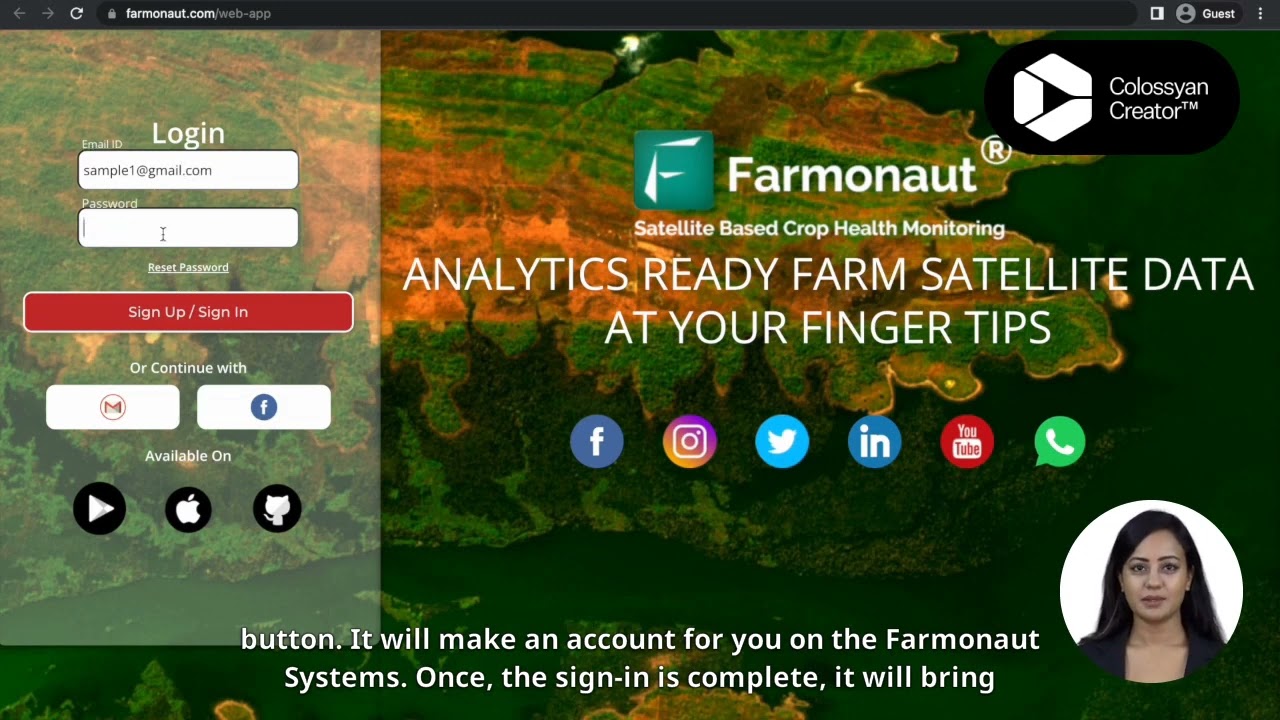
Our agricultural monitoring API is built as a RESTful integration point for developers and ag-tech companies who need to build the soil, weather, and wind data described above into their own applications rather than working inside a standalone dashboard.

- Visit the API portal to create an account and view current plan pricing
- Review the API documentation for endpoint structure and authentication
- Choose a subscription plan sized to your polygon count and query volume
- Integrate the soil, weather, or wind endpoints into your existing farm management or agronomy software
The platform also supports data-driven farming workflows end to end — NDVI-based crop health monitoring, yield prediction, pest and disease risk assessment, and resource management sit alongside the soil and weather API layers described above, and the same underlying agricultural innovation platform is available through the apps below.



Subscription Plans
Frequently Asked Questions
Q: How often is USDA soil suitability data updated?
A: USDA Soil Data Access is refreshed on a rolling basis as NRCS completes new soil surveys throughout the year — there is no single annual release date. Query sdmdataaccess.nrcs.usda.gov directly for the current survey status on your parcel.
Q: What does a soil moisture probe measure that an API can’t?
A: A physical probe gives a direct point reading at its installed depth; an API-derived estimate models moisture across a whole field polygon. Use probes to ground-truth API estimates on fields with variable soil types.
Q: How much water can soil moisture sensor scheduling actually save?
A: In a 2024 field trial backed by USDA NRCS, corn saved 1 inch and soybeans saved 2 inches of applied irrigation water over the season versus calendar-based scheduling. Under a −85 to −100 centibar moisture threshold, USDA Agricultural Research Service data shows water application reductions of up to 40% for the crop-specific conditions tested.
Q: Is there a published price for “kaegro global soil API” or similar soil-suitability services?
A: We found no published pricing for that specific product name. Vendor soil API pricing is typically available only on request; contact vendors directly and compare depth range, refresh frequency, and polygon precision.
Q: Can a wind data API reduce spray drift?
A: Yes — Visual Crossing reports a 15% improvement in spray application efficacy when applications are timed using wind speed and humidity API data rather than a fixed schedule.
Q: How far back does Farmonaut’s historical soil and weather data go?
A: Soil temperature and moisture history extends 5 years; weather history extends 10 years; UV index history extends 3 years, each at the depth ranges shown in the comparison table above.
The Bottom Line on Crop Analysis Software
Crop analysis software earns its keep when the numbers are field-specific and the source is checkable: USDA’s SDA for soil suitability, a 2024 NRCS-backed trial for irrigation savings, and vendor-specific weather and wind APIs for spray and yield timing. None of those figures are static — SDA updates continuously, and market sizing from IMARC Group and PS Market Research is revised annually each January through March — so the durable habit is checking the source link at the point of decision rather than trusting a cached number, including the ones in this article a year from now.

 Kisanwala
 Agro La Gándara
 Global Agrifood
 HIPSAC
 ZOL Zimbabwe
 Juligerm
 AdBio
AdBio MISE Maroc
 NWNS
NWNS Red August Group
 Farm Inc
 WeMe Global
 Agrotoken
 Blue BearX
 Insignito
 Croptimum
 DnCubed
 Field Capacity
 Indosistim Teknologi
