

Farm technology · Cost and return guide
Farming Technology Costs and Returns: 7 Tools Compared
Farming technology ranges from low-cost satellite crop maps to a $623,657 tractor (farmdoc daily, 2025). Guidance, section control and variable rate add about 5% to US crop output on average (AEM). Here is what each tool costs, what it returns and who it suits.
Key takeaways
- A 310 HP tractor listed at $623,657 in 2025 and cost $255.80 an hour to run (farmdoc daily).
- Guidance, section control and variable-rate application raise US crop output by about 5% on average (AEM).
- 22% of US farms used precision practices in 2025, down from 27% in 2023 (USDA NASS).
- The largest farms adopt guidance far more often than the smallest: 73% against 10% for corn in 2016 (USDA ERS).
- Drones, field robots and smart irrigation have no national cost benchmark, so test them on your own fields.
In this article
- Farming technology costs and returns at a glance
- How many farms use farming technology now
- 1. Precision guidance and variable rate: the clearest return
- 2. Autonomous equipment: high cost, labor savings
- 3. Drones and satellite remote sensing: cheap to start, low adoption
- 4. Field robots: labor relief for specialty crops
- 5. Smart irrigation: water and pumping savings
- 6. Biotechnology and nanotechnology: seed and sensor advances
- 7. Traceability and controlled-environment farming
- Hidden costs to price in before you buy
- How to choose farming technology for your farm
- Calculator: farming technology payback on your acreage
- How we checked the numbers
- FAQ
Farming technology costs range from low-cost satellite crop maps to well over half a million dollars for one large tractor. A 310 HP tractor listed at $623,657 in 2025 and cost $255.80 an hour to run, according to farmdoc daily machinery cost estimates (University of Illinois, September 2025). On the return side, auto guidance, section control and variable-rate application raise US crop output by an average of 5%, says the Association of Equipment Manufacturers (AEM).
This guide compares seven groups of farming technology by cost, documented return and the kind of farm each one suits. It uses public figures from USDA, land-grant universities and industry bodies, and it says plainly where no independent figure exists. You also get three charts and a payback calculator you can fill in with your own acres, yields and prices.
Farming technology costs and returns at a glance
Each group of tools solves a different problem: wasted inputs, labor hours, water, or proof of origin. The right first step depends on which of those costs hurts your farm most. The table sums up what the public record shows. Each row has its own section below.
| Technology | Main job | Public cost figure | Public return figure | Best for |
|---|---|---|---|---|
| Precision guidance | Cut overlaps and skips | Often built into new machines; paid correction signals extra | Part of AEM’s 5% average output gain | Row crops, mid to large farms |
| Autonomous machines | Cut operator hours | 310 HP tractor $623,657 list (2025) | No independent national yield figure | Large farms short of drivers |
| Drones and satellites | Find problem zones fast | Vendor pricing | Used on under 10% of planted acres of major crops (ERS) | Large or patchy fields |
| Field robots | Weed and plant without a driver | Vendor pricing | No public aggregate figure | Specialty crops short of labor |
| Smart irrigation | Match water to crop need | Vendor and utility pricing | Varies by soil and crop; use extension trials | Dry or metered regions |
| Biotech and nano | Traits and diagnostics | Trait fees vary by seed | Trait-specific | Crops with a known pest or drought risk |
| Traceability and CEA | Prove origin; grow indoors | Platform pricing; high energy cost indoors | Traceability is a market access tool, not a yield tool | Fresh produce sellers; urban growers |
“Vendor pricing” means no US agency publishes a comparative cost for that product type. Treat any return claim there as a claim to test on your own fields.
How many farms use farming technology now
Use is high on large row-crop farms and much lower on small and mixed farms. In the NASS Technology Use (Farm Computer Usage and Ownership) report of August 2025, 22% of US farms said they used precision agriculture practices to manage crops or livestock, down from 27% in 2023. The same survey found that 85% of farms had internet access and 82% had a smartphone.
The drop was wide. Iowa fell from 54% to 42% of farms, Nebraska from 55% to 41% and Kansas from 49% to 34%. A few states rose, such as Minnesota (32% to 36%) and Georgia (13% to 18%). NASS asks a single yes-or-no question, so the figure counts farms, not acres. A large share of acres can still be managed with these tools even when the share of farms falls.
Acre-based data from USDA’s Economic Research Service (ERS) tells that second story. Its report Precision Agriculture in the Digital Era (2023) found that GPS was used on about 12% of US farms in 2019, yet those farms covered 40% of all farm and ranch acres.
Chart
Farms using precision agriculture, 2023 vs 2025
Percent of farms using precision practices to manage crops or livestock, selected states and US
1. Precision guidance and variable rate: the clearest return
Precision agriculture means reading each part of a field and treating it to match: guidance steers the machine, section control shuts off nozzles or rows that would overlap, and variable-rate technology (VRT) changes the seed or fertilizer rate as the machine moves. These are the farming technology tools with the best public evidence.
▶ Six plain steps to start precision agriculture without buying a robot. · 4:18
AEM’s study puts the average gain at 5% of US crop output, with about 6% more possible if more farms adopt the same tools. AEM also worked one example: a 5% yield increase on 1,000 acres can add about $66,000 in yearly revenue. That is gross revenue, not profit. It depends on the crop, the yield and the price in that example.
How guidance saves money
- Fewer overlaps: the ERS feature Most Row Crop Acreage Managed Using Auto-steer and Guidance Systems (April 2023) lists lower energy costs, lower input use, less soil compaction and less operator fatigue as possible gains.
- Fewer skips: missed strips lose yield; guidance closes them.
- Better use of the cab: with auto-steer the operator can check weather or prices while the machine holds the line.
- Signal cost: basic satellite positioning costs nothing extra, but some makers charge activation and subscription fees for higher accuracy, ERS notes.
Adoption is now the norm on big row-crop acres. ERS reports that guidance covered 58.4% of corn acres in 2016, 54.5% of soybean acres in 2018, 55.9% of winter wheat acres in 2017 and 64.5% of cotton acres in 2019. Sorghum reached 72.9% in 2019. Back in 2001, guidance covered 5.3% of corn acres.
Farm size matters
The gap between small and large farms is large. Among the largest corn farms in 2016 (1,725 acres or more), 73% used guidance. Among the smallest (200 acres or fewer), 10% did. Winter wheat showed 82% against 7%, and soybeans 68% against 11%. Cotton was the exception: even the smallest cotton farms reached 50%. ERS links this to scale: the returns to the technology can be greater on larger farms.
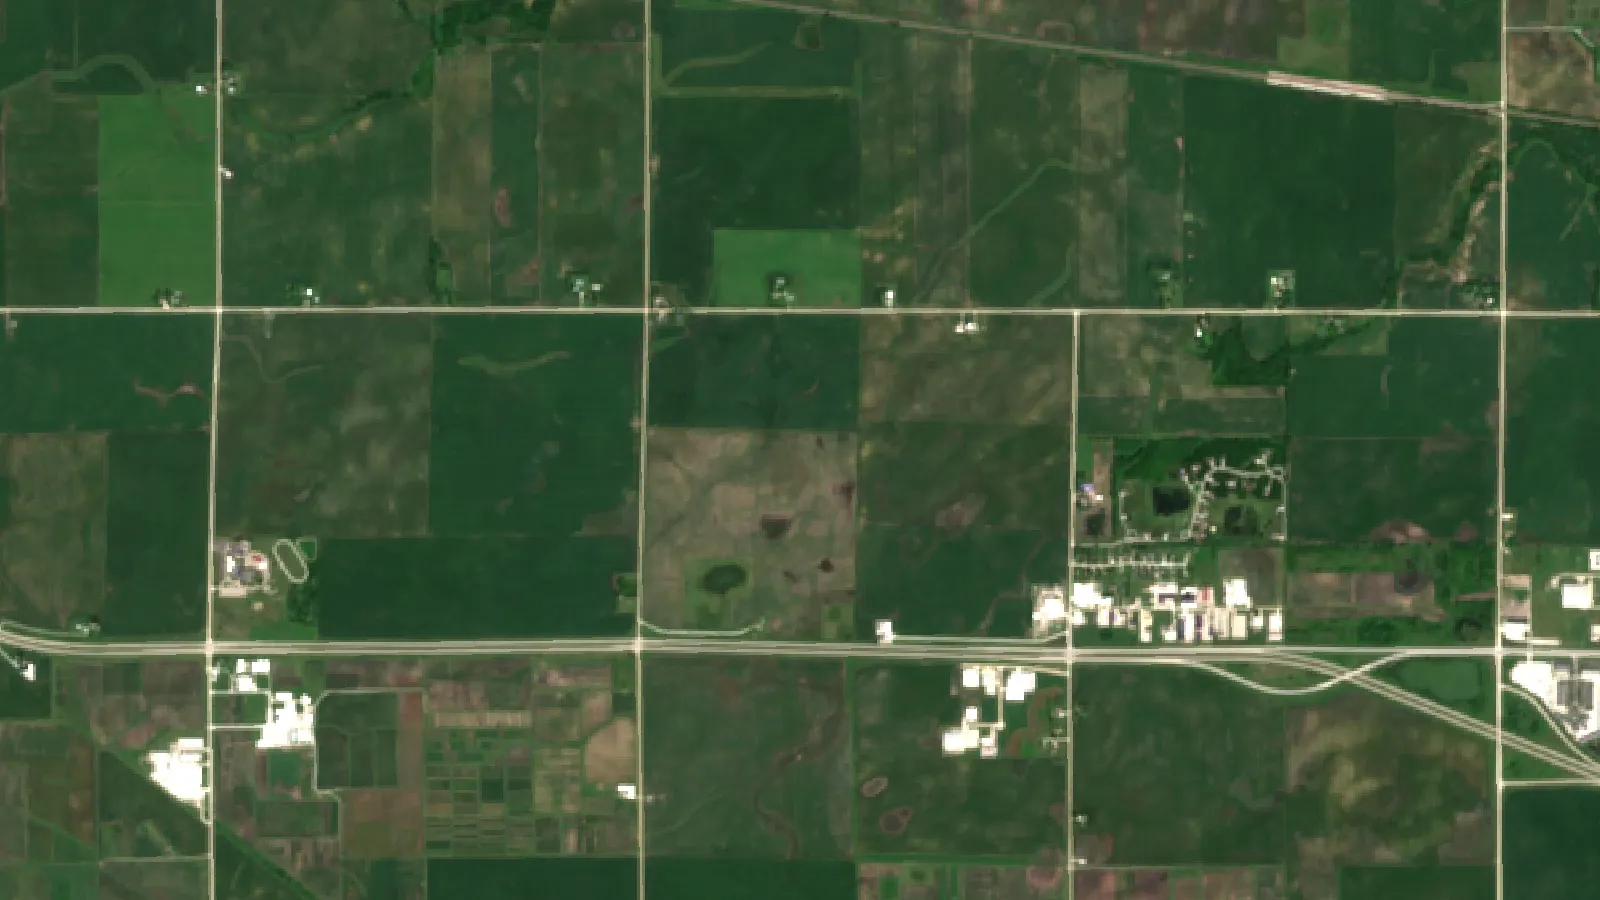
For farms that cannot justify new machines, satellite crop maps are a lower-cost way into the same idea of field zones. You can watch crop vigor change across each field through the season, then target scouting and inputs to the weak areas. For a plain start, see our guide to the sustainable agriculture solutions that support food security.
Chart
Planted acres managed with auto-steer and guidance
Percent of planted acres, by crop and survey year
2. Autonomous equipment: high cost, labor savings
Autonomous and driver-assist machines use GPS, cameras and other sensors to follow a route, avoid obstacles and adjust to the field. The main gain is fewer operator hours, not higher yield. That makes the capital cost the deciding number.
The farmdoc daily estimates show how fast that cost has grown. The hourly cost to run a 310 HP tractor rose from $163.30 in 2017 to $255.80 in 2025. Most of that jump came between 2021 and 2023 (up 32%). From 2023 to 2025 it rose 3%, the smallest two-year rise since 2016. In 2025 the hourly cost split into $186.80 overhead, $44.80 fuel (13.6 gallons at $3.00) and labor at $22 per hour, counted at 1.1 hours per tractor hour.
What autonomous machines do
- Driverless tillage and planting: the machine follows a planned path while a person supervises from a distance.
- Harvest assist: the combine adjusts speed and settings to crop and field conditions.
- Grain cart automation: a cart tractor follows the combine without a second driver.
- Small robots: light units plant or weed at night and in wet spells when heavy machines cannot run.
Labor savings depend on what one operator hour costs you and how many hours the machine runs. At farmdoc’s 2025 rate, labor was a small part of the hourly total; overhead was by far the largest. So for most farms the question is whether the machine’s extra overhead is lower than the wages and timeliness losses it replaces.
A second cost is service. A January 2026 farmdoc daily article, The People Behind the Machines, cites a Bureau of Labor Statistics estimate of about 36,830 farm equipment mechanics and service technicians employed in the US in 2023, and notes industry reports of a shortage. A breakdown at planting with a long wait for a technician can cost more than the machine saved. Ask your dealer about service response times before you buy.
Chart
Hourly cost to run a 310 HP tractor
US$ per tractor hour (overhead, fuel and labor), Illinois estimates
3. Drones and satellite remote sensing: cheap to start, low adoption
Drones, planes and satellites take pictures of crops in several light bands. Plant health indexes such as NDVI turn those pictures into maps that show where crops are stressed. A drone flight covers a field in minutes; a satellite pass covers every field you farm at once, every few days when clouds allow.
Use is still low. ERS found that drone, aircraft or satellite imagery was used on under 10% of planted acres for each major crop it surveyed between 2016 and 2019. VRT use was more common than imagery. Use of all four tool types together (maps, VRT, guidance and imagery) was 2% to 5% of acres.
Where imagery helps most
- Faster scouting: walk only the zones the map flags instead of the whole field.
- Irrigation checks: uneven water shows up as uneven crop vigor.
- Zone maps for VRT: several seasons of images help draw management zones.
- Forests and woodlots: imagery helps spot canopy loss and stress; see our guide on forestry management in California.
Spraying by drone is a separate case. In the US, 14 CFR Part 137 covers aircraft, including drones, that dispense or spray substances, and operators also need a remote pilot certificate and registered aircraft, per the Federal Aviation Administration. Other countries have their own rules. Always follow the product label and local rules, and check with your aviation regulator before spraying by drone.
For more on aerial tools, read our overview of agriculture drones and drone images.

▶ How to monitor fields with satellite crop health maps in a web app. · 8:43
4. Field robots: labor relief for specialty crops
Field robots use cameras and software to tell crops from weeds, then remove weeds by blade, laser or a precise spot spray. Others plant, thin or harvest. Most work slowly, so they suit high-value vegetables, fruit and nursery crops more than broadacre grain.
- Precise weeding: mechanical or spot treatment can cut herbicide passes in some crops.
- Planting and thinning: robots place or remove plants one at a time.
- Long hours: robots can run at night, when hired crews are scarce or costly.
No US agency publishes a national cost or yield figure for field robots. Prices come from makers and dealers, often as a lease or a per-acre service fee. Before signing, ask for results from farms with your crop and soil type, and run a strip trial against your current method.
5. Smart irrigation: water and pumping savings
Smart irrigation links soil moisture sensors, weather forecasts and remote valve or pivot control. The goal is to water when the crop needs it rather than on a fixed calendar, which can cut water and pumping energy.
The scale is large. The NASS 2023 Irrigation and Water Management Survey counted 212,714 US farms irrigating 53.1 million acres with 81 million acre-feet of water. Water use was down 2.8% from 2018, and the average stayed at 1.5 acre-feet per acre.
How the parts work together
- Soil moisture sensors: probes at several depths show when the root zone is drying.
- Weather-based control: controllers skip a cycle when rain is forecast.
- Remote control: start, stop or change a pivot from a phone.
- Solar pumps: in remote blocks, solar power can replace diesel for small pumps.
Savings differ by soil, crop and water price, so there is no single national figure. Your state or provincial extension service and your irrigation district often publish local trial results. Satellite water and vigor indexes can also show which parts of a pivot or block are dry, which helps decide where to put sensors first.

▶ How the NDWI water index from satellites helps track crop water status. · 7:57
6. Biotechnology and nanotechnology: seed and sensor advances
Biotechnology
- Seed traits: breeding and genetic engineering add resistance to drought, insects or disease.
- Biological inputs: biofertilizers and biostimulants aim to improve nutrient uptake and soil health.
Trait costs are built into the seed price and vary by company and trait package, so no single cost-per-acre figure applies. Compare trait and non-trait yields in your area using university variety trials.
Nanotechnology
- Nanosensors: tiny sensors in soil or plant tissue that report water, nutrients or pH.
- Targeted delivery: coatings that release fertilizer or crop protection products slowly or on a trigger.
Most nanotech tools are still at the research or early market stage. Check the label and local registration rules for any new product, and get advice from an agronomist before changing rates.
These inputs also feed into emissions and sustainability reporting; our page on carbon footprint tracking covers how farm emissions are measured.
7. Traceability and controlled-environment farming
Traceability and blockchain
Traceability systems record where food came from and how it moved. Some use blockchain, a shared ledger that is hard to change once written. A 2025 study in Frontiers in Sustainable Food Systems found that how easy and useful shoppers find such systems shapes whether they accept them.
In the US, rules matter more than the technology itself. The FDA’s Food Traceability Rule requires extra records for certain foods. The original compliance date was 20 January 2026; FDA proposed moving it to 20 July 2028, and Congress directed FDA not to enforce the rule before that date. Growers who sell listed foods should plan their record-keeping now. Check the rule and get advice for your own products.
Controlled-environment agriculture (CEA)
- Vertical and hydroponic farms: year-round growing indoors with less land and water.
- Climate control: set light, heat and humidity regardless of the weather outside.
- Pest control: closed rooms can reduce pest pressure.
Energy is the catch. A 2025 paper, Vertical farming limitations and potential, estimates a minimum cost of about $10 per kg of dry plant matter, so vertical farms cannot yet compete with field-grown cereals or pulses. USDA’s Agricultural Research Service also names artificial light and climate control as the main costs. Leafy greens and herbs remain the usual crops.
Hidden costs to price in before you buy
The sticker price is the start of the bill, not the end. Several costs show up only after the tool arrives, and they decide whether the payback holds.
- Subscriptions: correction signals, software seats, data storage and map layers are often billed every year. Add them to the yearly cost, not the purchase.
- Compatibility: a new display or controller may not talk to older implements. Adapters, new harnesses or a second display add cost and set-up time.
- Training: every operator needs time to learn the system. A wrong setting in spring can waste more seed or fertilizer than the tool saves all year.
- Service and downtime: ask how far the nearest trained technician is and how fast parts arrive during planting and harvest.
- Connection: some tools need a cellular signal in the field to send maps or receive corrections. Check coverage on your own fields before you buy.
- Your own time: data has value only if someone reads it and acts. Budget a few hours a week in the season to review maps and records.
Data ownership is also worth a question. Read the contract to see who can use your field and yield data, whether you can export it in a standard format, and what happens to it if you stop paying. A tool that locks your records inside one brand can raise the cost of switching later.
Resale value cuts the other way. Guidance displays and receivers can often move from one machine to the next, and well-kept machines with modern technology may hold their value better at trade-in. Ask your dealer for recent trade-in values on similar units before you settle on a yearly cost.
How to choose farming technology for your farm
Start with the cost that limits you, not the newest tool. A simple order works for most farms.
- Name the constraint. Is it labor, input cost, water, or market access? Each points to a different group above.
- Check public evidence. Look for a USDA, extension or university figure for the tool. If none exists, treat the vendor’s number as a claim to test.
- Price the full cost. Include purchase or lease, subscriptions, training, service and the time you spend on data.
- Start small. Try one field or one block for a season, with a check strip that keeps your current method.
- Measure and decide. Compare yield, input use and hours. Keep the tool only if the gain covers its yearly cost.
Lower-cost data tools are a sensible first step for small and mid-size farms, since the ERS data show the largest farms adopt machine-based tools first. Larger farms often already own guidance and can gain most from adding VRT and imagery to the same machines.
Calculator: farming technology payback on your acreage
Enter your acres, yield, price, the yield gain you expect, and the yearly cost of the technology per acre. The calculator shows the extra revenue and the net result. It uses the same method AEM used for its 1,000-acre example, but with your own numbers.
The default numbers are examples set close to break-even, not a forecast. They exclude financing, tax, and year-to-year swings in weather and prices. Put in a cost that covers purchase spread over the years you will use it, plus any subscriptions and service.
Try the numbers for your own farm below.
Calculator
Does a precision tool pay for itself on your acres?
Enter your own acres, yield, price, expected gain and yearly technology cost.
- Extra revenue per year: $8,000
- Technology cost per year: $8,000
- Break-even yield gain: 1.00 %
Example values only, set near break-even; not a benchmark or a forecast. Every number is your input. Method follows AEM’s worked example (extra revenue = acres x yield x gain x price). Excludes financing, tax and yearly swings in weather and prices.
How we checked the numbers
We used public sources only and give the year for each figure. Machine costs come from farmdoc daily (University of Illinois), which bases its estimates on American Society of Agricultural Engineers formulas and assumes a purchase price of 85% of list. Adoption data come from USDA NASS (a farm survey, counting farms) and USDA ERS (counting planted acres). The yield gain comes from AEM, an industry body whose members make farm equipment, so read it as an industry estimate. Where no public figure exists, we say so in the table instead of giving a vendor number.
FAQ
How do different ag-tech products compare in terms of cost and effectiveness?
The clearest public figures are for machine costs and precision guidance. A 310 HP tractor listed at $623,657 and cost $255.80 an hour to run in 2025 (farmdoc daily). Guidance, section control and VRT add about 5% to US crop output on average (AEM). Drones, field robots and smart irrigation have no national cost or yield benchmark, so compare them with trials on your own fields.
Which crop production aids are most effective for large-scale farming?
For large row-crop farms, guidance, section control and variable-rate application have the strongest public evidence. ERS data show 67% to 82% of the largest corn, soybean, wheat and cotton farms used guidance in the years surveyed. Imagery and VRT build on the same machines.
Is farming technology worth it for small farms?
It can be, but the payback is harder on fewer acres. ERS found that 7% to 11% of the smallest corn, wheat and soybean farms used guidance. Small farms often start with lower-cost tools such as satellite crop maps, phone apps and soil moisture sensors.
Are fewer farms using precision agriculture?
By farm count, yes in the latest survey. NASS reported 22% of US farms used precision practices in 2025, against 27% in 2023. By acres, guidance still covers more than half of the major row-crop acreage in ERS data.
Do I need a license to spray with a drone?
In the US, spraying by drone falls under FAA Part 137, and operators need a remote pilot certificate and registered aircraft. Pesticide applicator rules also apply. Follow the product label and local rules, and check with your regulator in other countries.
What are the main challenges to automating farm operations?
High capital cost, service and technician access, training, data privacy, and connection quality in the field. Rising overhead has been the biggest part of machine costs in recent years, per farmdoc daily.
Related pages on our site: satellite crop monitoring, mobile field apps, web field maps, field data API, weather and satellite API docs, fleet tracking, supply chain traceability, crop loans and insurance.
Farmonaut crop monitoring
See your own fields from space
Draw your fields once and Farmonaut shows satellite crop health maps for them through the season, on web, Android or iOS.




Keep reading
Sources
- farmdoc daily, University of Illinois, Machinery Cost Estimates for 2025 (September 2025): farmdocdaily.illinois.edu
- Association of Equipment Manufacturers, The business case for precision agriculture: productivity gains add up: aem.org
- USDA NASS, Technology Use (Farm Computer Usage and Ownership) (August 2025): esmis.nal.usda.gov
- USDA ERS, Precision Agriculture in the Digital Era: Recent Adoption on U.S. Farms, EIB-248 (2023): ers.usda.gov
- USDA ERS Amber Waves, Most Row Crop Acreage Managed Using Auto-steer and Guidance Systems (April 2023): ers.usda.gov
- farmdoc daily, The People Behind the Machines: Precision Agriculture and Farm Service Technician Demand (January 2026): farmdocdaily.illinois.edu
- Federal Aviation Administration, Dispensing Chemicals and Agricultural Products (Part 137) with UAS: faa.gov
- USDA NASS, 2023 Irrigation and Water Management data now available (October 2024): nass.usda.gov
- Frontiers in Sustainable Food Systems, Consumer adoption of food blockchain traceability (2025): frontiersin.org
- US FDA, FSMA Final Rule on Requirements for Additional Traceability Records for Certain Foods: fda.gov
- Vertical farming limitations and potential demonstrated by back-of-the-envelope calculations (PMC, 2025): pmc.ncbi.nlm.nih.gov
- USDA ARS, Vertical Farming: No Longer A Futuristic Concept: ars.usda.gov
Discussion
Questions, corrections or field experience? Share them below. First-time comments are reviewed before they appear, and your email is never published.
No comments yet. Be the first to add a question or your experience.

 Crossprod
 Patrick America
 Liquify Digital
 CU Foods
 BeyondTech Global
 Rouge VC
 AgroGreen Dynamics
 AgroRisk
 Oath Inc
 Reddane Farming
 Esri North East Africa
 Cresol
 MDCV UK
 Zerella Group
 Etech Consulting Madagascar
 Vestlandsforsking
 Delicio
 WB Dev
 Sama Premium
 Prochecker
 Tres Valles
 LACOS Geoinformation
 Magrifly
 LatConnect 60
 Blickwinkel
 Agricultural Credit Policy Council
 eKGIS
 Mostas Tech

 Exploration consultancy · South Africa · Gold
 Licence holder · Niger · Gold
 Client · Tanzania · Gold
 Client · Somalia · Gold










