Mastering NDWI with Sentinel-2: A Comprehensive Guide to Water Index Analysis
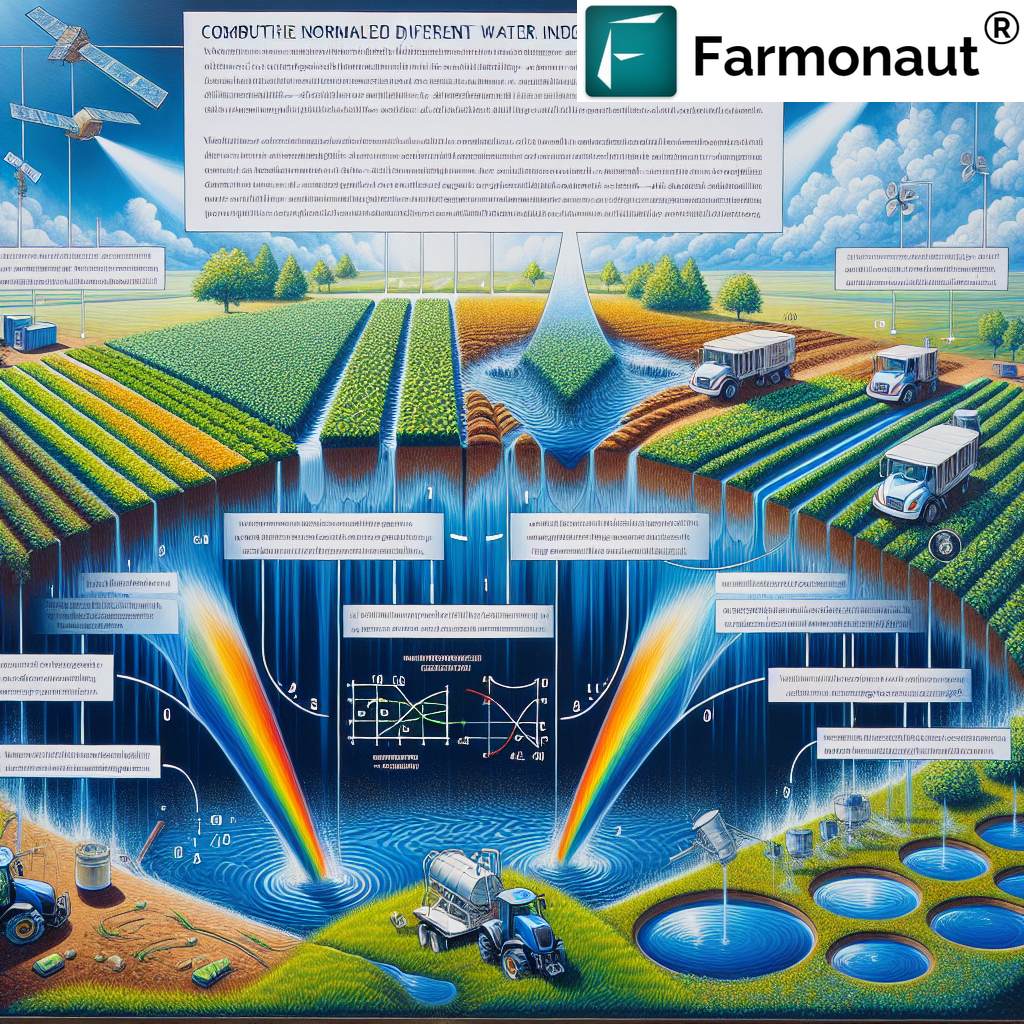
In the ever-evolving landscape of remote sensing and agricultural technology, we at Farmonaut are committed to providing cutting-edge solutions that empower farmers and environmental researchers alike. One of the most powerful tools in our arsenal is the Normalized Difference Water Index (NDWI) derived from Sentinel-2 satellite imagery. In this comprehensive guide, we’ll explore the intricacies of NDWI Sentinel-2 analysis, its applications, and how it can revolutionize water resource management and crop health monitoring.
Table of Contents
- Understanding NDWI and Sentinel-2
- The Science Behind NDWI Calculation
- Applications of NDWI in Agriculture and Environmental Monitoring
- Farmonaut’s Approach to NDWI Analysis
- Comparing Satellite, Drone, and IoT-based Farm Monitoring
- Step-by-Step Guide to Performing NDWI Analysis with Sentinel-2 Data
- Interpreting NDWI Results
- Case Studies and Success Stories
- Future Trends in Water Index Analysis
- FAQ Section
1. Understanding NDWI and Sentinel-2
The Normalized Difference Water Index (NDWI) is a remote sensing-derived index that helps identify water bodies and assess water content in vegetation. It’s an essential tool for monitoring drought conditions, assessing soil moisture, and tracking changes in water resources over time.
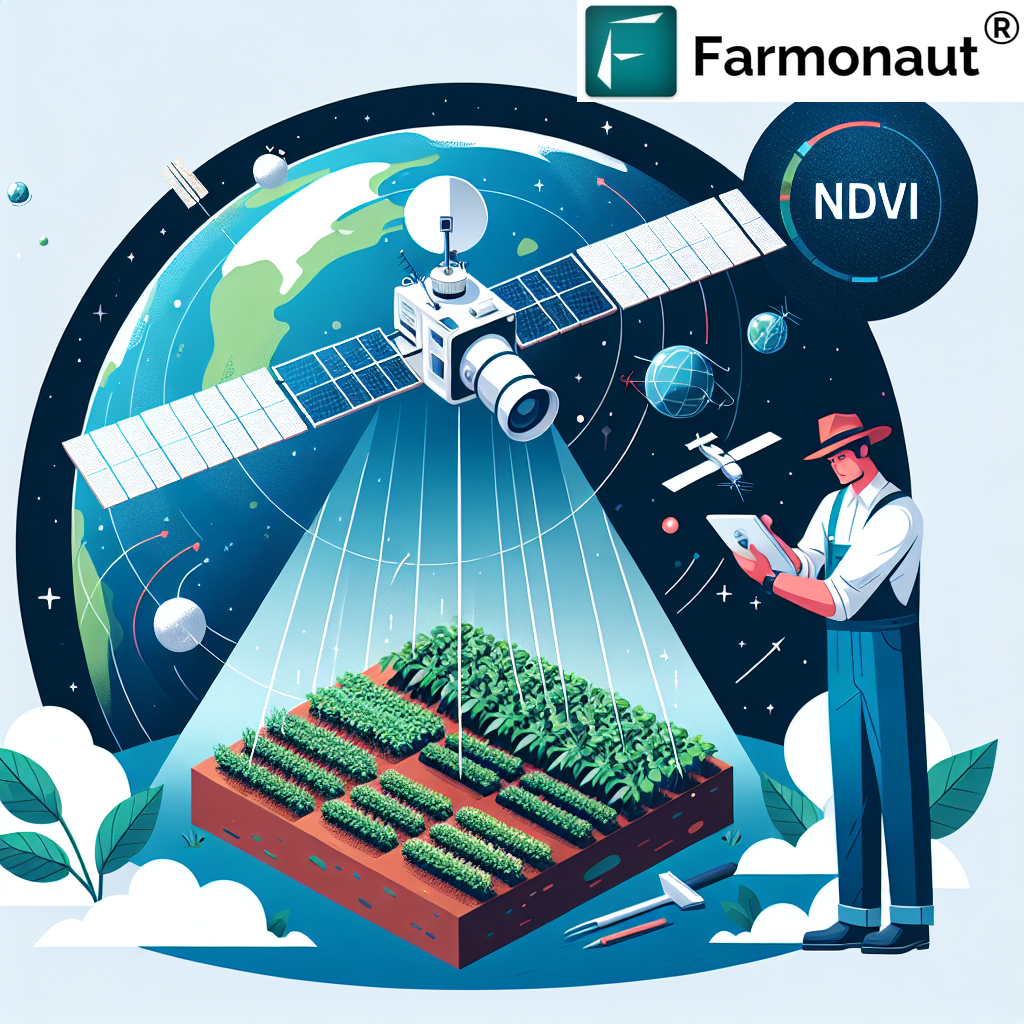
Sentinel-2 is a constellation of Earth observation satellites developed by the European Space Agency (ESA) as part of the Copernicus program. These satellites provide high-resolution multispectral imagery, making them ideal for calculating indices like NDWI.
2. The Science Behind NDWI Calculation
The NDWI Sentinel-2 calculation utilizes specific bands from the satellite’s multispectral sensor. The formula for NDWI is:
NDWI = (Green – NIR) / (Green + NIR)
Where:
- Green: Reflectance in the green band (Band 3 for Sentinel-2)
- NIR: Reflectance in the near-infrared band (Band 8 for Sentinel-2)
This formula leverages the fact that water absorbs near-infrared light while reflecting green light. The resulting index ranges from -1 to 1, with higher values indicating a higher likelihood of water presence.
3. Applications of NDWI in Agriculture and Environmental Monitoring
The Sentinel-2 NDWI has numerous applications across various sectors:
- Agriculture: Assessing crop water stress, irrigation management, and flood monitoring
- Hydrology: Mapping water bodies, tracking seasonal changes in water resources
- Forestry: Monitoring forest health and assessing fire risk
- Urban Planning: Identifying impervious surfaces and urban heat islands
- Disaster Management: Flood extent mapping and drought monitoring
4. Farmonaut’s Approach to NDWI Analysis
At Farmonaut, we’ve integrated NDWI Sentinel-2 analysis into our suite of precision agriculture tools. Our platform processes raw Sentinel-2 imagery to provide farmers and researchers with actionable insights on water content and crop health.
Key features of our NDWI analysis include:
- Automated processing of Sentinel-2 imagery
- Time-series analysis for tracking changes over time
- Integration with other vegetation indices for comprehensive crop health assessment
- User-friendly visualization tools for easy interpretation
- API access for seamless integration with existing systems
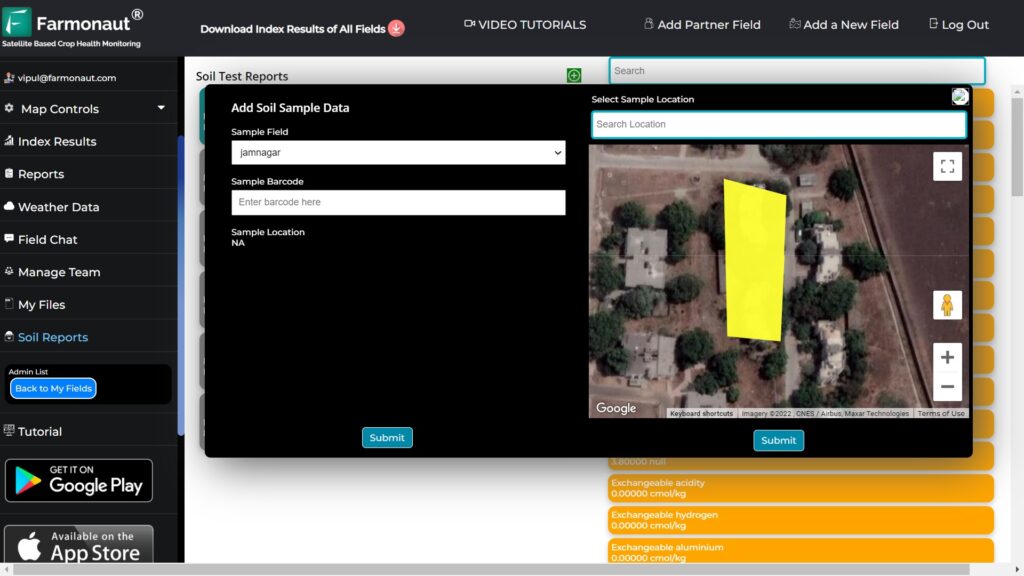
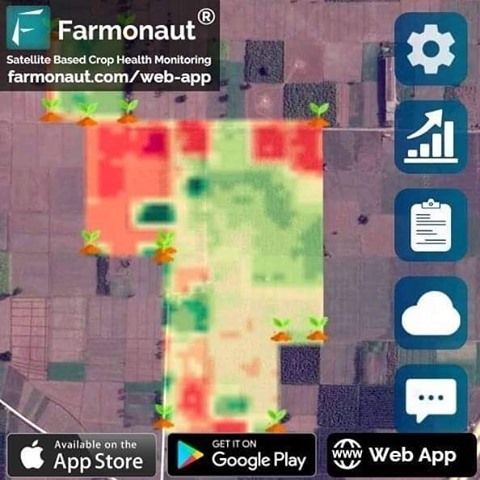
To explore our NDWI analysis tools, visit our Farmonaut Web App or download our mobile app for Android or iOS.
5. Comparing Satellite, Drone, and IoT-based Farm Monitoring
While drones and IoT sensors have their place in precision agriculture, satellite-based monitoring offers unique advantages, especially when it comes to large-scale water index analysis. Here’s how Farmonaut’s satellite system compares to other monitoring methods:
| Feature | Farmonaut Satellite System | Drone-based Monitoring | IoT Sensors |
|---|---|---|---|
| Coverage Area | Global | Limited by flight range | Limited to sensor placement |
| Frequency of Data Collection | Regular (every 5 days with Sentinel-2) | On-demand, weather dependent | Continuous |
| Initial Setup Cost | Low | High (equipment and training) | Medium to High |
| Scalability | Highly scalable | Limited by operational capacity | Requires additional sensors for scaling |
| Data Processing | Automated | Often requires manual processing | Automated |
| Regulatory Compliance | No restrictions | Subject to local aviation laws | May require permits for sensor placement |
6. Step-by-Step Guide to Performing NDWI Analysis with Sentinel-2 Data
For those interested in conducting their own NDWI Sentinel-2 analysis, here’s a step-by-step guide:
- Data Acquisition: Download Sentinel-2 imagery from the Copernicus Open Access Hub or use Farmonaut’s API for streamlined access.
- Preprocessing: Perform atmospheric correction and cloud masking on the raw imagery.
- Band Selection: Extract the Green (Band 3) and NIR (Band 8) bands from the preprocessed image.
- NDWI Calculation: Apply the NDWI formula using raster calculator tools in GIS software or through programming languages like Python.
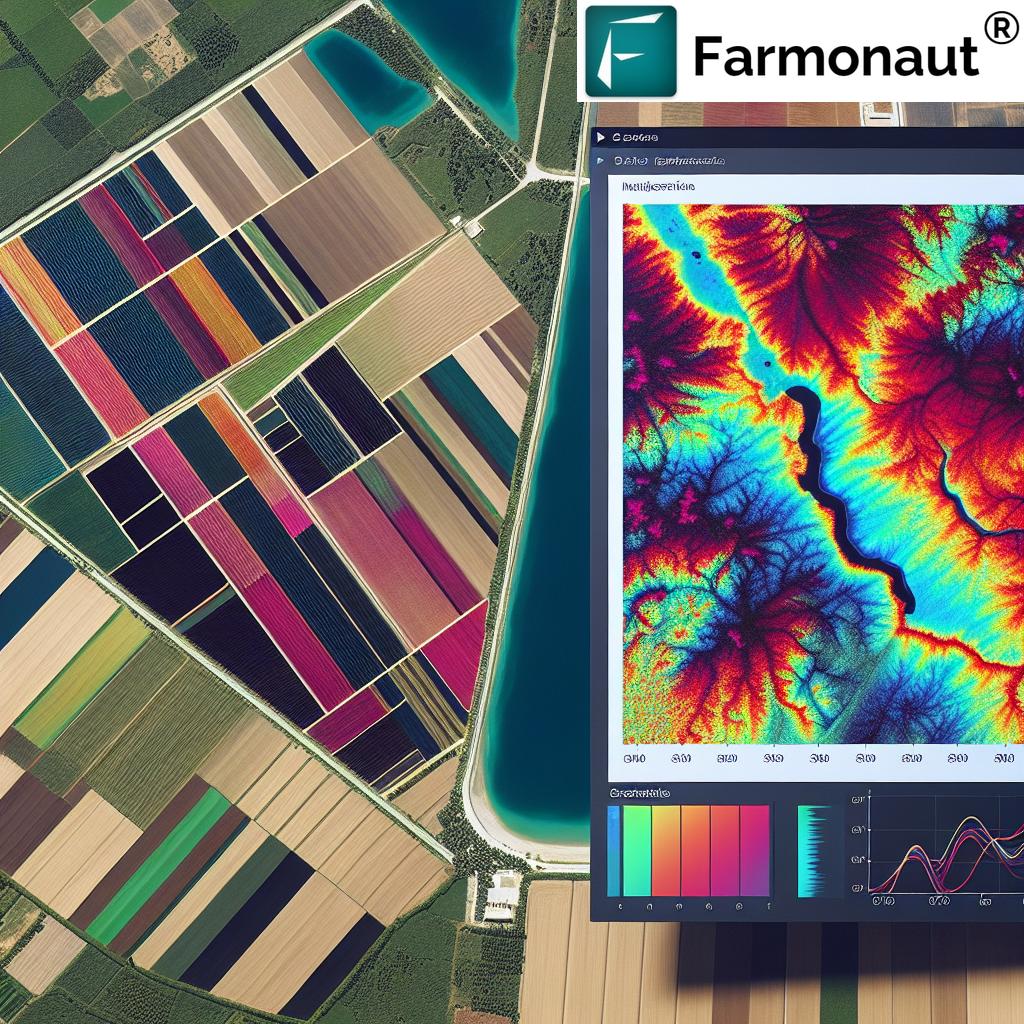
- Visualization: Create color-coded maps to represent NDWI values, typically using a blue-to-red color scheme.
- Analysis: Interpret the results, identifying water bodies and assessing vegetation water content.
- Time-series Comparison: Compare NDWI maps from different dates to track changes in water resources over time.
For a more streamlined process, consider using Farmonaut’s platform, which automates these steps and provides ready-to-use NDWI maps and analysis tools.
7. Interpreting NDWI Results
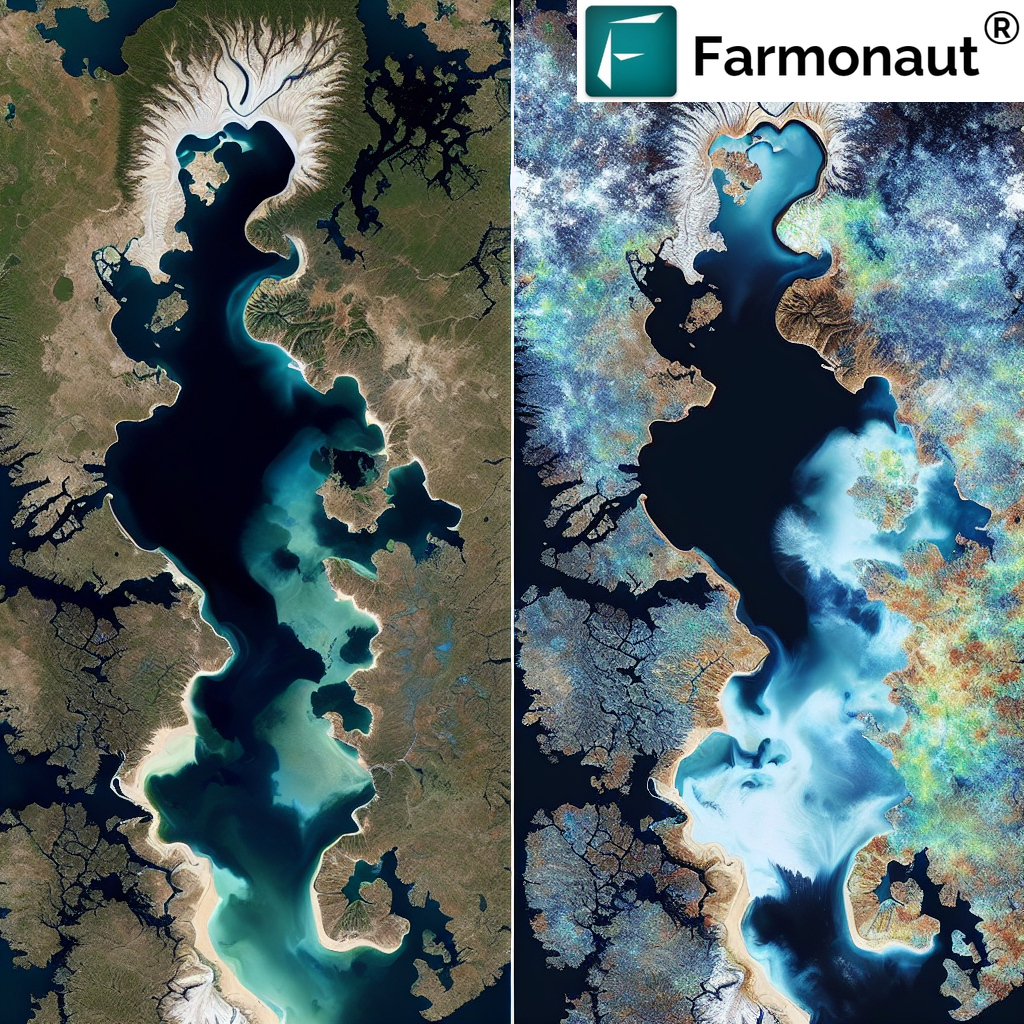
Interpreting NDWI Sentinel-2 results requires an understanding of the index values and their implications:
- Values > 0.3: Likely to indicate open water bodies
- Values between 0 and 0.3: May represent vegetation with high water content or partially submerged areas
- Values < 0: Typically indicate dry soil or vegetation with low water content
It’s important to note that these thresholds can vary depending on the specific environment and should be calibrated for local conditions.
8. Case Studies and Success Stories
At Farmonaut, we’ve seen numerous success stories where NDWI Sentinel-2 analysis has made a significant impact. While we don’t share specific case studies to protect our clients’ privacy, we can highlight some general scenarios where NDWI has proven invaluable:
- Drought monitoring in agricultural regions, allowing for timely interventions
- Optimizing irrigation schedules based on crop water stress detection
- Assessing the impact of climate change on water resources over large areas
- Supporting urban planning decisions by identifying flood-prone areas
9. Future Trends in Water Index Analysis
As we look to the future, several exciting trends are emerging in the field of water index analysis:
- Integration with AI and Machine Learning: Enhancing NDWI analysis with predictive models for more accurate water resource forecasting
- Fusion with Other Data Sources: Combining Sentinel-2 NDWI with data from other satellites, drones, and ground sensors for more comprehensive insights
- Real-time Monitoring: Developing systems for near-real-time NDWI updates to support rapid decision-making in agriculture and disaster management
- Custom Indices: Creating specialized water indices tailored to specific environments or applications
At Farmonaut, we’re actively working on these advancements to provide our users with the most cutting-edge water analysis tools available.
10. FAQ Section
Q: What is the difference between NDWI and NDVI?
A: While both are vegetation indices, NDWI focuses on water content in vegetation and water bodies, while NDVI (Normalized Difference Vegetation Index) primarily measures vegetation health and density.
Q: How often is Sentinel-2 data updated?
A: Sentinel-2 provides a global revisit time of 5 days at the equator, with even more frequent coverage at higher latitudes.
Q: Can NDWI be used for small-scale farming?
A: Yes, NDWI can be valuable for small-scale farming, especially when combined with other indices and local knowledge. Farmonaut’s platform makes it accessible for farms of all sizes.
Q: How accurate is NDWI for detecting water stress in crops?
A: NDWI is generally quite accurate for detecting water stress, but its effectiveness can vary depending on crop type and growth stage. It’s often best used in conjunction with other indices and ground truthing.
Q: Is special software required to perform NDWI analysis?
A: While GIS software can be used for manual NDWI calculation, Farmonaut’s platform automates this process, making it accessible without specialized software knowledge.
Conclusion
The NDWI Sentinel-2 index is a powerful tool for water resource management and agricultural monitoring. By leveraging this technology through platforms like Farmonaut, farmers, researchers, and policymakers can make more informed decisions about water usage, crop management, and environmental conservation.
We invite you to explore the possibilities of NDWI analysis with Farmonaut. Whether you’re a farmer looking to optimize irrigation, a researcher studying climate change impacts, or a government agency managing water resources, our platform can provide the insights you need.
Ready to get started with NDWI analysis? Sign up for Farmonaut today:
For developers interested in integrating NDWI analysis into their own applications, check out our Satellite API and API documentation.
Together, we can revolutionize water management and sustainable agriculture through the power of satellite technology and advanced indices like NDWI. Join us in this journey towards a more water-efficient and productive future!


