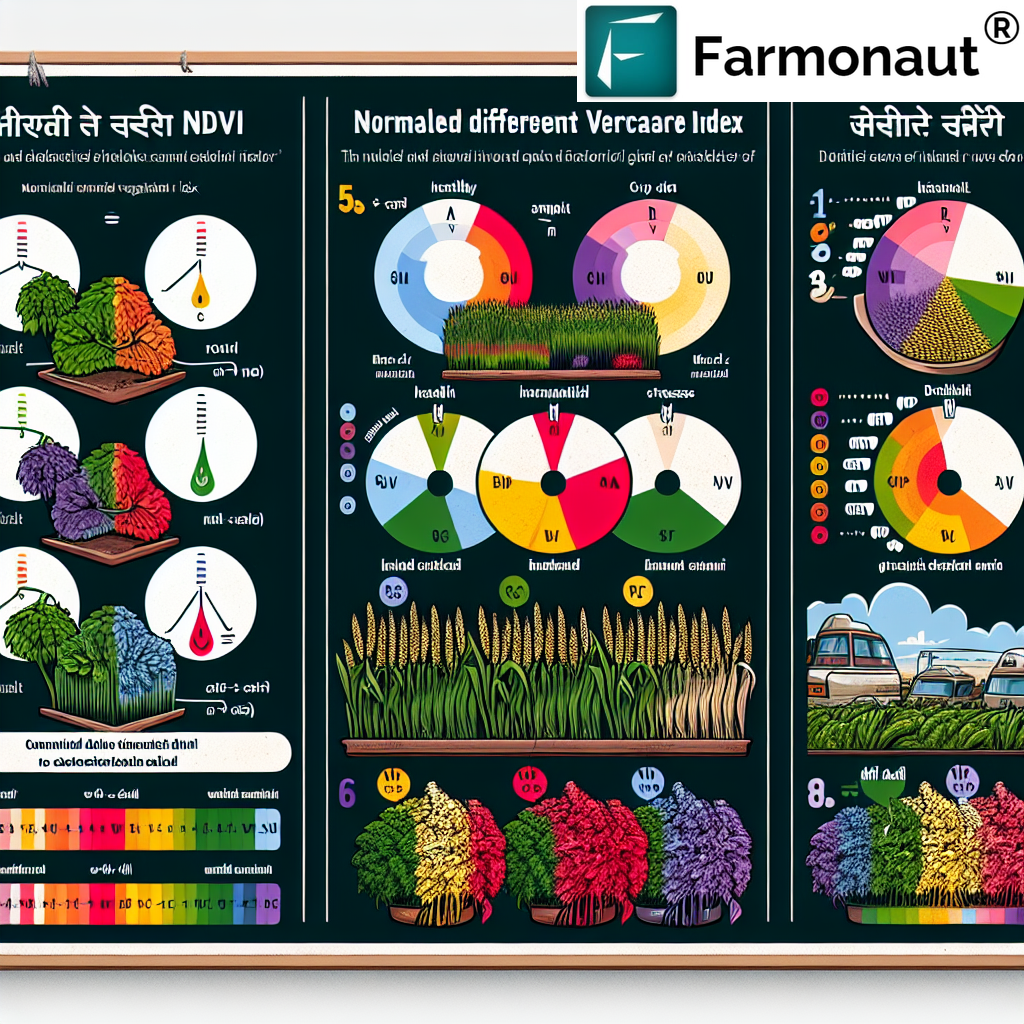
NDVI vs NDMI: Understanding Key Vegetation Indices for Precision Agriculture
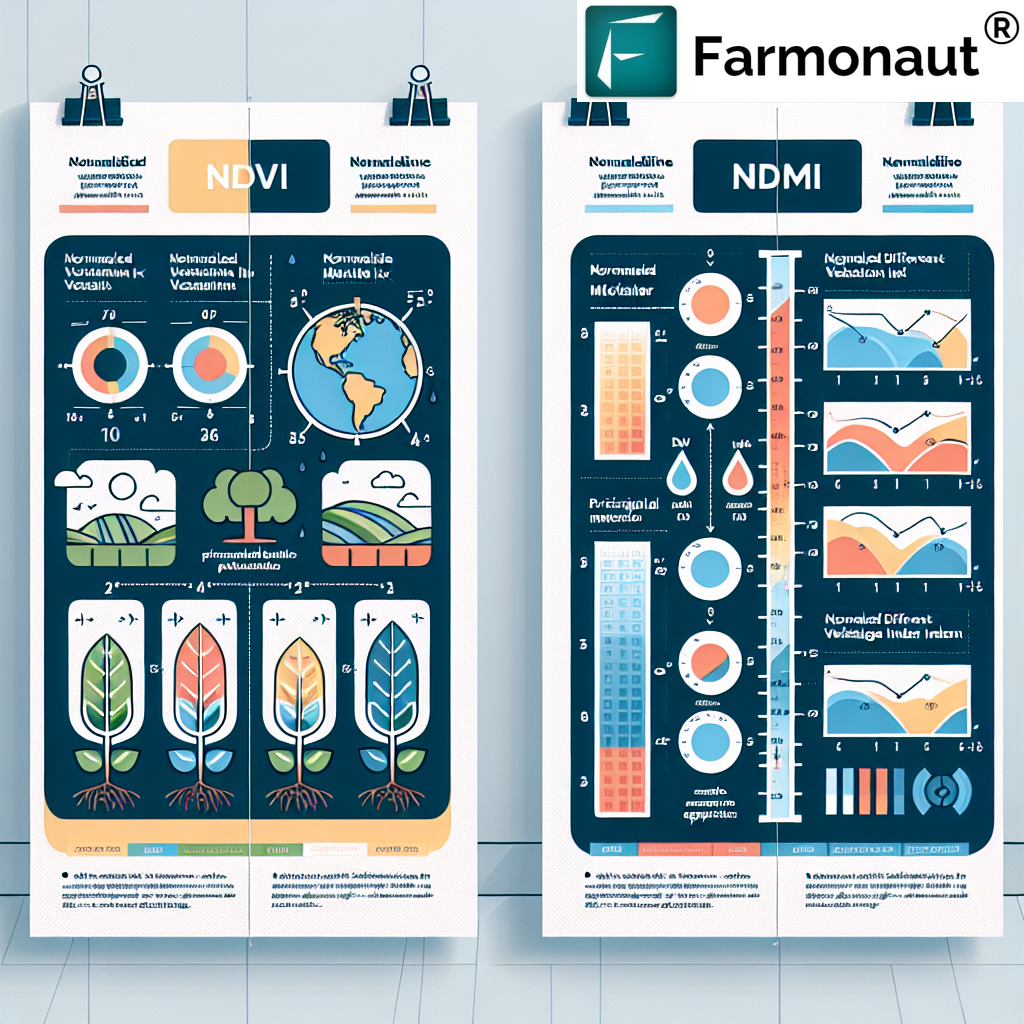
In the rapidly evolving world of precision agriculture, understanding and utilizing vegetation indices has become crucial for farmers and agronomists alike. At Farmonaut, we specialize in leveraging advanced satellite technology to provide farmers with valuable insights into their crops’ health and overall field conditions. Two of the most important indices we work with are NDVI (Normalized Difference Vegetation Index) and NDMI (Normalized Difference Moisture Index). In this comprehensive blog post, we’ll dive deep into these indices, exploring their similarities, differences, and applications in modern farming practices.
Table of Contents
- Introduction to Vegetation Indices
- Understanding NDVI
- Understanding NDMI
- NDVI vs NDMI: Key Differences and Applications
- How Farmonaut Utilizes NDVI and NDMI
- The Importance of NDVI and NDMI in Precision Agriculture
- Practical Applications of NDVI and NDMI
- Challenges and Limitations
- Future Trends in Vegetation Indices
- Farmonaut’s Approach to Vegetation Monitoring
- FAQ Section
1. Introduction to Vegetation Indices
Vegetation indices are quantitative measurements used to assess various aspects of vegetation cover, including biomass, plant health, and water content. These indices are typically derived from remote sensing data, such as satellite imagery or aerial photographs. By analyzing the reflectance of different wavelengths of light, we can gain valuable insights into the state of crops and natural vegetation.
Among the many vegetation indices available, NDVI and NDMI stand out as particularly useful tools for agricultural monitoring and management. Let’s explore each of these indices in detail.
2. Understanding NDVI
NDVI (Normalized Difference Vegetation Index) is one of the most widely used vegetation indices in remote sensing and precision agriculture. It provides a measure of the greenness and vigor of vegetation by comparing the reflectance of red and near-infrared light.
How NDVI Works
NDVI is calculated using the following formula:
NDVI = (NIR – Red) / (NIR + Red)
Where:
- NIR = reflectance in the near-infrared spectrum
- Red = reflectance in the red spectrum
Healthy vegetation absorbs most of the visible light that hits it and reflects a large portion of near-infrared light. In contrast, unhealthy or sparse vegetation reflects more visible light and less near-infrared light. This difference in reflectance patterns allows us to distinguish between healthy and stressed vegetation.
NDVI Values and Interpretation
NDVI values range from -1 to +1, with higher values indicating denser and healthier vegetation:
- -1 to 0: Non-vegetated areas (water, bare soil, buildings)
- 0 to 0.2: Sparse vegetation or stressed crops
- 0.2 to 0.4: Moderate vegetation
- 0.4 to 0.6: Dense vegetation
- 0.6 to 1: Very dense, healthy vegetation
Applications of NDVI in Agriculture
At Farmonaut, we use NDVI for various applications in precision agriculture:
- Crop health monitoring
- Yield prediction
- Drought assessment
- Pest and disease detection
- Fertilizer management
- Irrigation scheduling
3. Understanding NDMI
NDMI (Normalized Difference Moisture Index) is another important vegetation index that focuses specifically on the water content of vegetation. It provides valuable information about plant water stress and overall moisture conditions in an area.
How NDMI Works
NDMI is calculated using the following formula:
NDMI = (NIR – SWIR) / (NIR + SWIR)
Where:
- NIR = reflectance in the near-infrared spectrum
- SWIR = reflectance in the short-wave infrared spectrum
The SWIR band is sensitive to moisture content in soil and vegetation. As water content in leaves increases, the reflectance in the SWIR region decreases, while NIR reflectance remains relatively constant.
NDMI Values and Interpretation
NDMI values typically range from -1 to +1:
- -1 to 0: Low moisture content or non-vegetated areas
- 0 to 0.2: Low to moderate moisture content
- 0.2 to 0.4: Moderate moisture content
- 0.4 to 0.6: High moisture content
- 0.6 to 1: Very high moisture content
Applications of NDMI in Agriculture
At Farmonaut, we leverage NDMI for several crucial applications:
- Drought monitoring and assessment
- Irrigation management
- Soil moisture estimation
- Flood mapping
- Forest fire risk assessment
- Crop water stress detection
4. NDVI vs NDMI: Key Differences and Applications
While both NDVI and NDMI are valuable tools in precision agriculture, they serve different purposes and provide complementary information. Let’s compare these two indices:
| Aspect | NDVI | NDMI |
|---|---|---|
| Primary Focus | Vegetation greenness and vigor | Vegetation moisture content |
| Spectral Bands Used | Red and Near-Infrared (NIR) | Near-Infrared (NIR) and Short-Wave Infrared (SWIR) |
| Sensitivity | Chlorophyll content, leaf area index | Water content in vegetation and soil |
| Main Applications | Crop health monitoring, biomass estimation, yield prediction | Drought assessment, irrigation management, water stress detection |
| Seasonal Variability | Higher seasonal variability | Lower seasonal variability |
| Saturation Issues | Can saturate in dense canopies | Less prone to saturation |
At Farmonaut, we recognize that combining NDVI and NDMI analyses provides a more comprehensive picture of crop health and field conditions. For example:
- A field with high NDVI but low NDMI might indicate healthy vegetation that is beginning to experience water stress.
- Low NDVI and low NDMI could suggest severely stressed or dying vegetation due to drought conditions.
- High NDVI and high NDMI typically indicate optimal growing conditions with adequate moisture.
5. How Farmonaut Utilizes NDVI and NDMI
At Farmonaut, we’ve integrated advanced NDVI and NDMI analysis into our satellite-based crop monitoring system. Here’s how we leverage these indices to provide valuable insights to farmers:
Satellite Imagery Processing
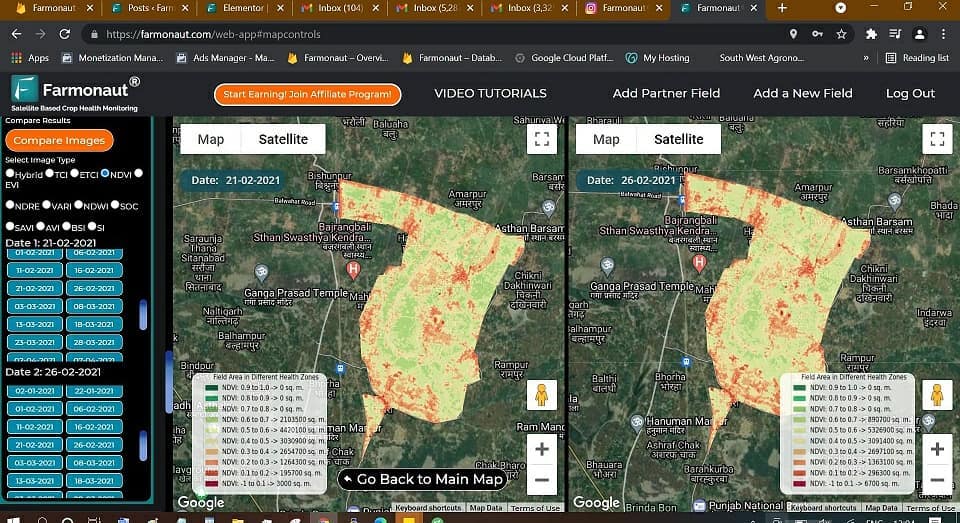
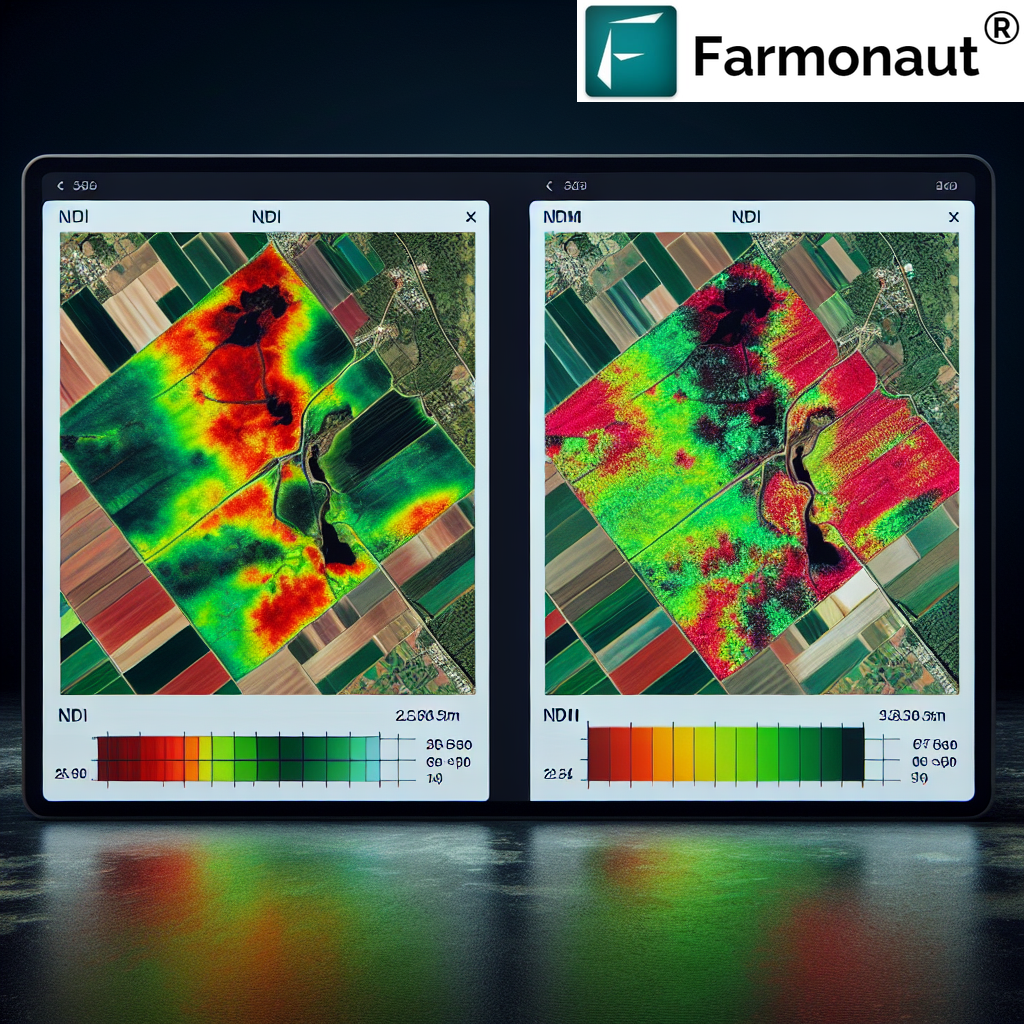
We process high-resolution satellite imagery to calculate NDVI and NDMI values for entire fields. This allows us to create detailed maps that show the spatial distribution of vegetation health and moisture content across a farm.
Time Series Analysis
By analyzing NDVI and NDMI data over time, we can track changes in crop health and moisture levels throughout the growing season. This temporal analysis helps identify trends and anomalies that might not be apparent from a single snapshot.
Integration with Other Data Sources
We combine NDVI and NDMI data with other information sources, such as weather data, soil maps, and historical yield data, to provide more comprehensive and actionable insights to farmers.
AI-Powered Recommendations
Our Jeevn AI advisory system uses NDVI and NDMI data, along with other inputs, to generate personalized recommendations for farmers. These recommendations can include optimized irrigation schedules, targeted fertilizer applications, and early warnings for potential crop stress.
Mobile App Visualization
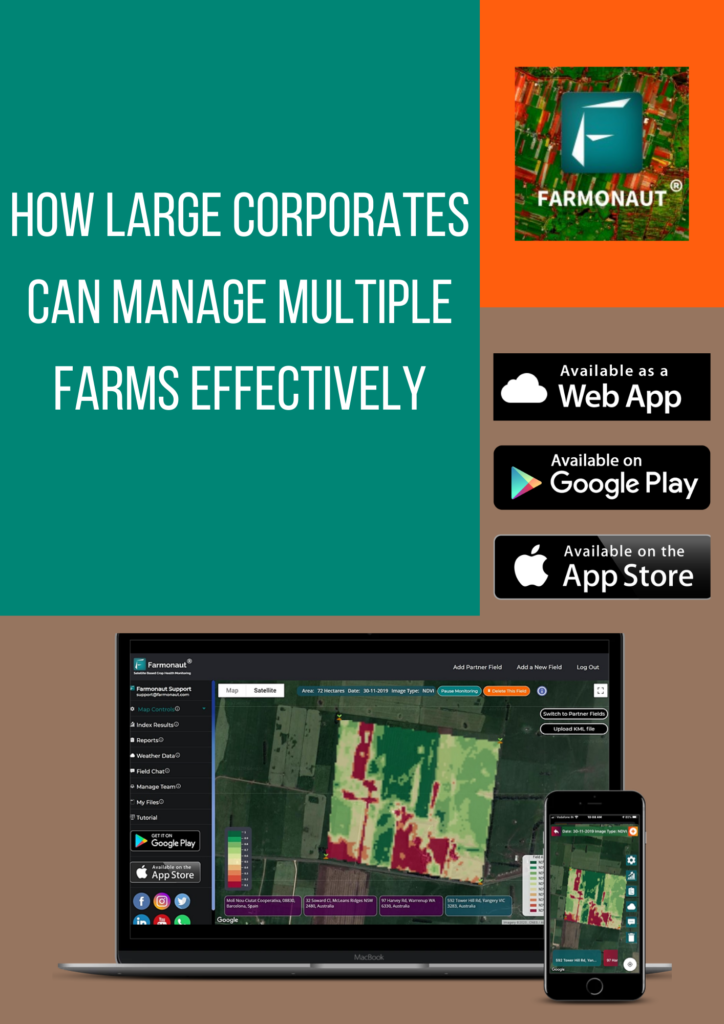
Farmers can easily access NDVI and NDMI maps and analyses through our mobile app, available on both Android and iOS platforms. This allows for quick and easy field monitoring on the go.
6. The Importance of NDVI and NDMI in Precision Agriculture
The combination of NDVI and NDMI analyses has revolutionized precision agriculture in several ways:
Early Stress Detection
By monitoring both vegetation health (NDVI) and moisture content (NDMI), farmers can detect crop stress earlier than with visual inspection alone. This early warning system allows for timely interventions to prevent yield losses.
Optimized Resource Management
NDVI and NDMI maps enable farmers to apply water, fertilizers, and other inputs more precisely, targeting areas of the field that need them most. This leads to improved resource efficiency and reduced environmental impact.
Yield Forecasting
Historical NDVI data, combined with current season trends, can be used to predict crop yields more accurately. This information is valuable for both farmers and agricultural policymakers.
Sustainable Farming Practices
By providing detailed insights into crop health and water stress, NDVI and NDMI analyses support more sustainable farming practices, helping to conserve water and reduce chemical inputs.
7. Practical Applications of NDVI and NDMI
Let’s explore some specific ways in which farmers and agronomists can use NDVI and NDMI data in their day-to-day operations:
Variable Rate Irrigation
By analyzing NDMI maps, farmers can adjust irrigation rates across their fields, applying more water to areas with low moisture content and less to areas with adequate moisture. This precision approach conserves water and prevents over-irrigation.
Targeted Fertilizer Application
NDVI maps can reveal areas of the field with lower vegetation vigor, which may benefit from additional fertilizer. This allows for variable-rate fertilizer application, optimizing nutrient use efficiency.
Pest and Disease Monitoring
Sudden changes in NDVI patterns can indicate the presence of pests or diseases. By monitoring these changes, farmers can quickly identify and address problem areas before they spread.
Crop Rotation Planning
Analysis of long-term NDVI and NDMI trends can help farmers make informed decisions about crop rotation strategies, identifying areas of the field that may benefit from different crop types or management practices.
8. Challenges and Limitations
While NDVI and NDMI are powerful tools, it’s important to be aware of their limitations:
Atmospheric Interference
Cloud cover, haze, and atmospheric pollution can affect the accuracy of satellite-derived NDVI and NDMI measurements. At Farmonaut, we use advanced algorithms to correct for these effects and provide the most reliable data possible.
Saturation in Dense Canopies
NDVI can saturate in areas with very dense vegetation, making it less sensitive to changes in highly productive regions. NDMI is less prone to this issue, which is why we use both indices in our analyses.
Temporal Resolution
The frequency of satellite imagery updates can limit the ability to detect rapid changes in crop conditions. We address this by combining data from multiple satellite sources to increase temporal resolution.
Crop-Specific Calibration
Different crop types may require specific calibration of NDVI and NDMI thresholds for optimal interpretation. Our AI-powered system continually learns and adjusts these thresholds based on crop type and local conditions.
9. Future Trends in Vegetation Indices
As technology continues to advance, we at Farmonaut are excited about the future of vegetation monitoring. Some emerging trends include:
Hyperspectral Imaging
Next-generation satellites equipped with hyperspectral sensors will provide even more detailed information about crop health and stress, allowing for the development of more sophisticated vegetation indices.
Integration with IoT Sensors
Combining satellite-derived NDVI and NDMI data with ground-based IoT sensors will provide a more comprehensive and real-time view of crop conditions.
Machine Learning and AI
Advanced machine learning algorithms will improve the interpretation of NDVI and NDMI data, leading to more accurate predictions and recommendations for farmers.
Fusion with Other Data Sources
Integrating vegetation indices with other data sources, such as soil moisture sensors, weather forecasts, and crop models, will provide even more valuable insights for precision agriculture.
10. Farmonaut’s Approach to Vegetation Monitoring
At Farmonaut, we’re committed to providing farmers with the most advanced and user-friendly vegetation monitoring tools available. Here’s how we stand out:
Comprehensive Satellite Coverage
We utilize a network of high-resolution satellites to provide frequent, detailed imagery of agricultural areas worldwide. This ensures that farmers have access to up-to-date NDVI and NDMI data for their fields.
Advanced AI Analytics
Our Jeevn AI system goes beyond simple NDVI and NDMI calculations, using machine learning algorithms to interpret these indices in the context of specific crops, regions, and growing conditions. This results in more accurate and actionable insights for farmers.
User-Friendly Interface
We’ve designed our mobile and web applications to make it easy for farmers to access and interpret NDVI and NDMI data. Intuitive visualizations and clear recommendations help farmers make informed decisions quickly.
Integration with Farm Management
Our vegetation monitoring tools are fully integrated with our broader farm management platform, allowing farmers to seamlessly incorporate NDVI and NDMI insights into their daily operations, from irrigation scheduling to harvest planning.
Continuous Innovation
We’re constantly researching and developing new ways to improve our vegetation monitoring capabilities. This includes exploring new indices, refining our algorithms, and integrating emerging technologies to provide even more value to our users.
How Farmonaut’s Satellite System Compares to Drone and IoT-based Farm Monitoring
| Feature | Farmonaut Satellite System | Drone-based Monitoring | IoT-based Monitoring |
|---|---|---|---|
| Coverage Area | Large scale (regional to global) | Limited (local) | Limited (field-specific) |
| Frequency of Data Collection | Regular (every few days) | On-demand (requires manual flights) | Continuous (real-time) |
| Initial Setup Cost | Low (subscription-based) | High (equipment purchase) | Moderate to High (sensor network installation) |
| Operational Complexity | Low (automated data processing) | High (requires skilled operators) | Moderate (maintenance of sensor network) |
| Weather Dependency | Moderate (affected by cloud cover) | High (cannot operate in poor weather) | Low (operates in most conditions) |
| Data Analysis Capabilities | Advanced (AI-powered insights) | Moderate (requires separate analysis tools) | Varies (depends on integrated software) |
| Scalability | High (easily scalable to large areas) | Low (limited by flight time and regulations) | Moderate (requires additional sensors for expansion) |
| Legal/Regulatory Considerations | Low (uses existing satellite infrastructure) | High (subject to drone flight regulations) | Moderate (may require permissions for sensor placement) |
11. FAQ Section
Q1: What is the difference between NDVI and NDMI?
A1: NDVI (Normalized Difference Vegetation Index) measures vegetation greenness and vigor, while NDMI (Normalized Difference Moisture Index) focuses on vegetation moisture content. NDVI uses red and near-infrared bands, while NDMI uses near-infrared and short-wave infrared bands.
Q2: How often does Farmonaut update its NDVI and NDMI data?
A2: We typically provide updates every 3-5 days, depending on satellite availability and cloud cover. For more frequent updates, check our mobile app or contact our support team.
Q3: Can NDVI and NDMI be used for all crop types?
A3: Yes, NDVI and NDMI can be used for most crop types. However, interpretation may vary depending on the specific crop and growth stage. Our AI system is trained to account for these differences.
Q4: How accurate are NDVI and NDMI measurements from satellites?
A4: Satellite-based NDVI and NDMI measurements are generally very accurate, especially when using high-resolution imagery. However, factors like atmospheric conditions can affect accuracy. We use advanced algorithms to correct for these factors and provide reliable data.
Q5: Can Farmonaut’s system detect specific diseases or pests using NDVI and NDMI?
A5: While NDVI and NDMI can indicate general crop stress, they cannot directly identify specific diseases or pests. However, our AI system can detect patterns that may suggest the presence of certain issues, prompting further investigation.
Q6: How does weather affect NDVI and NDMI readings?
A6: Cloud cover can obstruct satellite imagery, affecting data availability. Additionally, recent rainfall or irrigation can temporarily influence NDMI readings. We account for these factors in our analysis and provide guidance on interpretation.
Q7: Can I integrate Farmonaut’s NDVI and NDMI data with my existing farm management software?
A7: Yes, we offer API access that allows integration with various farm management systems. For more information, please visit our API documentation.
Q8: How does Farmonaut ensure the privacy and security of farm data?
A8: We take data security very seriously. All farm data is encrypted and stored securely. We never share individual farm data without explicit permission from the user.
Q9: Can NDVI and NDMI be used for non-agricultural applications?
A9: Yes, these indices have applications in forestry, environmental monitoring, and urban planning. While our focus is on agriculture, the underlying technology can be adapted for various uses.
Q10: How can I get started with using Farmonaut’s NDVI and NDMI tools?
A10: You can start by downloading our mobile app (Android or iOS) or visiting our web platform. We offer a free trial for new users to explore our services.
By leveraging the power of NDVI and NDMI analyses, along with our advanced AI and satellite technology, Farmonaut is committed to revolutionizing precision agriculture. We provide farmers with the tools they need to make informed decisions, optimize resource use, and increase crop yields sustainably.
Ready to experience the benefits of advanced vegetation monitoring for your farm? Sign up for Farmonaut today and take your farming practices to the next level!
For more information on our API services, please visit our API documentation. If you have any questions or need assistance, don’t hesitate to contact our support team. We’re here to help you make the most of precision agriculture technology!


