Understanding NDVI Ranges: A Comprehensive Guide to Vegetation Health Monitoring
In the world of precision agriculture and remote sensing, the Normalized Difference Vegetation Index (NDVI) stands as a cornerstone for assessing vegetation health and productivity. At Farmonaut, we leverage this powerful tool to provide farmers and agricultural professionals with invaluable insights into crop conditions. In this comprehensive guide, we’ll delve deep into the concept of NDVI, explore its various ranges, and discuss how this index is revolutionizing modern farming practices.
What is NDVI?
NDVI is a standardized index that allows us to generate an image displaying vegetation greenness, also known as relative biomass. This index capitalizes on the contrast between the strong absorption of visible light by plant chlorophyll and the strong reflection of near-infrared radiation by plant tissues.
The formula for NDVI is:
NDVI = (NIR – RED) / (NIR + RED)
Where:
- NIR = Near-Infrared Reflection
- RED = Red Light Reflection
Understanding the NDVI Range
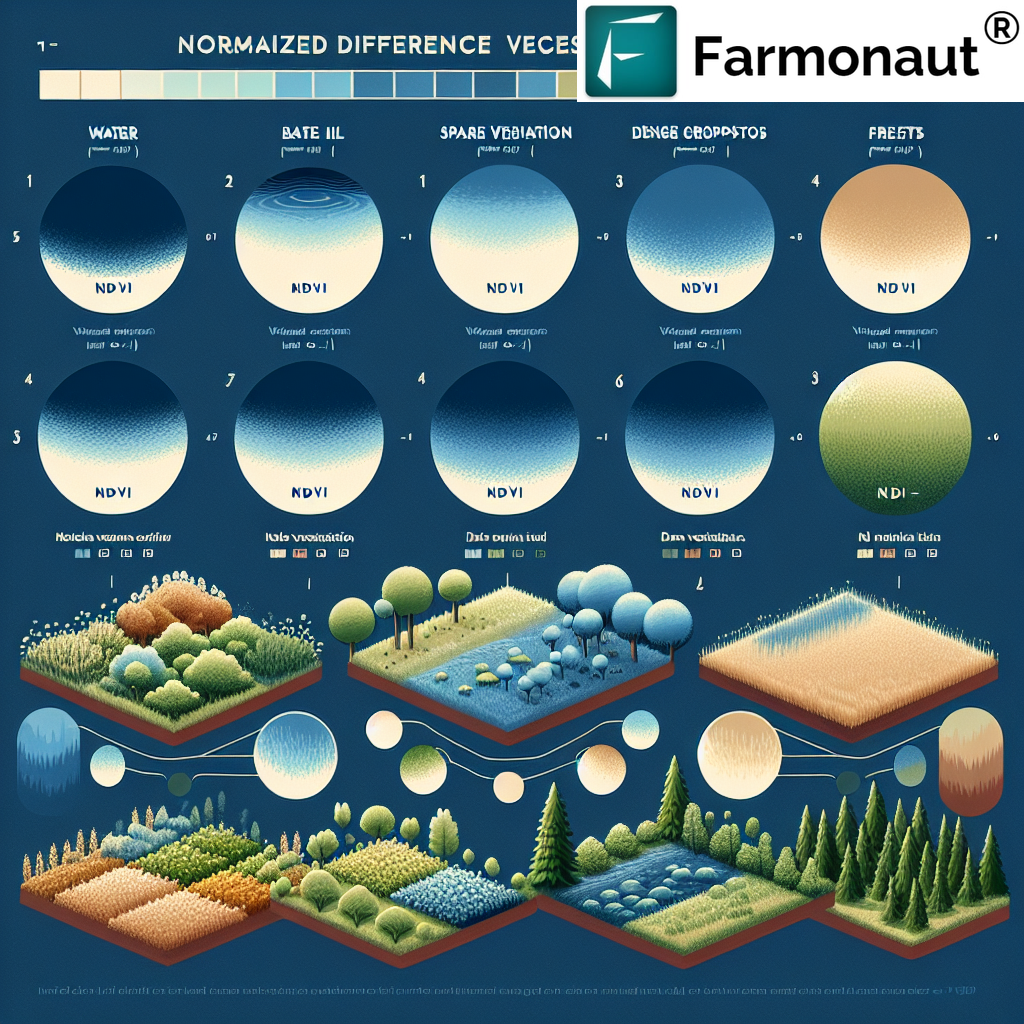
The NDVI value range typically spans from -1 to +1. This range of NDVI values provides crucial information about vegetation health and density. Let’s break down this range to understand what different values signify:
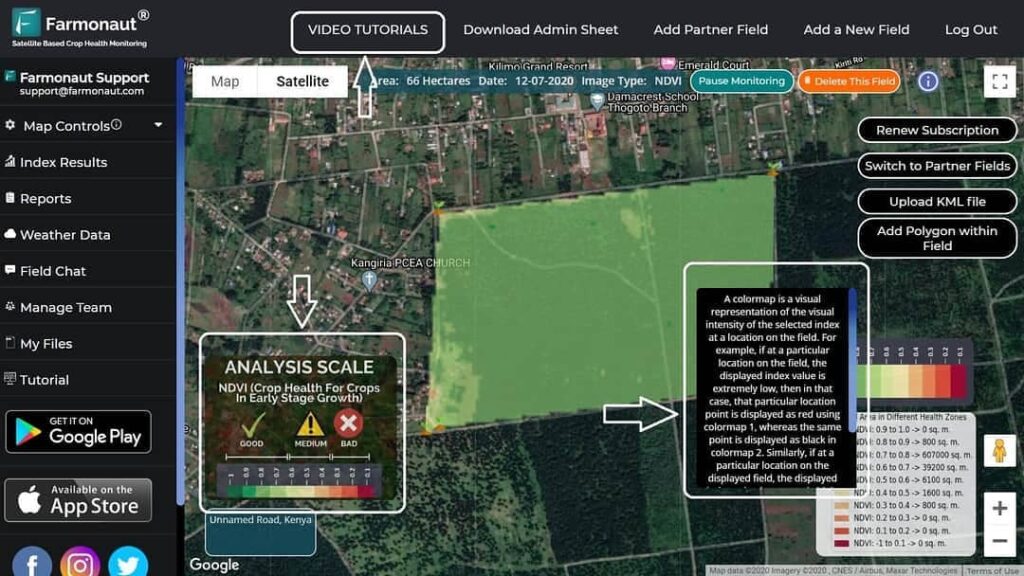
NDVI Classes Range
- -1 to 0: This range typically represents non-vegetated areas such as water bodies, bare soil, or artificial surfaces like buildings and roads.
- 0 to 0.1: This range often indicates barren areas of rock, sand, or snow.
- 0.1 to 0.3: This range usually represents sparse vegetation such as shrubs and grasslands.
- 0.3 to 0.6: This range indicates moderate vegetation, typical of temperate and tropical forests.
- 0.6 to 1: This range represents dense vegetation found in temperate and tropical rainforests.
NDVI Range for Agricultural Land
When it comes to agricultural applications, the NDVI range for agricultural land is particularly important. Generally, healthy crops will fall within the following ranges:
- 0.1 to 0.2: Bare soil or very early crop stages
- 0.2 to 0.4: Early to mid-season crops or stressed vegetation
- 0.4 to 0.6: Healthy, mid-season crops
- 0.6 to 0.8: Very healthy, peak vegetation
- 0.8 to 1.0: Exceptionally dense and healthy vegetation (rare in agricultural settings)
It’s important to note that these ranges can vary depending on the crop type, growth stage, and local environmental conditions.
The Importance of NDVI in Agriculture
NDVI has become an indispensable tool in modern agriculture for several reasons:
- Crop Health Monitoring: NDVI allows farmers to assess crop health remotely, identifying areas of stress or disease before they become visible to the naked eye.
- Yield Prediction: By analyzing NDVI values over time, we can make accurate predictions about crop yields.
- Resource Optimization: NDVI maps help in optimizing the use of water, fertilizers, and pesticides by identifying areas that need more or less attention.
- Drought Monitoring: Changes in NDVI values can indicate the onset of drought conditions, allowing for timely interventions.
- Biodiversity Assessment: NDVI is useful in assessing biodiversity and ecosystem health on a larger scale.
NDVI Range for Vegetation: A Closer Look
The NDVI range for vegetation provides valuable insights into plant health and density. Let’s examine this range in more detail:
- 0.1 to 0.3: This range typically represents grasslands or senescing crops. In agricultural settings, it might indicate the early stages of crop growth or areas suffering from severe stress.
- 0.3 to 0.5: This range often indicates moderate vegetation health. In agriculture, it might represent crops in the middle stages of growth or those experiencing mild stress conditions.
- 0.5 to 0.7: This range suggests healthy vegetation. For crops, this often indicates peak growth stages with good health conditions.
- 0.7 to 0.9: This range represents very healthy and dense vegetation. In agricultural settings, it might indicate exceptionally healthy crops or dense canopy cover.
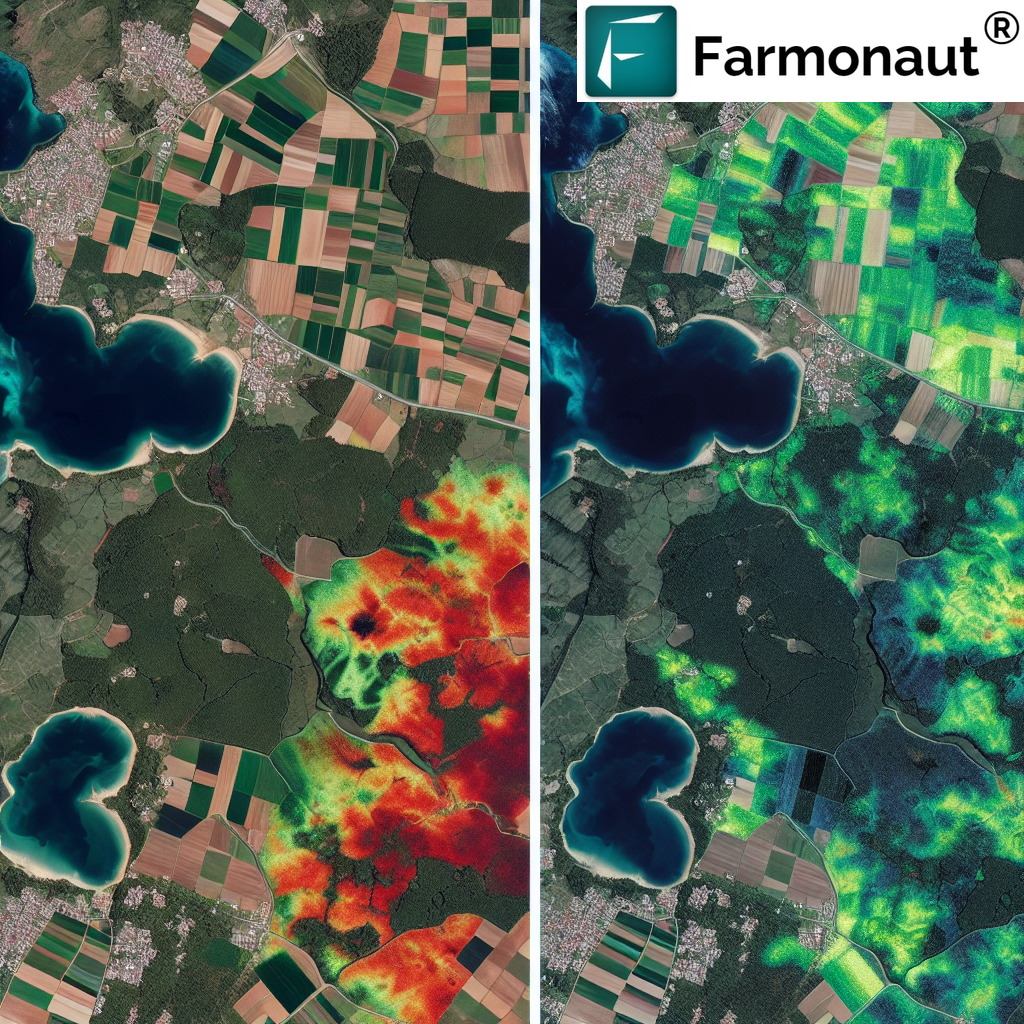
At Farmonaut, we use these NDVI ranges to provide farmers with detailed insights into their crop health, allowing for targeted interventions and optimized resource management.
Factors Affecting NDVI Values
While NDVI is a powerful tool, it’s important to understand the factors that can influence its values:
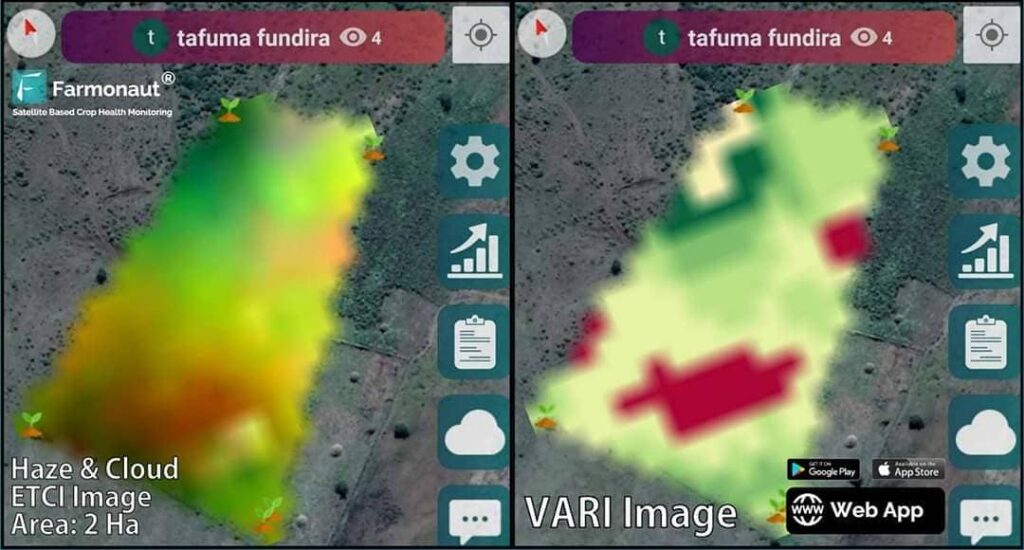
- Atmospheric Conditions: Cloud cover, haze, and atmospheric particles can affect NDVI readings.
- Soil Background: In areas with sparse vegetation, soil characteristics can influence NDVI values.
- Sensor Calibration: Different satellite sensors may produce slightly different NDVI values for the same area.
- Seasonal Changes: NDVI values naturally fluctuate with seasonal vegetation changes.
- Plant Species: Different plant species can have varying NDVI signatures.
NDVI Index Range: Applications Beyond Agriculture
While we at Farmonaut focus primarily on agricultural applications, it’s worth noting that the NDVI index range has applications in various other fields:
- Forestry: Monitoring forest health, detecting deforestation, and assessing fire damage.
- Urban Planning: Assessing green spaces and urban heat islands.
- Ecological Studies: Tracking changes in ecosystems over time.
- Climate Change Research: Studying the impact of climate change on vegetation patterns.
- Disaster Management: Assessing vegetation recovery after natural disasters.
How Farmonaut Leverages NDVI for Precision Agriculture
At Farmonaut, we’ve developed advanced algorithms that interpret NDVI data to provide actionable insights for farmers. Here’s how we use NDVI to revolutionize farming practices:
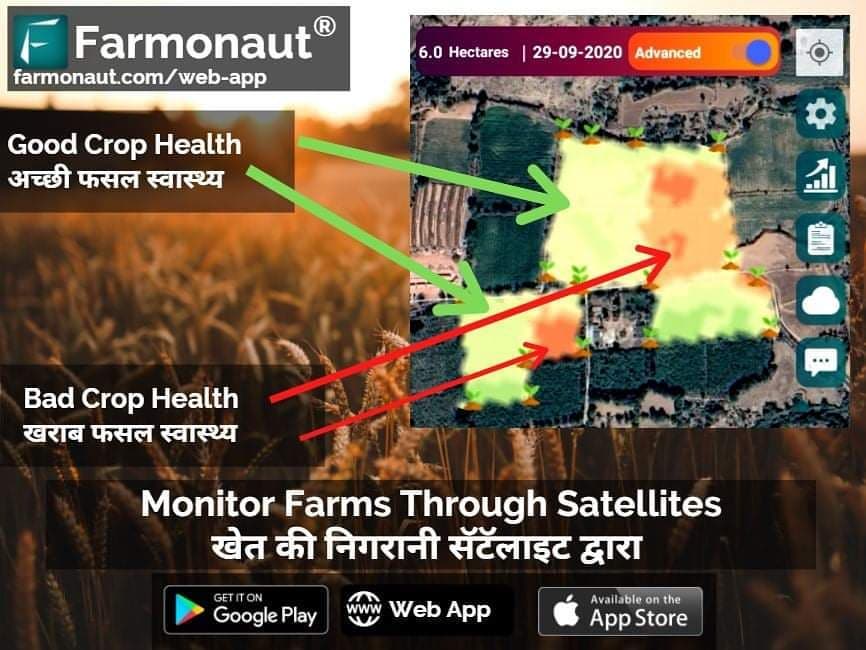
- Real-time Crop Monitoring: Our satellite-based system provides up-to-date NDVI maps, allowing farmers to track crop health in real-time.
- Early Stress Detection: By analyzing NDVI patterns, we can detect crop stress early, often before it’s visible to the naked eye.
- Precision Farming Recommendations: Based on NDVI data, we provide targeted recommendations for irrigation, fertilization, and pest control.
- Yield Forecasting: Our AI models use NDVI trends to predict crop yields, helping farmers and agribusinesses plan ahead.
- Historical Analysis: We store historical NDVI data, allowing farmers to compare crop performance across seasons and years.
Farmonaut Satellite System vs. Drone and IoT-based Farm Monitoring
While drones and IoT devices have their place in modern agriculture, Farmonaut’s satellite-based system offers several advantages:
| Feature | Farmonaut Satellite System | Drone-based Monitoring | IoT-based Monitoring |
|---|---|---|---|
| Coverage Area | Large scale (thousands of hectares) | Limited (tens of hectares per flight) | Limited to sensor placement |
| Frequency of Data Collection | Regular (every few days) | On-demand (requires manual flights) | Continuous but localized |
| Initial Setup Cost | Low | High (drone purchase, training) | Medium to High (sensor network setup) |
| Operational Complexity | Low (automated data collection) | High (requires skilled operators) | Medium (requires maintenance) |
| Weather Dependency | Low (can penetrate clouds) | High (affected by wind, rain) | Low |
| Data Processing | Automated (AI-driven) | Often manual or semi-automated | Automated but limited in scope |
| Scalability | Highly scalable | Limited by operational capacity | Requires additional hardware for scaling |
The Future of NDVI in Agriculture
As technology continues to advance, we at Farmonaut are excited about the future possibilities for NDVI in agriculture:
- Higher Resolution Imagery: Upcoming satellite constellations promise even higher resolution imagery, allowing for more detailed NDVI analysis.
- AI and Machine Learning: Advanced algorithms will enable more accurate interpretation of NDVI data, providing even more precise recommendations.
- Integration with Other Data Sources: Combining NDVI with other data sources like weather patterns and soil sensors will provide a more comprehensive view of crop health.
- Automated Decision Making: In the future, NDVI data could directly inform automated farming systems, optimizing resource use in real-time.
- Climate Change Adaptation: NDVI will play a crucial role in helping farmers adapt to changing climate conditions by monitoring long-term vegetation trends.
How to Get Started with Farmonaut’s NDVI Monitoring
Ready to leverage the power of NDVI for your farm? Here’s how you can get started with Farmonaut:
- Visit our website at https://farmonaut.com/app_redirect to sign up for an account.
- Download our mobile app from the Google Play Store or the Apple App Store.
- Define your field boundaries within the app.
- Start receiving regular NDVI updates and actionable insights for your farm.
For developers interested in integrating our NDVI data into their own applications, check out our API documentation at https://farmonaut.com/farmonaut-satellite-weather-api-developer-docs/.
Conclusion
Understanding the NDVI range and its applications is crucial for modern, data-driven agriculture. At Farmonaut, we’re committed to making this powerful tool accessible and actionable for farmers worldwide. By leveraging satellite technology and advanced analytics, we’re helping farmers optimize their operations, increase yields, and practice sustainable agriculture.
Ready to take your farming to the next level with NDVI monitoring? Subscribe to Farmonaut today:
FAQs
Q: What does NDVI stand for?
A: NDVI stands for Normalized Difference Vegetation Index. It’s a standardized index used to measure vegetation health and density using satellite imagery.
Q: What is a good NDVI value for crops?
A: Generally, NDVI values between 0.4 and 0.8 indicate healthy crops. However, the optimal range can vary depending on the crop type and growth stage.
Q: How often does Farmonaut update NDVI data?
A: Farmonaut typically provides NDVI updates every 3-5 days, depending on satellite coverage and weather conditions.
Q: Can NDVI detect crop diseases?
A: While NDVI can’t directly identify specific diseases, it can detect changes in plant health that may indicate disease presence. This allows farmers to investigate and take action early.
Q: Is Farmonaut’s NDVI monitoring suitable for small farms?
A: Yes, Farmonaut’s solutions are scalable and suitable for farms of all sizes, from small holdings to large industrial operations.
Q: How does NDVI help in irrigation management?
A: NDVI can indicate areas of water stress in crops, allowing farmers to optimize their irrigation practices and conserve water.
Q: Can I integrate Farmonaut’s NDVI data into my existing farm management software?
A: Yes, Farmonaut offers API access that allows integration of our NDVI data into other software systems. Check our developer documentation for details.
Q: How accurate is NDVI in predicting crop yields?
A: While NDVI is a strong indicator of crop health and potential yield, actual yield prediction involves multiple factors. Farmonaut combines NDVI with other data points and AI models to provide accurate yield forecasts.
Q: Does cloud cover affect NDVI readings?
A: Cloud cover can interfere with satellite imagery. However, Farmonaut uses advanced algorithms to filter out cloud-affected data and provide consistent, reliable NDVI readings.
Q: How can I learn more about interpreting NDVI data for my specific crops?
A: Farmonaut provides educational resources and personalized support to help farmers interpret NDVI data for their specific crops and regions. Our AI-powered advisory system also provides crop-specific insights based on NDVI data.


