Central Valley Flood Map 2025: Essential Resilience Guide
Summary: The Central Valley Flood Map: A Critical Tool for Agriculture and Infrastructure Resilience in 2025
“Over 55% of Central Valley’s prime farmland is now within moderate to high-risk flood zones on the 2025 map.”
Table of Contents
- Introduction: Why the Central Valley Needs the 2025 Flood Map
- Understanding the Central Valley Flood Map 2025
- Key Flood Risk Zones in the Central Valley
- Agricultural Implications: Food Security, Farmers, and Land
- Infrastructure and Urban Resilience
- Environmental Considerations and Conservation
- Satellite Technology & Farmonaut: Modern Solutions for Resilience
- Flood Risk and Resilience Strategies Overview Table
- Central Valley Flood Map 2025: Building Community Preparedness
- Frequently Asked Questions
- Conclusion: Sustaining the Heart of California
Introduction: Why the Central Valley Needs the 2025 Flood Map
The Central Valley of California—spanning roughly 20,000 square miles—is not only the breadbasket of California, but also the backbone of much of the United States’ food supply. This fertile region is a vital source for nearly half the country’s fruits, vegetables, and nuts. Its agriculture supports the local economy, contributes to national security, and shapes California’s place in the global food production chain. However, flooding—particularly from the Sacramento and San Joaquin Rivers—poses an ever-growing threat to its land, agricultural systems, and critical infrastructure.
The central valley flood map updated for 2025 emerges as an indispensable tool for managing risks, planning for the future, and enhancing resilience. With climate conditions becoming increasingly volatile, the map not only protects what’s vital today, but sustains the region’s productivity beyond 2025.


Understanding the Central Valley Flood Map 2025
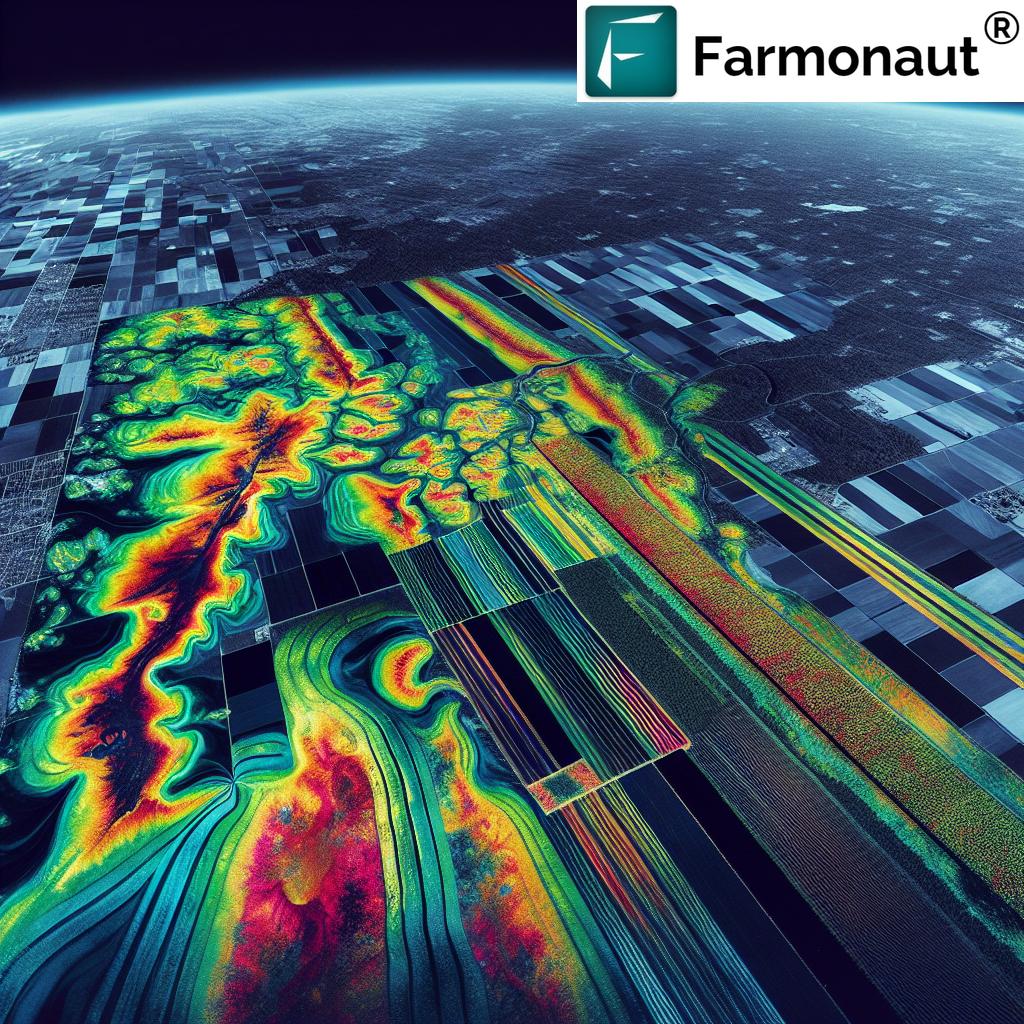
A flood map provides a detailed visualization of risk zones by integrating topography, hydrological data, historical flood patterns, and the latest climate models. The Central Valley flood map 2025 specifically highlights areas vulnerable to inundation from the Sacramento and San Joaquin Rivers, which feed into one of the most extensive irrigation networks in the United States.
What distinguishes the 2025 update is the inclusion of:
- Recent river levee inspections and infrastructure developments
- The latest climate projections, tracking changing precipitation
- Changes in land use (agricultural expansion, urbanization)
- Real-time hydrological monitoring systems and advanced GIS technologies
- Impact zones for new and aging infrastructure
This makes it the most precise and actionable tool currently available for stakeholders—including farmers, policymakers, and communities—to plan and protect vulnerable areas.
Did you know? The 2025 flood map is updated regularly in response to new hydrological data, ensuring that policymakers and landowners receive accurate, up-to-date information for managing risks.
Key Flood Risk Zones in the Central Valley
The Central Valley flood map identifies a complex tapestry of flood risk zones, each shaped by unique geography, hydrology, and land use patterns:
-
Northern Sacramento Valley—
Proximity to the Sacramento River and its tributaries exposes large swathes of both productive farmland and urban areas (like Redding and Chico) to flooding. -
San Joaquin Valley—
The larger, southern half of the Valley includes urban hubs (such as Fresno, Bakersfield, and Modesto), and some of the region’s most vital agricultural plots. Many of these areas are vulnerable to inundation due to aging levee systems and increased storm and runoff events. -
Delta Region—
The confluence of the Sacramento and San Joaquin Rivers creates a network of low-lying wetlands and farmland, historically prone to floods but essential for groundwater recharge and ecosystem health. -
Urban and Peri-Urban Expansion Corridors—
Rapid urbanization around Stockton, Merced, and other cities creates new infrastructure risks, as developments often extend into historical floodplains.
“The 2025 flood map identifies more than 200 critical infrastructure sites exposed to increased flood risk.”
Agricultural Implications: Food Security, Farmers, and Land
California’s agricultural sector is the beating heart of the region, serving nearly half the United States with staples such as fruits, vegetables, and nuts. The central valley flood map serves as a critical instrument in securing this food production and protecting soil fertility—
even while managing the benefits and threats of flooding.
Flood Risks for Farmers and Food Production
- Unplanned floods cause crop losses, soil erosion, and harvest disruption—directly impacting food security.
- Heavy dependence on water management makes **valley** agriculture particularly sensitive to climate variability and hydrological events.
- Soil enrichment vs. risk: While periodic floods once brought silt for enhanced fertility, today’s intensified flooding patterns threaten high-value crops (almonds, grapes, tomatoes), and can contaminate soils.
The updated flood map allows farmers and landowners to identify the plots most vulnerable to inundation. For example, a grower in Fresno County can now:
- Make use of the geospatial layers to know which land parcels have the greatest risk for flooding
- Plan crop selection accordingly (choosing more flood-resilient crops or adjusting the planting schedule)
- Invest in flood control infrastructure (reinforced levees, improved drainage systems, or constructed wetlands). For advanced solutions, see the Large Scale Farm Management product from Farmonaut, which provides satellite-driven monitoring and analytics for large and small agricultural operations.
- Access real-time monitoring and weather forecasts—helpful for preparedness and fast response during flood events
Such targeted strategies reduce losses and help maintain the fertility of some of the world’s most productive agricultural regions.
Groundwater Recharge and Drought Immunity
Counterintuitively, high-flood zones identified by the central valley flood map may become strategic resources for groundwater recharge in years plagued by drought. Integrating flood control and water management preserves the resilience of California’s aquifers.
Additionally, Farmonaut’s Environmental Monitoring Tools allow agricultural stakeholders to track water use and soil moisture in real time, further enhancing climate adaptation strategies.
Explore our carbon footprinting solutions, which also help ensure that sustainability goes hand in hand with productivity.
Infrastructure and Urban Resilience with the Central Valley Flood Map
Protecting infrastructure is as vital as safeguarding crops. The Central Valley flood map for 2025 empowers urban planners, engineers, and policymakers to prioritize investments and developments where they’re needed most.
Key Vulnerable Infrastructure Zones
- Road networks (I-5, CA-99) and railroads intersecting historical floodplains
- Urban centers (Stockton, Sacramento, Fresno, Bakersfield) built atop former wetlands
- Bridges and critical infrastructure nodes that support not only the Central Valley economy, but California’s and the nation’s supply chains.
- Dams, levees, and aging water control systems, some over 60 years old
- Utility corridors (power, gas, wastewater treatment)
Each flood event can cause millions in damages, hindering supply lines and endangering both urban communities and rural populations.
The 2025 map incorporates real-time hydrological monitoring and advanced GIS technologies, allowing us to:
- Pinpoint infrastructure at risk and assess repair/replacement costs
- Develop emergency preparedness and evacuation strategies for communities residing in high-risk flood zones
- Plan new infrastructure beyond historical flood patterns, using updated risk modeling
Urban populations can benefit from satellite-driven traceability and fleet management solutions as well. For instance, Farmonaut’s fleet management capabilities enable optimized response during disasters—helping efficiently deploy maintenance, rescue, and repair teams when floods threaten vital routes or infrastructure.
For urban planners and civil engineers, the central valley flood map 2025 stands as the most authoritative, accurate tool for decision-making and future-proofing investments in a changing climate.
Environmental Considerations: Wetlands, Ecosystems, and Conservation
California’s Central Valley flood map is not just a linchpin for food security and infrastructure protection. It also supports vital ecosystem management in a region that has lost over 90% of its historical wetlands to agricultural and urban expansion.
Supporting Wetlands and Riparian Habitats
- Seasonal flooding, when channeled into designated wetlands and floodplains, rejuvenates riparian forests and provides habitat for endangered fish species (e.g., Chinook salmon, Delta smelt).
- Wetland restoration—as prioritized by the 2025 map—serves both flood control (buffering urban and agricultural land) and ecosystem conservation.
- Environmental stewards use flood maps to locate zones with potential for ecological recovery—balancing food production with habitat preservation.
Such sustainability is supported by satellite and AI-driven tools that monitor environmental impact, help identify critical zones for restoration, and establish best practices for water and land use.
To further strengthen environmental resilience and transparency across agriculture and supply chains, Farmonaut offers a blockchain-based traceability solution—helping ensure sustainable sourcing and auditing across regional agricultural production.
Satellite Technology & Farmonaut: Modern Solutions for Flood Resilience
Leveraging next-generation satellite and AI technologies, Farmonaut offers solutions that are perfectly aligned with the needs presented by the central valley flood map 2025.
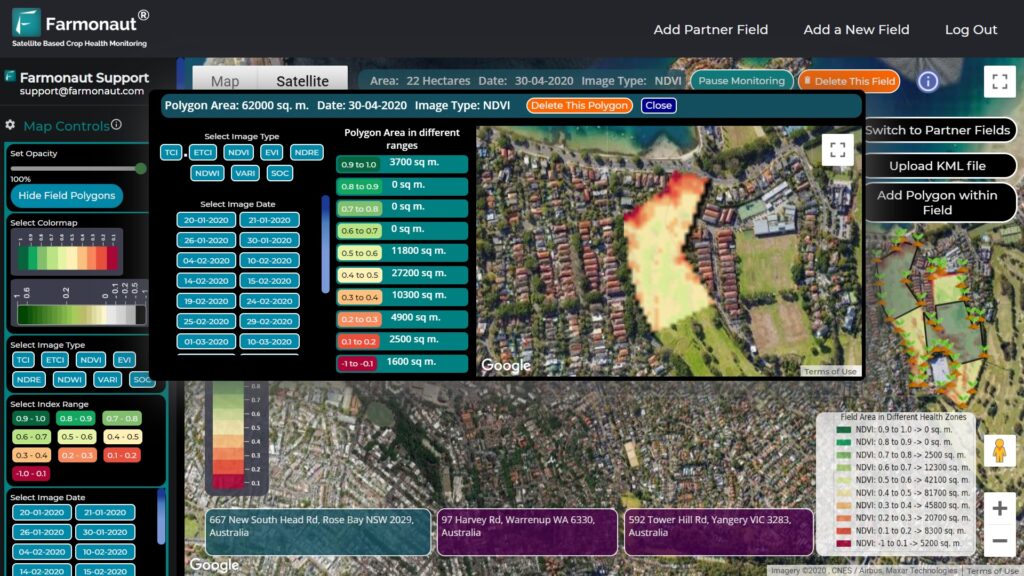
- Satellite-Based Monitoring: Delivers live imagery and NDVI/soil moisture analytics, allowing users to detect flood risks, assess crop losses, or monitor infrastructure impacts.
- AI Advisory Systems (Jeevn): Provide farmers and landowners real-time advisory on weather and disaster preparedness—based on hydrological data and forecast models.
- Blockchain Traceability: Ensures full traceability for food and resource supply chains, which can become critical during and after flood events when product authenticity and contamination management matter most.
- Fleet & Resource Management: Allows agricultural and municipal authorities to optimize fleet responses, routing, and post-flood logistics during crisis periods.
- Environmental Impact Monitoring: Makes it possible to audit carbon emissions, water use, and land management—supporting recovery, resilience, and sustainability goals.
For businesses, satellite-based crop loan and insurance verification can help speed recovery by streamlining claims and financing processes after a flood.
All of these technologies are accessible across Farmonaut’s Web, Android, and iOS Apps as well as via API integrations (see our Developer Docs).
Flood Risk and Resilience Strategies Overview
Central Valley Flood Map 2025: Building Community Preparedness
The enhanced central valley flood map 2025 arms both urban and rural communities with actionable data for preparedness:
- Early warning systems—integrated with satellite and local intelligence, these provide rapid alerts for evacuation and flood defense deployment.
- Resource allocation—prioritizing responses to the most vulnerable areas using up-to-date risk models.
- Education and outreach—using open-access flood maps and digital platforms to inform farmers, urban dwellers, and local businesses of best flood control practices.
- Policy decisions—supporting local, state, and federal policymakers with data to guide investment in flood infrastructure and sustainable land use systems.
- Long-term planning—incorporating climate change projections, urban growth, and infrastructure renewal beyond traditional floodplain boundaries.
These resilience measures are strengthened with technology: Farmonaut’s apps and AI-powered platforms (get started with our app) help automate monitoring, advisory, and reporting tasks.
For more about satellite, AI, and blockchain solutions, visit Farmonaut.com.
Looking Ahead: Building resilience in the Central Valley is not just about flood protection; it’s about securing food production, infrastructure, and communities for a sustainable future.
Discover how our crop and plantation advisory solutions help maximize land use while minimizing flood risk and supporting sustainable agriculture.
Frequently Asked Questions: Central Valley Flood Map 2025
-
Q: What is the focus of the Central Valley Flood Map 2025?
A: The map integrates historical and real-time hydrological data, topography, climate models, and infrastructure assessments to identify critical flood risk zones across California’s Central Valley. -
Q: How does the map support agriculture and food security?
A: By pinpointing high-risk plots and infrastructure, the map guides farmers and agri-businesses in adaptive practices—like flood-resilient crop selection, water management, and investing in drainage and levee systems. -
Q: Can businesses and local governments use Farmonaut solutions with the flood map?
A: Yes. Our satellite-driven platform enables real-time crop, land, and infrastructure monitoring, AI-based advisory, and blockchain traceability—enhancing flood resilience, recovery, and sustainable practices. -
Q: What infrastructure is most at risk from Central Valley floods?
A: Highways, bridges, levees, major utility corridors, and urban zones—especially those built over historical floodplains—are identified as the most vulnerable by the 2025 map. -
Q: How is climate change affecting Central Valley flood risk going into 2025 and beyond?
A: Increasingly volatile weather patterns—intense storms, rapid snowmelt—combined with urban expansion and aging levees, are driving higher than historical flood risk across all Valley sub-regions. -
Q: Where can I get technical access or integration with Farmonaut platforms?
A: API integration is available at Farmonaut API; developer documentation can be found here.
Conclusion: Sustaining the Heart of California’s Food & Infrastructure—Now and Beyond 2025
The Central Valley flood map 2025 stands not just as a static document, but as an essential, evolving tool at the heart of California’s agricultural, urban, and environmental sustainability strategies. By integrating detailed visualization, historical data, the latest climate projections, and satellite-based monitoring, stakeholders across the Valley are empowered to:
- Protect vital farmland and the nation’s food supply
- Fortify infrastructure against future storm and flood risks
- Support wetland conservation and ecosystem health
- Prepare communities with actionable, real-time flood intelligence
This focus on resilience and sustainability is what keeps California’s Central Valley—spanning nearly 20,000 square miles—a productive, fertile contributor to the United States food system well beyond 2025.
We at Farmonaut are committed to providing the satellite-driven insights, monitoring, and advisory tools that help farmers, businesses, and planners thrive—no matter what the future may bring.
To stay prepared, start using the Farmonaut Web, Android, or iOS App today.