
Central Valley Flood Mapping: Replenish Groundwater Fast for Sustainable Water Management
“Over 7 million acres in California’s Central Valley rely on flood mapping for effective groundwater recharge and flood risk management.”
“Central Valley groundwater supplies about 20% of the U.S. agricultural output, making flood mapping vital for sustainability.”
Table of Contents
- Introduction
- Understanding California Central Valley Flooding
- Challenges and Advances in Winter Flood Mapping
- Satellite Flood Imagery Technology: MODIS, Landsat, and Sentinel
- Floodwaters and Groundwater Recharge in California’s Central Valley
- Flood Risk Management: Innovations and Insights
- Surface Water Extent Maps: Data-Driven Flood Insights
- Agricultural Groundwater Replenishment: Practical Opportunities
- Central Valley Flood Extent & Groundwater Recharge Comparative Table
- Farmonaut for Satellite-Based Farm Management in Flood-Prone Regions
- API Tools and App Access for Advanced Flood Monitoring
- Satellite Farm Management: Traceability, Fleet, and Sustainability
- Climate Impact, Precipitation Events & Future Directions
- FAQs: Central Valley Flood Mapping & Groundwater Recharge
- Conclusion
Introduction: Why Central Valley Flood Mapping Matters
We live in a world where water is critical for survival, agriculture, and sustainability, especially in breadbasket regions like California’s Central Valley. With over 1.3 million residents and some of the world’s most productive agricultural areas, understanding how winter floods interact with groundwater recharge is essential for ensuring both food security and environmental health. Modern flood risk management relies on high-resolution satellite flood imagery, surface water extent maps, and advanced data-driven tools to tackle challenges posed by clouds, climate extremes, and ever-increasing demands on our aquifers.
This comprehensive guide explores the latest winter flood mapping science, demystifies how floodwaters can replenish depleted groundwater, and empowers us with actionable solutions for greater sustainability in California’s Central Valley.

“Central Valley groundwater supplies about 20% of the U.S. agricultural output, making flood mapping vital for sustainability.”
Understanding California Central Valley Flooding
The Central Valley of California is a vast, fertile region stretching ~450 miles from Redding in the north to Bakersfield in the south. It comprises three major subregions: the Sacramento Valley in the north, the San Joaquin Valley in the center, and the Tulare Basin in the south. Each of these areas plays a pivotal role in U.S. agricultural production.
- Rivers and Precipitation: The region is crisscrossed by rivers—including the Sacramento and San Joaquin—that bring both life-giving water and periodic flooding.
- Flood Risk: Flood risk is heightened during midwinter months (December through February), especially when successive atmospheric rivers soak already saturated soils.
- Impacts: Flood hazards threaten homes, infrastructure, and—most crucially—the region’s depleted groundwater basins that support the state’s and nation’s food supply.
Repeated groundwater extraction causes land subsidence—some areas are sinking more than a foot a year—which heightens the importance of effective groundwater recharge California strategies.
Challenges and Advances in Winter Flood Mapping
The Role of Clouds and Data Gaps
Historically, mapping winter floods in the Central Valley was hampered by persistent clouds, which obscured the view of satellites such as Landsat less than twice per month. This left critical gaps in our long-term understanding of surface water extent and flood risk management.
- Conventional imagery (like Landsat) offers high resolution but lower temporal frequency.
- MODIS flood data provides daily images, albeit at coarser resolution, making it invaluable for capturing the fleeting events that define the midwinter months.
Advancements: Incorporating MODIS and USGS Innovations
Recent research, including the groundbreaking study published June 4, 2025, in the Journal of Flood Risk Management, utilizes over 20 years of MODIS satellite flood data and USGS flood research methodologies to:
- Identify the extent and location of winter flooding events.
- Incorporate precipitation and soil moisture data to distinguish natural floods from intentional field inundation.
- Overlay flood data with building footprints, quantifying the economic risk outside official flood zones.
- Inform management strategies for effective groundwater recharge.

Satellite Flood Imagery Technology: MODIS, Landsat, and Sentinel
Satellite technology has become an essential tool for us to manage flood risk, guide groundwater recharge efforts, and support sustainability goals in the Central Valley. Let’s break down the differences and unique benefits of key satellite systems:
- Landsat: Since 1972, it has provided high-resolution (30m) images, offering detailed historical records but only revisiting a site every 16 days on average. This makes it excellent for post-event analysis but weak during cloudy seasons.
- MODIS (Moderate Resolution Imaging Spectroradiometer): Flies on Terra and Aqua satellites, delivering daily surface water data at 250–500m resolution. MODIS is ideal for detecting rapidly changing floodwaters during winter months.
- Sentinel Satellites: The Sentinel 1 & 2 constellation, operated by the European Space Agency, adds recent, high-frequency optical and radar coverage. Sentinel 1’s radar can even see through clouds, while Sentinel 2 provides high-resolution, multispectral data since 2015.
- Sentinel satellite flood monitoring can enable near real-time, all-weather flood detection that will be invaluable as longer data records accumulate.
Combining these satellites—along with advanced classification algorithms like the USGS Dynamic Surface Water Extent (DSWE)—unlocks a denser, more actionable picture of surface flooding across the decades.
Floodwaters and Groundwater Recharge in California’s Central Valley
Why is it important to connect floods with aquifers? Simply put: every drop of floodwaters that percolates down to depleted groundwater zones is water we store for the next drought—crucial in California’s dry climate and with enforced regulations like the Sustainable Groundwater Management Act (SGMA).
Winter Flood Dynamics
- Peak Risk: December–February (midwinter months) see the greatest probability of major floods from heavy rain and atmospheric rivers.
- Soil Saturation: Floods are most extensive when soils are already saturated from previous storms, preventing downward percolation and increasing surface runoff.
- Recharge Gaps: Satellite imagery and soil maps allow us to identify areas where floodwaters accumulate but cannot infiltrate due to hardpan or compacted soils.
Turning Floods into Recharge Opportunities
Research identifies two big strategies:
- Redirecting Floodwaters: Many flooded areas are within 5km of permeable soils, so effective management can move water laterally for aquifer recharge (e.g., temporarily enhancing river channel connectivity or spreading water across fallow fields).
- Soil Permeability Management: Tilling compacted soils or applying managed aquifer recharge (MAR) techniques can dramatically increase infiltration rates.
Flood Risk Management: Innovations and Insights for the Central Valley
Flood risk management isn’t just about keeping cities dry—it means balancing flood prevention, agricultural productivity, sustainable groundwater supply, and ecological health.
Flood Exposure Beyond Official Maps
One of the most important findings in recent flood mapping research is that the economic value of structures exposed to flooding outside designated flood boundaries is higher than those within official zones. This means many homes and businesses are at risk without adequate planning or insurance.
- Modern surface water extent maps help us proactively quantify both visible and hidden risks.
- Merging insurance claim data with satellite-derived flood information enables more accurate policy making and emergency preparedness planning.
Improving Future Flood Risk Strategies
USGS flood research and DRI-led studies recommend:
- Integrating daily satellite flood imagery with historical records to improve risk assessments.
- Targeting areas where floods are frequent, but infiltration is possible, for future groundwater recharge California initiatives.
- Regularly updating flood maps and data-driven policies as climate continues to introduce new hazards.


Surface Water Extent Maps: Data-Driven Flood Insights
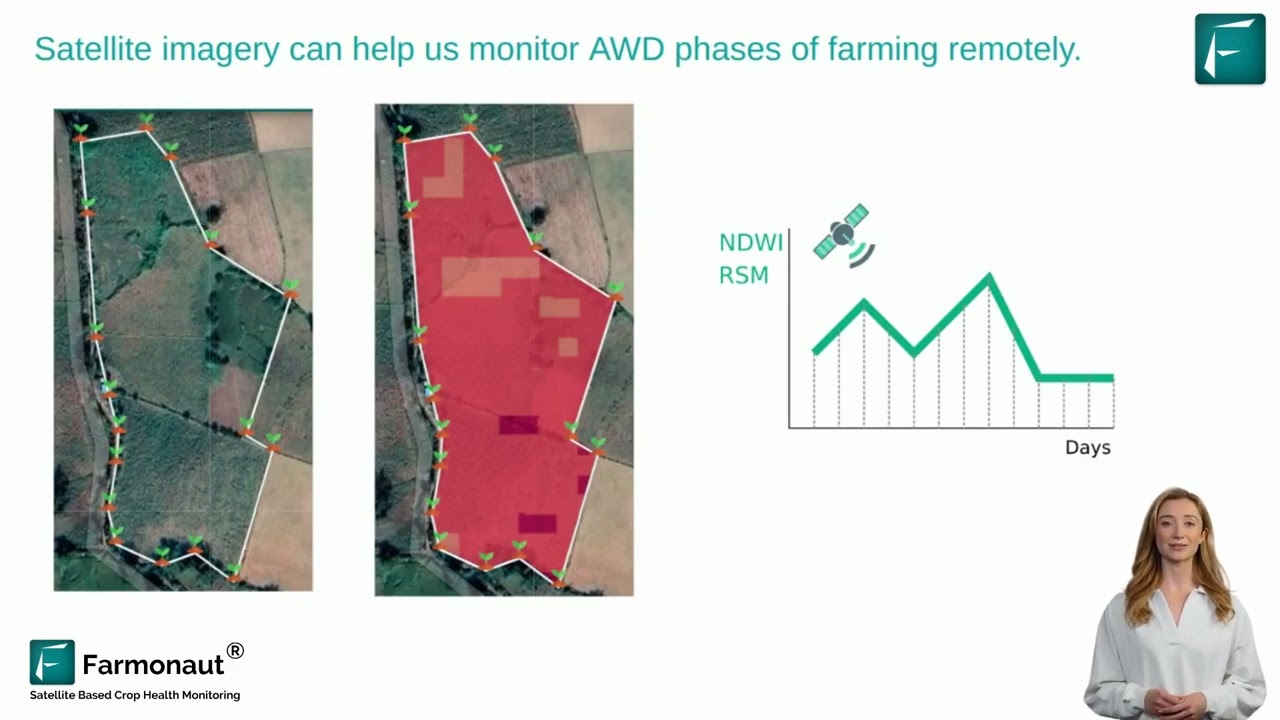
Let us explore how surface water extent maps, derived from MODIS, Sentinel, and Landsat imagery, provide us with a deeper, highly visual understanding of winter floods across California’s Central Valley.
Types of Flood Mapping Data
- Monthly Landsat and MODIS Surface Water Classifications: Highly detailed, event-specific flood mapping from 1984 (Landsat) and 2003 (MODIS) to now.
- Monthly Frequencies of MODIS High Confidence Water (DSWEmod): Shows the recurrence probability of surface water in each pixel—key for understanding seasonal inundation patterns and designing recharge strategies.
- Probability of Precipitation-Driven Surface Water Occurrence: Identifies how likely flooding is for various levels of rainfall, enabling predictive management and investment.
These maps and methods aren’t just technical—they’re directly applicable for policy making, emergency response, and strategic groundwater planning in the region.
Central Valley Flood Extent & Groundwater Recharge Comparative Table
The following table summarizes—at a glance—the relative flood hazards, recharge potential, and key climate considerations for California’s main Central Valley subregions, grounding our mapping discussion in real-world context:
| Region/Subregion | Estimated Flooded Area (km²) | Estimated Groundwater Recharge Potential (Million m³) | Flood Risk Level | Climate Impact Considerations |
|---|---|---|---|---|
| Sacramento Valley | 2,700–3,500 | 750–1,100 | Medium–High | Significant snowmelt and rainfall contribution; water can be quickly spread to nearby permeable fields for recharge. |
| San Joaquin Valley | 4,500–6,000 | 1,200–1,700 | High | Frequent atmospheric river events; deep groundwater depletion with high recharge urgency. |
| Tulare Basin | 2,000–3,200 | 700–1,000 | High | Historically endorheic; water often pools with limited outflow. Major site for managed recharge where feasible. |
*Values are estimates based on available satellite flood imagery, geohydrological models, and peer-reviewed research. For the latest and detailed dynamic maps, consult USGS, DRI, and Farmonaut satellite data platforms.
Agricultural Groundwater Replenishment: Practical Opportunities
As farmers and water managers, it is critical for us to identify and exploit opportunities to use floodwaters to both reduce flood risk and replenish groundwater.
Practical Steps for Recharge
- Use surface water extent maps and soil permeability data to select fields best suited for intentional flooding (for example: fallow plots, fields with sandy soils, or rice paddies).
- Implement managed aquifer recharge projects aligned with peak flood periods, increasing recharge volumes and reducing erosive surface flows.
- Maintain and improve existing canals and levees to facilitate efficient redirection of water from flood-prone areas to recharge basins.
Benefits for Agriculture and Communities
- Mitigates drought impacts by “banking” winter stormwater in local aquifers for use during summer dry spells.
- Boosts resilience of both family farms and urban populations who rely on groundwater as backup supply.
- Reduces land subsidence and protects valuable agricultural infrastructure long term.
Farmonaut for Satellite-Based Farm Management in Flood-Prone Regions
At Farmonaut, we strive to make cutting-edge satellite imagery and data-driven insights accessible and actionable for farmers, water managers, and government agencies. With Central Valley’s recurring floods and critical need for groundwater recharge California solutions, these technological advantages can be transformative:
-
Satellite-Based Crop and Soil Monitoring:
We leverage multispectral satellite imagery to monitor flooded fields, NDVI vegetation health, and soil moisture. This allows timely recommendations for when and where to actively replenish groundwater. -
AI-Driven Advisory:
Farmonaut’s Jeevn AI Advisory System provides personalized crop and flood management strategies, factoring in recent MODIS, Sentinel, and Landsat flood maps. -
Real-time Alerts & Notifications:
Real-time updates ensure users can quickly respond to weather events and flooding, minimizing crop loss and maximizing recharge potential. -
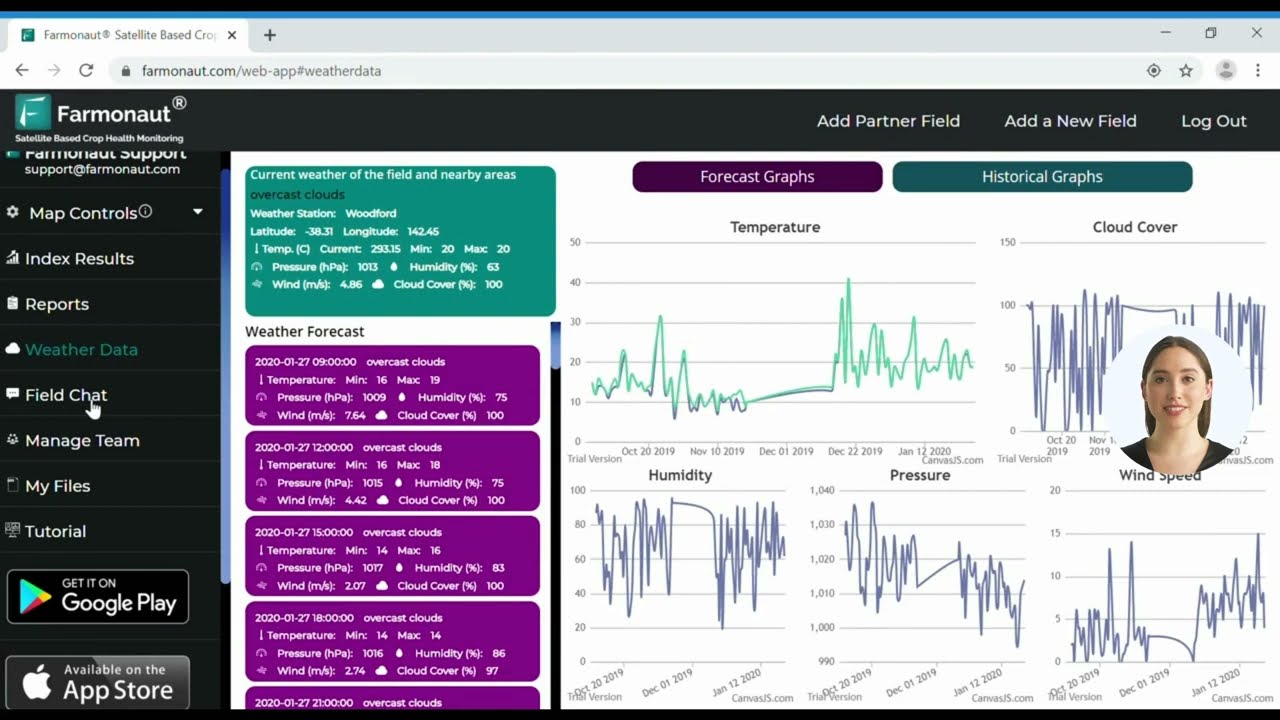
Mobile and Web Platform:
Whether you manage a small farm, a regional water board, or a research program, Farmonaut is accessible on Android, iOS, web, and via API integration.


API Tools and App Access for Advanced Flood Monitoring
For users needing programmatic access, flood and recharge analysis, and integration into enterprise or research systems, Farmonaut provides:
- Farmonaut Satellite & Weather Data API – Seamlessly connect up-to-date surface water extent maps and MODIS flood data to custom dashboards, analysis workflows, or policy applications.
- Comprehensive API Developer Documentation – Quickly find endpoints for historical and real-time imagery, precipitation, soil characteristics, and recharge analytics.
Featured Farmonaut Capabilities for Water & Flood Management:
-
Traceability for Agricultural Supply Chains:
Increase transparency with blockchain-based product traceability – validate the origin, sustainability, and transit of agricultural goods even during extreme events like flooding. -
Fleet Management Solutions:
Optimize resources and logistics during flood season—especially for rapid deployment and emergency response—with Farmonaut Fleet Management. -
Large-Scale & Agro-Admin Farm Management:
Regional managers and cooperatives benefit from Agro-Admin App—ideal for mapping flood impacts over thousands of hectares. -
Environmental Sustainability via Carbon Footprinting:
Quantify and reduce the carbon impact of farm operations, including flood-related energy use, using Farmonaut Carbon Footprinting. -
Crop Loan and Insurance Verification:
Satellite-based loan and insurance verification tools help ensure accurate claims and rapid decision making in flood-prone regions.
Tailored Subscription Plans for Every Scale
From individual farmers to large agribusinesses and environmental agencies, Farmonaut’s scalable subscriptions ensure you get precisely the satellite flood imagery, crop analytics, and reporting your project needs.
Satellite Farm Management: Traceability, Fleet, and Sustainability
Beyond flood detection, modern agricultural management requires comprehensive solutions to address traceability, resource efficiency, and climate resilience. Farmonaut supports:
- Product Traceability via Blockchain: Ensures supply chain transparency before, during, and after flood events—vital for food safety and sustainability (learn more).
- Fleet and Equipment Management: Keep your vehicles and resources safe, optimized, and ready for seasonal flood management needs (see details).
- Forest and Plantation Advisory: Tools for monitoring tree plantations, forested recharge basins, and alternate wet/dry farming phases for environmental sustainability.
- Carbon Footprinting & Compliance: Track and minimize emissions from pumping, tilling, and water diversion to align with state and global sustainability goals (learn more).
Climate Impact, Precipitation, and Future Directions
It’s clear: a warming climate is intensifying atmospheric river events and shifting the winter precipitation balance in California’s Central Valley. We must use every tool—modern flood mapping methods, innovative recharge strategies, and real-time management platforms like Farmonaut—to secure a sustainable future.
- Increasing Frequency and Intensity: The most damaging floods may become more common, but frequent smaller floods are already impacting rural communities.
- Adaptation: Datasets like DSWE and MODIS flood data must be continually integrated with climate models to update both risk maps and recharge potential zones.
- New Satellites: As Sentinels and future missions expand coverage and duration, our mapping and management tools will become even more accurate—enabling targeted, rapid response not only in California but in other regions facing similar challenges.
Research and Policy Outlook
- Expand monitoring networks to include higher-frequency radar imagery.
- Support multi-agency data sharing for comprehensive regional resilience planning.
- Invest in new soil and infiltration infrastructure where satellite data reveals chronic recharge deficits.
FAQs: Central Valley Flood Mapping & Groundwater Recharge
Why is Central Valley flood mapping important for groundwater recharge?
Flood mapping allows us to identify exactly where floodwaters are available for managed recharge, pinpointing regions where water can quickly percolate through soils into depleted aquifers. It helps policy makers, farmers, and water agencies allocate scarce water resources for long-term sustainability.
How do satellites like MODIS and Sentinel help when clouds cover the Central Valley?
MODIS delivers daily images at moderate resolution, often capturing clear views around cloud gaps missed by less frequent satellites. Sentinel 1 uses radar, enabling it to “see” surface water even during cloudy or stormy conditions. Together, they provide more consistent data for winter flood mapping.
Can fields be intentionally flooded for groundwater recharge?
Yes. Research and on-farm trials confirm that managed aquifer recharge—temporarily diverting floodwaters onto suitable fields—can significantly increase groundwater storage, especially in areas with high soil permeability.
What is the biggest limitation of MODIS flood data?
While MODIS’s daily revisit rate is valuable, its coarser resolution (250–500m) can make it difficult to distinguish urban flooding or small-scale water bodies, sometimes confusing asphalt for water in cities. High-resolution satellites and more frequent overpasses (like newer Sentinels) will improve future mapping.
How can I access up-to-date flood maps and recharge analysis?
You can access MODIS flood data, surface water extent maps, and recharge analytics via Farmonaut’s web and app platforms or through the Farmonaut API.
How does Farmonaut benefit smallholder farmers compared to large agencies?
Farmonaut is designed for scalability—it’s equally accessible and beneficial for small farms (crop, flood, and irrigation alerts), as well as for regional agencies (large-area monitoring, risk analysis, and recharge planning). Subscription plans are available for every scale.
Conclusion
As flood mapping becomes ever more critical in the face of extreme precipitation and groundwater depletion across California’s Central Valley, it is our shared responsibility to harness modern data-driven technologies. By combining satellite imagery (MODIS, Landsat, Sentinel), tailor-made surface water extent maps, and real-time management tools like Farmonaut, we can simultaneously reduce flood risk and replenish aquifers for resilient, sustainable agriculture and healthy communities.
Let’s stay informed, act with science-backed urgency, and put innovative flood risk management at the core of water sustainability for future generations.
Get Started Today: Access Farmonaut’s powerful app, API, and advisory services to optimize your own flood management and recharge strategies:
Empower your water management journey—Central Valley and beyond—with Farmonaut.


