

Farm technology · North America buyer guide
Agriculture Solutions Providers in North America: 8 Types
Agriculture solutions providers in North America fall into eight groups, from equipment dealers to satellite data services. USDA found 22% of US farms used precision practices in 2025. Compare who each group suits, what it costs, and test the payback on your own acres.
Key takeaways
- Eight provider groups cover most needs: dealers, software, imagery and data, sensors, drones and robots, consultants, input retailers, and traceability or carbon services.
- 22% of US farms used precision practices in 2025, down from 27% in 2023, and North Dakota led at 50% (USDA NASS).
- Guidance covered 58% of planted corn acres in 2016, while drones, aircraft and satellites were on 2.8% to 9.8% of acres across five crops in 2016-19 (USDA ERS).
- Average guidance replacement cost was about $20,165 for soybean growers in 2018 and $25,168 for cotton growers in 2019 (USDA ERS).
- Before buying, name one decision the tool will change, test data export, read the data terms and trial it on part of the farm.
In this article
- How agriculture solutions providers differ at a glance
- How many North American farms use these tools?
- The eight types of providers, and who each one suits
- 1. Equipment makers and their dealers
- 2. Farm management software firms
- 3. Satellite imagery and data services
- 4. Sensor and connectivity firms
- 5. Drone and robotics firms
- 6. Independent agronomists and consultants
- 7. Input retailers and co-ops
- 8. Traceability and carbon services
- What these tools cost
- Does a precision tool pay on your farm?
- How to choose an agriculture solutions provider
Agriculture solutions providers in North America fall into eight main groups: equipment dealers, farm software firms, imagery and data services, sensor makers, drone and robotics firms, agronomy consultants, input retailers and traceability or carbon services. USDA’s newest survey shows 22% of US farms used precision agriculture practices in 2025, down from 27% in 2023, with the highest rate, 50%, in North Dakota.
This guide explains what each group sells, who it suits and what the public data says about use and cost in the United States, use in Canada, and trade links with Mexico. It also has a calculator that tests whether a tool pays for itself on your acres. The numbers come mainly from USDA, Statistics Canada and Agriculture and Agri-Food Canada, each with its date.
How agriculture solutions providers differ at a glance
The groups overlap, and one company can sit in several. Start with the job you need done, then look at who does it. The table is a map of the market, not a ranking.
| Provider type | What you buy | Best for | Main cost shape |
|---|---|---|---|
| Equipment dealers | Guidance, yield monitors, variable rate hardware, service | Row crop farms replacing machinery | Purchase price plus activation or yearly fees |
| Farm software | Field records, maps, budgets, reports | Farms with many fields or several staff | Subscription, sometimes bundled |
| Imagery and data | Satellite or aerial maps, weather, APIs | Large or spread-out land; agtech builders | Per area or per data call |
| Sensor makers | Soil moisture probes, weather stations | Irrigated and high-value crops | Hardware plus connectivity |
| Drones and robots | Scouting, spraying, weeding | Spot jobs, wet or steep ground | Purchase or per-acre service |
| Consultants | Advice, prescriptions, map reading | Farms without in-house data skills | Per-acre or retainer fee |
| Input retailers | Custom application, soil sampling, advice | Farms that prefer to hire the job out | Per-acre charge, often bundled |
| Traceability and carbon | Supply records, emissions reports | Exporters and contract growers | Subscription or per-project |
How many North American farms use these tools?
Use depends heavily on what you measure. A count of all farms looks low, because it includes many small livestock and hobby places. A count of row crop acres looks high.
The Technology Use report from NASS asks every sampled farm whether it used any precision practice in the past 12 months, such as GPS guidance, yield mapping, variable rate inputs, drones, electronic tags or robotic milking. The answer was yes for 22% of farms in the USDA Technology Use report (August 2025). That report also shows 85% of farms had internet access and 82% had a smartphone, so a phone-based tool can reach far more farms than a tool that needs new machinery.
The state gap is wide. Northern Plains and Corn Belt states lead, while states with many small farms sit far lower. The chart shows selected leading states, Texas and the US figure. Minnesota, not shown here, ties Michigan at 36%.
Acre-based numbers tell a different story. The USDA Economic Research Service report on precision agriculture (February 2023) found guidance on 5.3% of planted corn acres in 2001 and 58% in 2016. It also put guidance at 72.9% of sorghum acres and 64.5% of cotton acres in 2019. Those are older surveys, but they are the most detailed national crop figures in that report.
Farm size matters too. The same report found at least half of larger row crop farms used yield maps, soil maps, variable rate tools or guidance, while under 25% of the smallest used any of the four, cotton aside. USDA adds that scale may explain part of this, since returns can be greater on bigger farms. It also notes there is no national adoption data for specialty crops or livestock in that study, so treat any claim about those sectors with care.
Chart
Farms using precision practices, by state
Percent of all farms, 2025, selected states plus the US figure
The eight types of providers, and who each one suits
Each group below has a “best for” line. The company names come from the sources cited, as examples and not as recommendations.
1. Equipment makers and their dealers
Best for: row crop farms that are already buying machinery.
A University of Illinois farmdoc daily analysis (January 2026) says dealerships, often tied to John Deere, Case New Holland or AGCO, remain the main route to precision technology. They install, calibrate, train and update the systems. Dealership-related employers account for two-thirds of farm equipment technician jobs in that analysis, so local service capacity is worth asking about before you buy.
USDA said in 2023 that most digital technology had become standard on new equipment over the previous decade. A new applicator may arrive with variable rate hardware fitted, and the maker then charges to activate it. Ask for the activation fee in writing, along with any yearly charge for correction signals.
2. Farm management software firms
Best for: farms with many fields, several staff or lender and buyer reports to file.
These tools store field records, maps and budgets. Some are sold alone and others come with inputs or consulting, which makes the true price hard to see. USDA says the same thing: bundled tools can make the cost of the software itself difficult or impossible for the farmer to observe.
Data terms are the key check. The Ag Data Transparent programme certifies how firms handle farm data. Its published member list includes John Deere Operations Center, Climate LLC’s FieldView, Syngenta’s Cropwise, Traction Ag and Farm Credit Canada’s AgExpert. Being on that list speaks to a firm’s data contract, not to how well its product works.
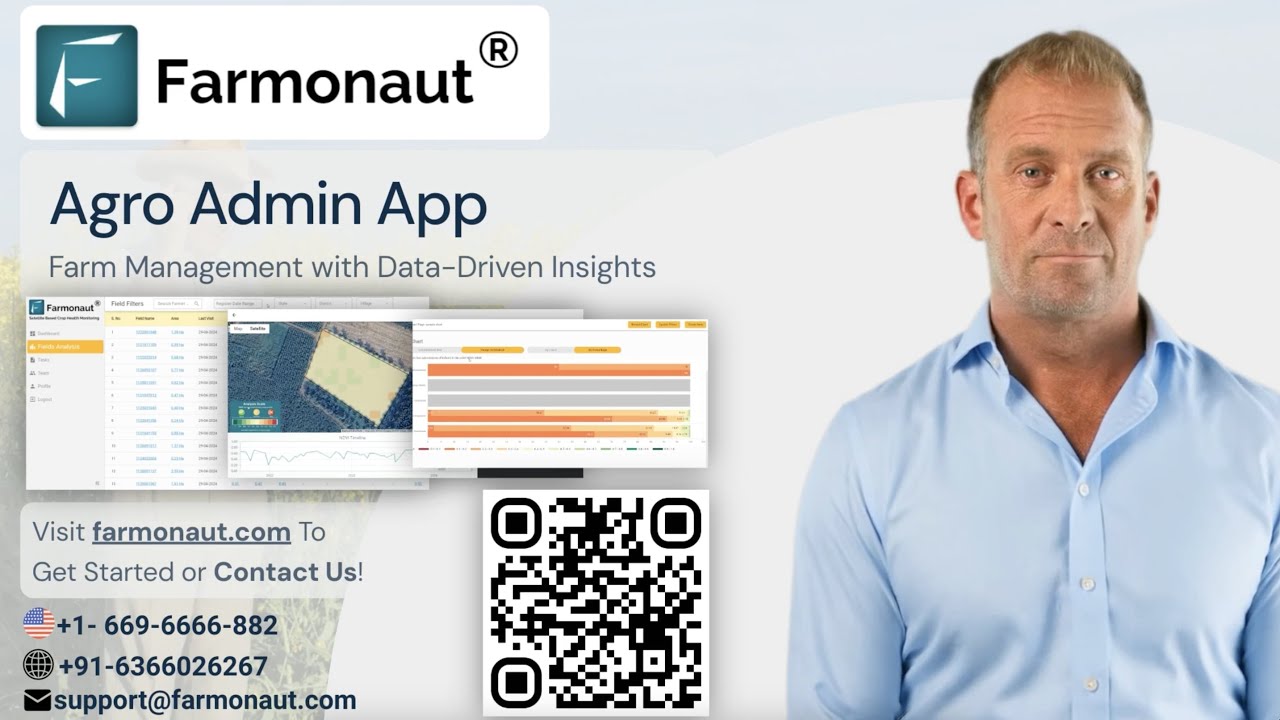
▶ A walk through the Farmonaut Agro Admin app for managing large farms. · 7:27
3. Satellite imagery and data services
Best for: large or scattered land, absentee owners, and agtech teams that need field data in their own software.
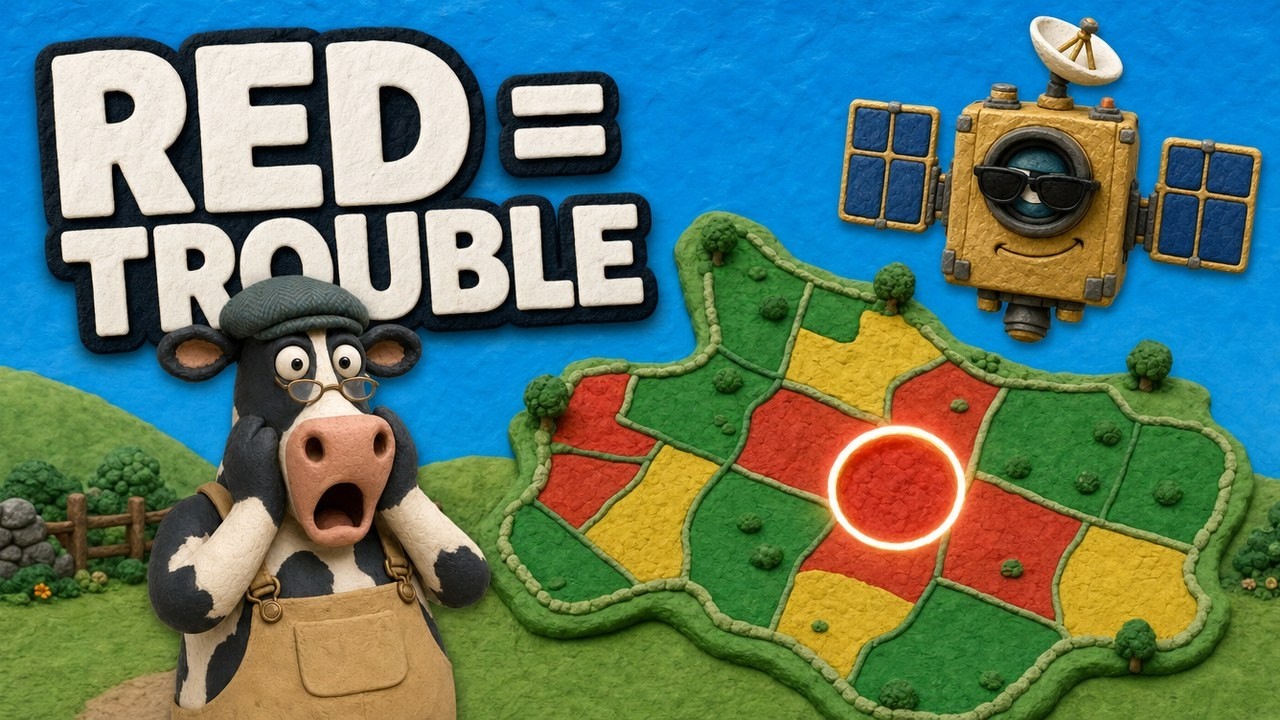
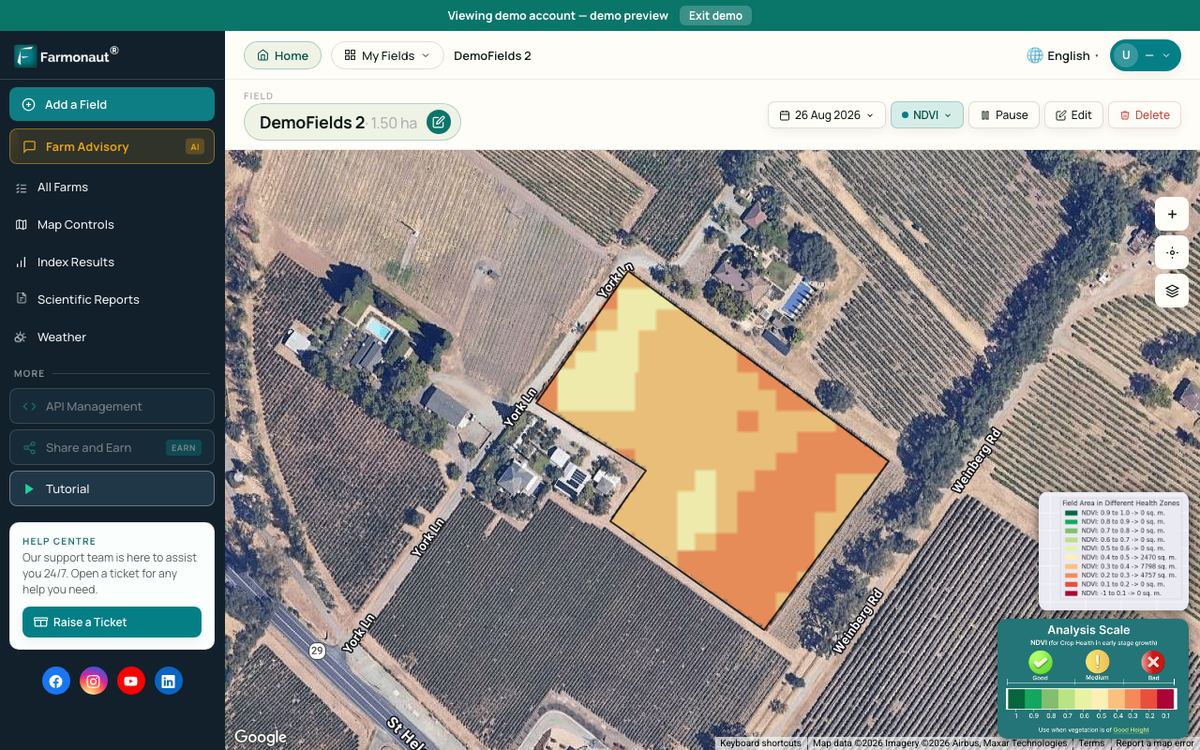
▶ How satellite NDVI maps show crop stress across a large farm. · 4:09
Satellites give repeated views of whole fields without any hardware on the farm. They show changes in plant cover, which tell you where to look. They do not tell you the cause, so someone still has to walk the spot. Cloud cover can also delay a clear image.
Use of aerial tools has been low in row crops. USDA combines drones, aircraft and satellites in one survey question, and found them on 2.8% to 9.8% of planted acres across five crops from 2016 to 2019. That is an old baseline, so ask any seller for current numbers and where they come from.
Farmonaut works in this group, with satellite crop maps for growers and an agriculture API for software teams.
Chart
Drone, aircraft or satellite imagery use by crop
Percent of planted acres, survey year in brackets; the three tools are measured together
4. Sensor and connectivity firms
Best for: irrigated crops, orchards and vineyards, where a water decision has a clear price.
Soil moisture probes, weather stations and pump monitors send readings to a phone or dashboard. Metos Canada’s FieldClimate is one weather and sensor product on the Ag Data Transparent list. Before you buy, check signal coverage on the actual field. In the USDA report, 55% of farms used broadband and 74% had a cellular data plan in 2025, and 85% reported any internet access, so about 15% had none.
5. Drone and robotics firms
Best for: spot spraying, scouting small problem areas and fields that ground rigs cannot reach when wet.
In the United States, spraying by drone falls under 14 CFR Part 137, the FAA rule on dispensing agricultural products from aircraft. The FAA also says it has found exemption holders working outside their conditions and has started operational checks, so ask any contractor for their paperwork. Check that the pesticide label allows the application method, follow the label, and check state and provincial rules. Canada and Mexico have their own aviation and pesticide regulators.
Self-driving field machines and electric tractors get a lot of press, but the sources used here give no national count of them on farms. Ask a seller for reference customers near you, and run a trial on one field before committing.
6. Independent agronomists and consultants
Best for: farms that collect data but do not have time to read it.
USDA found that adopters of precision tools hire technical or consultant services more often than non-adopters, though such services were used on a small share of surveyed acres. For example, 7% of 2016 corn acres were managed with both a precision technology and a consultant who built or read a yield or remote sensing map. A good adviser can also test whether a vendor’s recommendations fit your soils. For fertilizer plans, get local agronomic advice for rates.
7. Input retailers and co-ops
Best for: farms that would rather hire a job than own the equipment.
Retailers and co-ops offer soil sampling, custom application and agronomy bundled with seed or fertilizer. GROWMARK’s FS Advanced Information Services and Sollio Agriculture’s AgConnexion both appear on the Ag Data Transparent list. USDA cites a Great Plains custom rate survey in which Nebraska farmers paid about $1.52 to $1.91 more per acre for some variable rate applications (McLure and Jansen, 2020). Get a current local quote, since that survey is several years old.
8. Traceability and carbon services
Best for: exporters, contract growers and anyone selling into a buyer programme that asks for records.
These firms keep records of where a product came from and how it was grown, or they estimate farm emissions. USDA groups blockchain with newer technologies that are still emerging, so ask what your buyer really requires before paying for it. A shared spreadsheet may satisfy one buyer, and a certified system may be required by another.
Carbon programmes need extra care. Contract length, who owns the credits and what happens if you stop a practice can all affect the value. Have a lawyer or adviser read the contract. ESMC’s EcoHarvest and Carbon by Indigo are both listed by Ag Data Transparent, which also offers a separate carbon contract check.
What these tools cost
Public cost data is thin, and most firms set their own prices. The best national figures we can point to are from USDA’s farm survey, reported by soybean growers in 2018 and cotton growers in 2019. Cotton farms were larger: half of cotton acres were on farms with 2,500 cropland acres or fewer, against 1,105 for soybean acres. These are averages from years ago, not quotes.
USDA stresses that prices differ by maker and that many farms run a mix of brands. So check that a new tool can read data from the machines you already own.
The benefit side is also modest in the survey work USDA reviews. It cites a study of 2010 corn farms that found mapping raised operating profit by almost 3% and variable rate technology by 1.1%. Be wary of a vendor who promises far more without trial data from your region.
Chart
Average reported cost of precision tools, soybean growers
US$, 2018 survey; replacement cost, except variable rate, which is the premium paid
Does a precision tool pay on your farm?
Most buying errors come from comparing a price with a hoped-for saving and never working out the break-even. Put in a real quote and your own input bill. The calculator spreads the purchase across its working life and adds the yearly fee. It leaves out interest, tax and any yield change, so treat the result as a first test and speak to your accountant before a large purchase.
Try the numbers for your own farm below.
Calculator
Does this tool pay for itself each year?
Enter a real quote, your acres and your input bill.
- Yearly cost of the tool (US$): $3,200
- Yearly input saving (US$): $3,200
- Saving needed to break even: 3.2 %
All defaults are round examples set close to break-even, not benchmarks or forecasts. Example price, use today’s quote. Replace each value with your own. The formula leaves out interest, tax, resale value and yield change.
How to choose an agriculture solutions provider
Run through these steps before you sign anything. They work for a grower and for a startup picking a data partner.
- Name one decision. For example, “where should I scout first this week?” or “where can I cut nitrogen?” If a tool will not change a decision, skip it.
- Check your connection. Test mobile signal in the field, and ask what works offline.
- Check compatibility. List your machines and software. Ask for a working export file, not only a promise.
- Read the data terms. Who owns the data, who can see it, and can you delete it when you leave?
- Ask for local proof. Same crop, same region, and a reference you can phone.
- Trial it on part of the farm. Leave a comparison strip so you can measure the gain against your own normal practice.
- Price the whole term. Add activation, support, signal, training and exit costs over the years you plan to use it.
- Check the service. Who answers during planting or harvest, and how fast? The farmdoc analysis found roughly 3 to 7 technicians per 100 farms even in the states where they are most common.
Questions for agtech startups and software teams
If you are building a farm product, you are choosing suppliers too. Ask a data provider about image frequency, resolution, how far its history goes back, the crops and regions it has been tested on, and its limits on calls. Test on fields where you already know the outcome. Also check that your own data contract with growers matches what your suppliers are allowed to do with that data.
Agriculture in North America: how the three markets differ
The same tool can make sense in one country and not in another. Farm size, crop mix and trade links all shift what buyers need.
Farm technology buyers in the United States
Spending shows the size of the market. The USDA Farm Production Expenditures summary (July 2026) puts total US farm spending at $490.3 billion for 2025, up 1.9% from 2024. Farm services took $55.0 billion, or 11.2%. Crop farms and livestock farms have different needs, so a provider built for corn may not suit a ranch. In the Technology Use data, Iowa and Illinois each reported 42% of farms using precision practices in 2025, against 14% in Texas.
The fall from 27% to 22% nationally deserves a careful reading. The chart below shows it was not uniform: Minnesota rose from 32% to 36% and Michigan held at 36%. The report gives no reason for the change, and state samples can move from one survey to the next.
Chart
Precision practice use: 2023 vs 2025
Percent of all farms, selected states and the US
Farm technology buyers in Canada
Canada has fewer farms and more area per farm. The 2021 Census of Agriculture counted 189,874 farms, and 34.3% were oilseed and grain operations. From 2015 to 2020, Statistics Canada reported more use of automated guidance (+28.2%) and geographic information system mapping (+58.6%). The census also found 64.5% of farms used land practices such as rotational grazing, winter cover crops or shelterbelts in 2020, up from 53.7% in 2015.
Agriculture and Agri-Food Canada reports C$97.4 billion in farm market receipts for 2025 and notes that the largest 10% of farms generate more than two-thirds of revenue. It says the United States took about 61% of Canada’s agri-food exports in 2025. For a provider, that means a small number of large accounts carry a lot of the value, while many smaller farms need a simpler and lower-priced offer.
Farm technology buyers in Mexico
Mexico’s link to the wider market runs largely through trade with its neighbours. The United States-Mexico-Canada Agreement took effect on 1 July 2020, according to the USDA page on USMCA, Canada and Mexico. The same page summarises a USDA study showing Mexico’s share of US farm imports from Latin America and the Caribbean grew from 44.1% in 2007-09 to 58.2% in 2019-21, with fresh berries and avocados among the products that gained. Export growers should ask buyers which records they need, and confirm the current rules with their importer, because trade terms can change.
Sustainable farming services: what to check
Many providers now sell soil health and climate services. The evidence is mixed, and it helps to know that before you sign. The June 2025 USDA report on soil health practices found that only 46% of operations with cover crop acres in 2017 still reported them in 2022, and that the financial return from adopting cover crops was often negative without cost-share or other help. It also found operations using both no-till or strip-till and cover crops were more technically efficient. So ask a provider how it handles the first few years, and whether any payment covers your added cost.
Integrated pest management, reduced tillage and better irrigation scheduling are also sold as services. Pest thresholds and product choices should follow the label and your local extension advice.
Vertical farming is often listed beside these tools, but check the sums. A peer-reviewed analysis of vertical farming in Plant Physiology (2025) estimated that vertical farms turn purchased electricity into food energy at about 1% to 2% efficiency, and found electricity costs limit competitive production of staple crops and even vegetables. The authors see the gap as far smaller for leafy vegetables and tomatoes than for dried staples such as wheat and rice.
Where the market is heading
The future of farming in America will depend on whether tools pay on ordinary farms, not on the newest demo. Public data points to three trends to watch: use is high on big row crop farms and much lower elsewhere; most farms have a smartphone (82% in 2025), which favours simple apps; and service capacity matters, since machines and software need people to keep them running.
AI features are spreading through farm software. The sources used in this guide do not give a reliable national measure of their use, so judge them like any other tool. Ask what data the advice is based on, whether it has been tested on your crop, and who is responsible if it is wrong.
Related pages on our site: large farm administration app; fleet management; product traceability; carbon footprint tracking; crop loan and insurance checks; satellite and weather API documents; API console; web and mobile apps.
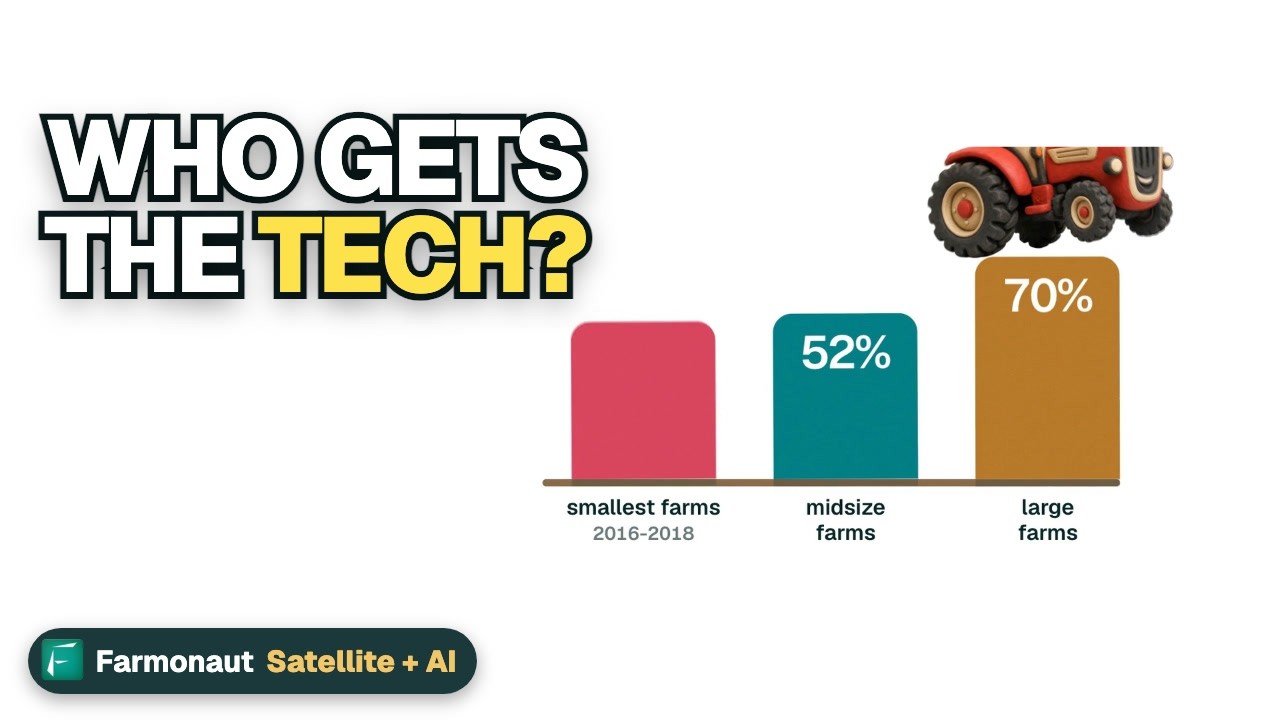
▶ What farm technology means for money, jobs and internet in rural towns. · 3:50
FAQ
Who are the leading providers of innovative farming solutions?
No public source ranks them by a single measure. Dealerships tied to John Deere, Case New Holland and AGCO are the main channel for machine-based precision tools, according to farmdoc daily. Software and data firms form a wider field, so compare them on the job you need done.
What are the best smart farming tools for a mid-sized row crop farm?
USDA data shows guidance has the widest use on row crop acres, ahead of variable rate tools and aerial imagery. That reflects how common it is, not proof that it is best for you. Use the calculator with your own quote and input bill.
Which US state uses precision farming the most?
North Dakota had the highest share in USDA’s 2025 Technology Use report, at 50% of farms. Iowa and Illinois followed at 42%. These are shares of farms, not of acres.
Do satellite tools replace field scouting?
No. Satellite maps show where plant cover has changed, which helps you decide where to go first. A person still needs to check the spot and find the cause.
How can I avoid being locked in to one provider?
Ask for a test export of your records before signing, and check the contract for data ownership and deletion. Also check that the tool reads data from your other machine brands, since USDA notes many farms run a mix of makers.
Farmonaut agriculture API
Add satellite field data to your own software
Software teams can test satellite and weather data for their own fields through the Farmonaut agriculture API at farmonaut.com/farmonaut-agriculture-api.



Keep reading


Sources
- USDA NASS, Technology Use (Farm Computer Usage and Ownership), August 2025: esmis.nal.usda.gov
- USDA ERS, Precision Agriculture in the Digital Era: Recent Adoption on U.S. Farms, EIB-248: ers.usda.gov
- USDA NASS, Farm Production Expenditures 2025 Summary, July 2026: esmis.nal.usda.gov
- Kalva and Janzen, farmdoc daily, University of Illinois, January 2026: farmdocdaily.illinois.edu
- Statistics Canada, The Daily: 2021 Census of Agriculture, May 2022: www150.statcan.gc.ca
- Agriculture and Agri-Food Canada, Overview of the sector: agriculture.canada.ca
- FAA, Dispensing Chemicals and Agricultural Products (Part 137) with UAS: faa.gov
- USDA ERS, soil health and conservation practices report, ERR-353: ers.usda.gov
- Vertical farming limitations and potential, peer-reviewed article on PubMed Central: pmc.ncbi.nlm.nih.gov
- USDA ERS, USMCA, Canada and Mexico: ers.usda.gov
- Ag Data Transparent, certified member companies and core principles: agdatatransparent.com
Discussion
Questions, corrections or field experience? Share them below. First-time comments are reviewed before they appear, and your email is never published.
No comments yet. Be the first to add a question or your experience.

 Marei Nursery
 Sayaji Group
 eKGIS
 Mostas Tech
 Native Seeds
 Andex
 FCF India
 Unifrutti Gulf
 Deluxe Conseil
 TVS Electronics
 BW Pipelines
 WICO
 Chimera Innovation
 SkyHarvest
 Polaris Digitech

 Licence holder · Niger · Gold










