

Reviewed August 2026 against USDA Economic Research Service, USDA National Agricultural Statistics Service, and DTN Professional fertilizer market data.
Try it: Fertilizer Cost-Per-Acre Calculator →
Table of Contents
- Where US Agricultural Technology Stands Right Now
- Fertilizer Prices: UAN, Urea, and Anhydrous Ammonia
- Try It: Fertilizer Cost-Per-Acre Calculator
- Precision Agriculture and AI Adoption
- Autonomous Farm Machinery and Autonomous Mining
- Irrigation Systems: What US Farms Actually Use
- IoT and Smart Sensors on the Modern Farm
- Agrivoltaics, Regenerative Practices, and Vertical Farming
- Blockchain Traceability and Supply Chain Transparency
- Comparison Table: Technology, Adoption, and Cost
- Challenges: Cost, Data, and Access
- Frequently Asked Questions
- Where This Goes Next



Where US Agricultural Technology Stands Right Now
Fertilizer is the input that moves a US row-crop budget the most, and it is currently the most volatile: UAN28 priced at $446 per ton and urea at $678 per ton in the US Corn Belt as of August 2026, according to DTN Professional’s weekly fertilizer tracking. At the same time, only 27% of US farms report using precision agriculture practices, per the USDA Economic Research Service’s most recent analysis of Census of Agriculture data — a gap between what technology exists and what most farms have actually adopted. This article lays out the current fertilizer price bands, precision-ag and autonomous-equipment adoption figures by farm size, irrigation system data, and a calculator that turns your own acreage and fertilizer choice into a real per-acre cost.
None of the numbers below are static. Fertilizer prices move weekly with natural gas costs and global supply; adoption figures update on USDA’s survey cycle. Each figure carries its source and vintage so you can pull a fresher number the next time you check.
Fertilizer Prices: UAN, Urea, and Anhydrous Ammonia
Fertilizer accounts for 20–30% of total US farm production expenses for the 2026 crop year, per USDA Agricultural Marketing Service data summarized in farmdoc daily’s fertilizer-decision analysis from the University of Illinois. That share is why a swing of even $20–30 per ton moves a whole operation’s margin. Here is where the four major nitrogen products stood in the US Corn Belt at the start of August 2026, per DTN Professional’s weekly market report:
- UAN28 (28% nitrogen): $446 per ton
- UAN32 (32% nitrogen): $458 per ton
- Urea (46% nitrogen): $678 per ton
- Anhydrous ammonia (82% nitrogen): $963 per ton
- Try it: Fertilizer Cost-Per-Acre Calculator
Read for actual nitrogen delivered, not just price per ton, urea at $678/ton works out to roughly $1.47 per pound of nitrogen (678 ÷ (46% × 2,000 lb)), while UAN28 works out to roughly $1.59 per pound of nitrogen and anhydrous ammonia to roughly $0.59 per pound — anhydrous remains the cheapest nitrogen source per unit, which is the calculation the tool below runs for you against any of these four products and your own acreage.
Because these prices move on DTN’s weekly cadence, the specific dollar figures above will be out of date by the time you read this in a different week — check the source directly at DTN Professional’s fertilizer price tracker for the current week’s numbers before locking in a purchase decision. That durability is the point: the method (price ÷ nitrogen content = cost per pound of actual nutrient) never expires even when the dollar figures do.
Try It: Fertilizer Cost-Per-Acre Calculator
Put your own acreage, target nitrogen rate, and product choice into the tool below — it converts the DTN Corn Belt prices above into a cost-per-acre and total-cost figure using your numbers, not a generic example.
Fertilizer Cost-Per-Acre Calculator
Assumptions: prices are DTN Professional’s US Corn Belt retail quotes for August 2026 and exclude application, freight, and any regional basis. It does not account for other nutrients (P, K, S), starter fertilizer, or split applications. Re-run with current prices from the DTN link above before budgeting.
Precision Agriculture and AI Adoption: The Actual Numbers
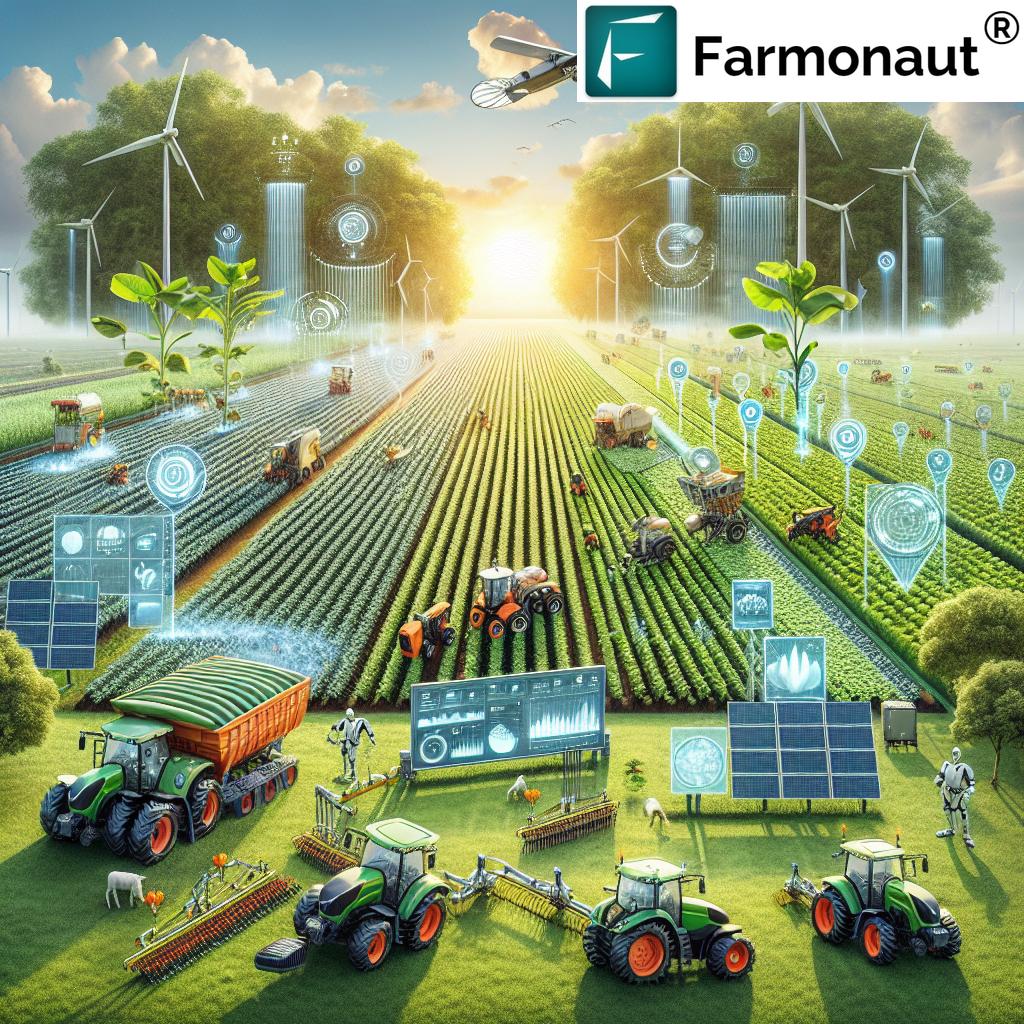
“Agricultural technology advancements” as a search term covers a lot of ground, but the number that matters is adoption, and it splits sharply by farm size. The USDA Economic Research Service’s analysis of Census of Agriculture data found that 27% of US farms overall use some precision agriculture practice, but that average hides a wide gap: 70% of large-scale crop farms use guidance autosteering systems, versus 52% of midsize crop farms, and 68% of large-scale crop farms use yield monitors and soil mapping. Precision agriculture, in other words, is close to standard practice on large operations and still a minority practice everywhere else.
AI-driven farm management platforms, including Farmonaut’s, sit inside that adoption curve by handling the data layer these practices depend on:
- Analyzing satellite-derived soil moisture, temperature, and vegetation indices to flag crop stress before it’s visible on the ground.
- Cross-referencing weather forecasts against planting and spray windows to reduce yield loss from timing misses.
- Flagging early pest or disease signals from imagery patterns, cutting unnecessary pesticide passes.
- Recommending fertilizer rates from soil and crop-need data rather than a flat blanket rate across a field.
Farmonaut’s Jeevn AI advisory layer applies this same logic — real-time satellite analytics paired with local weather data — to generate field-specific recommendations rather than regional averages.
The USDA ERS figures above come from Census of Agriculture data, which runs on a five-year cycle (the next full census lands in 2027); interim readings are available annually through USDA’s Agricultural Resource Management Survey (ARMS). If you want the current adoption rate rather than the 2023 figure cited here, ARMS is the source to check.
Autonomous Farm Machinery and Autonomous Mining
Autonomous equipment is no longer a pilot-stage curiosity: the global autonomous farm equipment market was valued at $23 billion in 2026, per Research and Markets and Grand View Research analysis, and North America accounts for 39% of global autonomous tractor installations, per Persistence Market Research’s regional breakdown — the largest single-region share, reflecting the scale of US row-crop operations and the labor economics that favor automation on large acreage.
The mechanics are shared with a related but distinct category — autonomous mining — where GPS guidance, computer vision, and remote or self-directed operation replace manual control of haul trucks and drilling rigs in open-pit and underground operations. Both fields draw on the same underlying stack: positioning systems, obstacle-detection sensors, and machine-learning models trained to repeat a task precisely across thousands of cycles. In farming specifically, this shows up as:
- Reduced reliance on seasonal labor during planting and harvest windows, when hired labor is hardest to secure.
- More consistent input placement — fertilizer, seed, and chemical application follow the same path every pass, cutting overlap waste.
- Extended operating windows, since autonomous units can run overnight shifts a human operator cannot sustain.
For the current adoption and cost curve specific to your equipment class, check Persistence Market Research’s autonomous farm equipment report directly, since regional shares shift as manufacturers expand distribution and financing options.
Irrigation Systems: What US Farms Actually Use
Water management technology is where “smart irrigation” claims get tested against actual survey data. USDA’s National Agricultural Statistics Service counted 212,714 US farms operating irrigation systems across 53.1 million irrigated acres in its 2023 Irrigation and Water Management Survey. Within that acreage, pressure-sprinkler systems — center pivot, drip, and micro-flow combined — cover 72% of irrigated acreage nationally, while drip and trickle irrigation specifically accounts for 5% of total irrigated acreage.
That 5% figure matters for anyone comparing irrigation technology upgrades: drip systems are far less common than center-pivot sprinklers nationally, concentrated instead in high-value specialty crop regions (orchards, vineyards, vegetables) where the precision justifies the higher per-acre installation cost, rather than spread evenly across row-crop acreage. Smart irrigation controllers — soil moisture sensors paired with automated valve timing — layer on top of any of these system types rather than replacing them, and Farmonaut’s platform delivers the scheduling layer (moisture data, weather-linked timing, satellite field monitoring) that turns a fixed-schedule sprinkler or drip system into a demand-driven one.
USDA NASS publishes this irrigation survey annually each fall; check the Farm and Ranch Irrigation Survey page for the next release before citing these figures as current-year numbers.
IoT and Smart Sensors on the Modern Farm
Internet of Things sensors are the layer that feeds data into both the precision-agriculture adoption figures above and irrigation-scheduling decisions. Soil moisture probes, leaf-wetness sensors, and weather stations report continuously to a phone or farm management dashboard rather than requiring a manual field check, and they underpin the yield-monitor and soil-mapping adoption rate of 68% on large-scale US crop farms cited by USDA ERS above. Practically, that data stream supports:
- Irrigation scheduling triggered by measured soil moisture rather than a fixed calendar interval.
- Automated pest and disease alerts from combined imagery and sensor thresholds, rather than a scheduled scouting visit.
- Greenhouse and controlled-environment monitoring for temperature and humidity in high-value specialty crop production.
Farmonaut’s platform layers satellite-based field monitoring on top of this same data category, giving a season-long view of crop and soil condition without requiring ground sensor hardware on every field.
Agrivoltaics, Regenerative Practices, and Vertical Farming
Three further categories round out the current technology landscape, each addressing a different constraint — land, soil, and space:
Agrivoltaics pairs solar panel installation with active crop or grazing use of the same land, generating power for irrigation pumps and cold storage while the panels’ partial shade reduces evaporative water loss and heat stress on crops beneath them. It is a land-use efficiency play as much as an energy one, and it pairs naturally with the high-yield crop planning that determines which fields can tolerate partial shading without a yield penalty.
Regenerative agriculture — crop rotation, cover cropping, and reduced tillage — addresses soil degradation directly rather than through equipment. These practices restore organic matter and water-holding capacity over multi-year horizons, and tools like Farmonaut’s Carbon Footprinting platform let an operation track soil-carbon and emissions trends over that same multi-year window rather than a single-season snapshot.
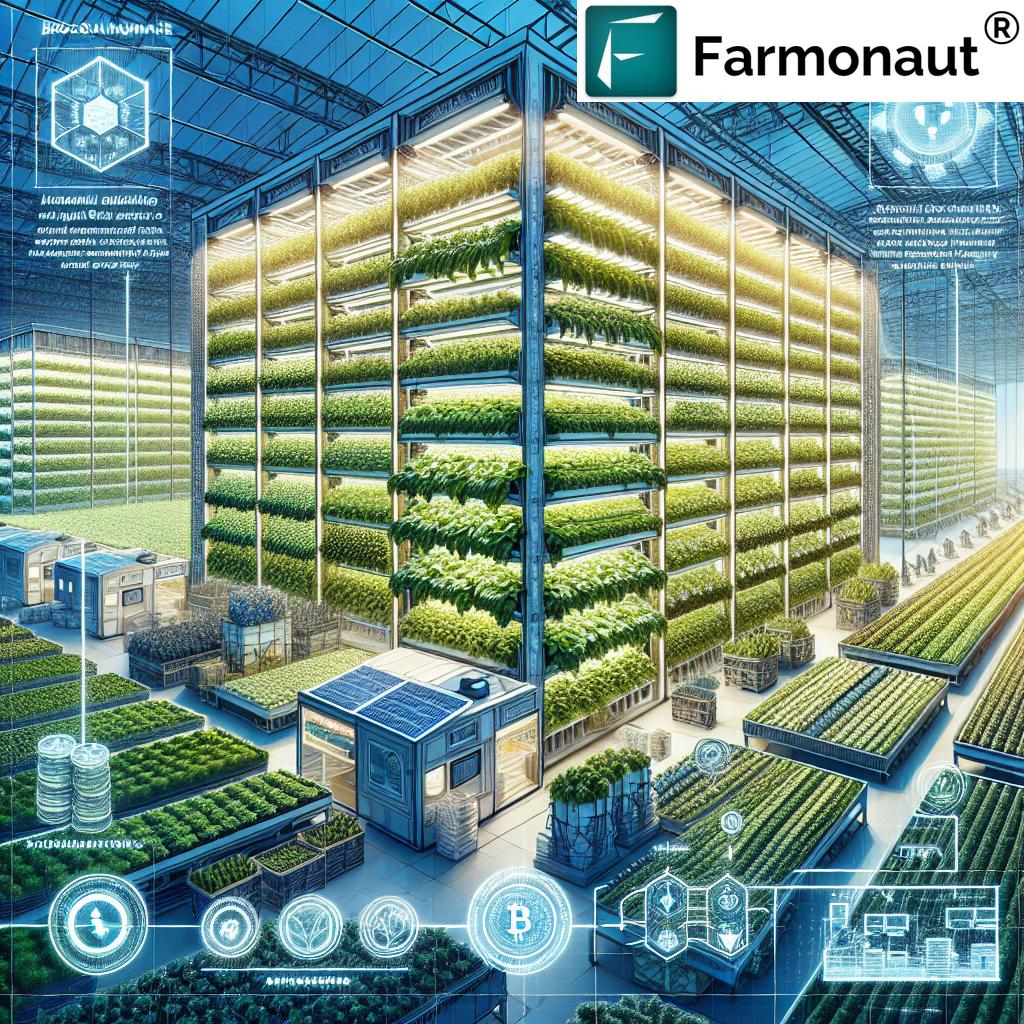
Vertical farming moves cultivation off open land entirely, stacking hydroponic or aeroponic growing layers inside a climate-controlled building. It suits high-value, fast-turnover crops — leafy greens, microgreens, herbs — near urban demand centers, trading land and water efficiency for higher energy and capital cost per unit of production. For a broader view of how these fit alongside older farming methods, see the beginning of farming: 7 key innovations.
Blockchain Traceability and Supply Chain Transparency
Blockchain-based traceability addresses a different problem from the technologies above: not production efficiency, but proof. A tamper-resistant transaction ledger lets a buyer or regulator trace a shipment’s origin, handling, and processing history without relying on paper records that can be altered or lost. The three practical uses are:
- Origin verification: confirming where and how a crop or commodity was actually produced.
- Recall speed: narrowing a contamination or quality issue to a specific batch or field instead of an entire shipment.
- Buyer trust: supporting export or premium-market claims (organic, sustainably grown) with a verifiable record rather than a label alone.
Farmonaut’s product traceability platform logs each stage of production, transport, and processing for agribusinesses and food brands that need to substantiate these claims to buyers or auditors.
Comparison Table: Technology, Adoption, and Cost
| Technology | Key Figure | Source & Vintage | Primary Benefit |
|---|---|---|---|
| Precision agriculture (all US farms) | 27% adoption | USDA ERS, 2023 Census data | Targeted input use, yield data |
| Guidance autosteering, large-scale farms | 70% adoption | USDA ERS, 2023 | Reduced overlap, operator fatigue |
| Guidance autosteering, midsize farms | 52% adoption | USDA ERS, 2023 | Same, lower capital base |
| Yield monitors / soil mapping, large farms | 68% adoption | USDA ERS, 2023 | Field-level yield and soil data |
| Irrigated farms, nationally | 212,714 farms / 53.1M acres | USDA NASS, 2023 survey | Water resource management |
| Drip/trickle irrigation share | 5% of irrigated acreage | USDA NASS, 2023 | High-precision water delivery |
| Autonomous farm equipment, global market | $23 billion valuation | Research and Markets / Grand View Research, 2026 | Labor-gap coverage, uniform operations |
| Autonomous tractors, North America share | 39% of global installs | Persistence Market Research, 2026 | Regional adoption leadership |
| Fertilizer share of farm production costs | 20-30% of expenses | USDA AMS via farmdoc daily, 2026 | Largest controllable input line |
Integrate Data, Enhance Operations with Farmonaut APIs
For developers, agritech companies, or enterprise agribusinesses integrating satellite data, crop advisories, and weather analytics directly into their own systems, explore the Farmonaut API and the API Developer Docs.
- Carbon Footprinting Tool: Track emissions trends over time to support compliance and market access requirements.
- Blockchain Traceability: Transparent supply chain records for authenticated food and non-food products.
- Satellite-Based Crop Loan & Insurance Verification: Field data for loan and insurance processing.
- Fleet Management Tools: Fleet tracking for resource allocation and fuel-cost reduction.
- Large Scale Farm Management: Centralized monitoring for large plantation and multi-field operations, also accessible via the Farmonaut platform.
Challenges: Cost, Data, and Access
The gap between what precision agriculture can do and the 27% adoption rate USDA ERS reports is not a technology problem — it is largely a cost and access problem:
- Upfront capital: Hardware-based precision systems (guidance units, yield monitors, sensor networks) require investment that is easier to justify on the large operations where adoption already sits at 68-70%, per USDA ERS, than on midsize farms at 52%.
- Fertilizer cost exposure: With fertilizer at 20-30% of production expenses per USDA AMS data, price swings like the current $446-$963/ton spread across nitrogen products directly affect whether a farm can absorb a technology investment in the same budget year.
- Data and connectivity: IoT sensor networks and autonomous guidance both depend on reliable connectivity and a level of technical support that is unevenly distributed across rural regions.
- Equipment financing and equity: As autonomous equipment scales toward the $23 billion global market Research and Markets tracks for 2026, the financing terms available to smaller operations will determine whether the North American adoption lead (39% of global installs, per Persistence Market Research) stays concentrated on large farms or broadens.
Satellite-based platforms like Farmonaut address the capital-cost side of this directly: because the sensing happens in orbit rather than through ground hardware purchased per field, the entry cost for imagery-based crop and soil monitoring is substantially lower than instrumenting every field with physical sensors.
Frequently Asked Questions
1. What are the current UAN and urea fertilizer prices in the US?
As of August 2026, DTN Professional reported US Corn Belt retail prices of $446 per ton for UAN28, $458 per ton for UAN32, $678 per ton for urea (46% N), and $963 per ton for anhydrous ammonia (82% N). These move weekly; check DTN’s fertilizer tracker for the current week’s figures.
2. What percentage of US farms use precision agriculture?
27% of US farms overall, per USDA Economic Research Service analysis of 2023 Census of Agriculture data — rising to 70% for guidance autosteering on large-scale crop farms and 68% for yield monitors and soil mapping on the same farm size.
3. How is autonomous mining related to autonomous farm equipment?
Both rely on the same core stack — GPS/GNSS positioning, obstacle-detection sensors, and machine-learning control models — applied to different vehicles: haul trucks and drill rigs in mining, tractors and harvesters in agriculture. The global autonomous farm equipment market was valued at $23 billion in 2026 per Research and Markets and Grand View Research, with North America holding 39% of global autonomous tractor installations per Persistence Market Research.
4. What share of US irrigated acreage uses drip irrigation versus sprinklers?
Per USDA NASS’s 2023 Irrigation and Water Management Survey, drip/trickle irrigation covers 5% of US irrigated acreage nationally, while pressure-sprinkler systems (center pivot, drip, and micro-flow combined) cover 72%. The survey counted 212,714 US farms irrigating 53.1 million acres total.
5. How much of a US farm’s budget goes to fertilizer?
Fertilizer represents 20-30% of total US farm production expenses for the 2026 crop year, per USDA Agricultural Marketing Service data summarized by farmdoc daily (University of Illinois) — typically the single largest controllable input line on a row-crop budget.
6. What data can Farmonaut’s platform provide?
Multi-spectral satellite imagery, crop health monitoring, soil moisture analytics, localized weather forecasts, and blockchain-based traceability, accessible via web, Android, and iOS apps, helping growers make irrigation, fertilizer, and pest-management decisions from field-level data rather than blanket assumptions.
7. Is blockchain traceability useful for small farms or only large agribusinesses?
Both. For smaller operations, it provides verifiable proof of origin that supports access to premium or export markets. For larger agribusinesses and processors, it secures the full supply chain record and speeds recall response.
8. Can I access Farmonaut’s tools from a phone in the field?
Yes — Farmonaut provides Android and iOS apps alongside the web platform and API, so field data, advisories, and monitoring are available without a desktop connection.
Where This Goes Next
The throughline across every figure in this article is that adoption and cost move together: fertilizer at 20-30% of farm expenses (USDA AMS), precision-ag adoption concentrated on large operations at 68-70% versus 27% farm-wide (USDA ERS), and autonomous equipment scaling toward a $23 billion global market with North America holding the largest regional share (Research and Markets, Persistence Market Research). None of these numbers are fixed — check the linked sources on their own release cycles (DTN weekly, USDA NASS’s irrigation survey each fall, USDA’s Census of Agriculture every five years with ARMS filling the interim years) rather than treating any figure here as permanent.
Platforms like Farmonaut lower the capital barrier to the data layer underneath these technologies — satellite-based monitoring, AI-driven advisories, and blockchain traceability — without requiring the ground-hardware investment that keeps midsize-farm adoption below large-farm adoption today.
Ready to apply satellite-based crop monitoring and fertilizer planning to your own acreage?
For organizations seeking large-scale integrations or research-ready data feeds, explore the API platform and developer documentation.

 Exurbia Geospatial
 MWS Research Centre
 FieldZero
 Indico Company
 Kubota
 FFBS
FFBS Jontra
 Kalustyan
 Tucor
Tucor Geno
Geno Hayleys Agriculture
 Linx Agritech
 Adinet
 Save Your Soils
