

Farm freight · US cost guide
Agricultural Logistics: Truck, Rail and Barge Costs
USDA’s truck cost index for grain hit 237 in the week ending 21 October 2026, against 137 a year earlier, as US diesel averaged $6.28 a gallon. Here is how US grain moves, what each mode costs now, where food is lost, and the tools that help.
Key takeaways
- In the week ending 21 October 2026, USDA AMS cost indices (2017 = 100) were 237 for truck, 129 for shuttle rail and 236 for barge, against 137, 126 and 194 a year earlier.
- US on-highway diesel averaged $6.352 a gallon on 26 October 2026, $2.634 above a year earlier (EIA).
- In 2020, trucks carried 82% of US grain sent to domestic buyers, while rail and barge carried 84% of export grain (USDA AMS modal share study).
- FAO estimates 13.3% of food was lost between harvest and retail in 2023; North America and Europe lost 10.0%, fruits and vegetables 25.4%.
- Hired semi hauling of hay and cattle averaged about US$5.50 per loaded mile in the 2026 Texas custom rates survey; the calculator shows when a longer haul beats a nearby buyer.
In this article
- What agricultural logistics covers
- How US grain moves: truck, rail and barge shares
- Agricultural logistics costs by mode right now
- Corn and soybean logistics this harvest
- Where agricultural supply chains lose money
- Technology in agricultural logistics: what each tool does
- Seven ways to cut agricultural logistics costs
- What it costs to hire a truck
- Haul farther for a better price? Run your numbers
- Best practices for farm supply chains
- How satellite crop monitoring fits in
- FAQ
- Bottom line
Agricultural logistics is the planning, moving and storing of crops, livestock and farm inputs between the field and the buyer. In the US, the cost of that work swings week to week. In the week ending 21 October 2026, USDA’s truck cost index stood at 237, against 137 a year earlier, a rise of 73% (USDA AMS Grain Transportation Report, 22 October 2026).
This guide shows what drives those costs by mode (truck, rail, barge and ocean), how US grain is split between them, where losses happen, and which tools help. It ends with a calculator that tells you whether a longer haul to a better-paying buyer is worth the extra miles.
What agricultural logistics covers
Every farm product makes the same trip in stages. It leaves the field, waits in storage, travels to a buyer, and may be processed, packed and shipped again. Agricultural logistics is the work of making each stage happen on time, at the right quality and at a known cost.
For a grain farm, the chain looks like this: combine to grain cart, cart to truck, truck to on-farm bins or a country elevator, then truck, rail or barge to a processor, feedlot, ethanol plant or export port. For a produce farm, it adds cooling, packing and refrigerated transport within hours of harvest. For livestock, it means trailers, rest stops and animal welfare rules.
The five parts below make up almost every farm supply chain. Weakness in any one of them shows up as a lower price, a rejected load or a missed delivery window.
1. Transport
Transport is the largest and most visible cost. Trucks carry farm goods over short distances and to the first buyer. Rail and barge carry bulk grain over long distances. Ocean vessels carry export grain to Asia, Europe and Latin America. Each mode has its own rate structure, and each reacts to fuel prices in a different way.
2. Storage and warehousing
Storage lets a farm hold grain until prices or freight rates improve. On-farm bins, elevator space and cold stores all carry costs: drying, aeration, insurance, shrink and the interest on money tied up in stored crop. Perishables need controlled temperature and humidity. A cold store that fails for a few hours can cost a whole lot of fruit.
3. Inventory control
Inventory control means knowing how much product sits where, in what condition, and when it must move. For a grain farm, this is a bin-by-bin record of bushels, moisture and contract commitments. For a packer, it means first-in, first-out rules and shelf-life tracking.
4. Packaging and handling
Packaging protects goods in transit. Produce cartons, bulk bags, totes and modified-atmosphere packs all aim to slow spoilage and stop bruising. Good handling at each transfer point matters as much as the packaging itself.
5. Information and records
Records tie the other four parts together. Scale tickets, bills of lading, grading certificates, temperature logs and traceability records let buyers, carriers and regulators check what moved, when and in what state. Digital records also make recalls faster when a quality problem appears.
How US grain moves: truck, rail and barge shares
USDA’s Agricultural Marketing Service (AMS) measures how corn, wheat, soybeans, sorghum and barley reach their final market. Its latest modal share study covers 2020, when about 588 million tons of these grains moved (USDA AMS, Transportation of U.S. Grains: A Modal Share Analysis, 1978-2020 update).
| Market | Truck | Rail | Barge |
|---|---|---|---|
| Domestic markets | 82% | 17% | 1% |
| Export ports | 16% | 38% | 46% |
| All movements | 64% | 23% | 13% |
Of the 588 million tons, about 426 million went to domestic buyers and about 162 million to ports for export. Trucks carried 82% of the domestic tonnage: short hauls to elevators, feedlots, ethanol plants and processors. Barges and rail carried 84% of export grain, mostly down the Mississippi system to the Gulf and by rail to the Pacific Northwest.
This split explains why diesel prices matter most for domestic sales, and why barge rates on the Mississippi and Illinois rivers matter so much for export basis. A farmer near the river sells into a market shaped by barge freight. A farmer on the northern Plains sells into a market shaped by rail. A farmer near an ethanol plant sells into a market shaped by trucking.
Chart
How US export grain reached the port
Share of grain tonnage moved to export ports by mode, 2020
Agricultural logistics costs by mode right now
AMS publishes weekly cost indicators for each mode. Each index is set to 100 at the 2017 average. The truck index follows the US average diesel price; the rail index follows near-month secondary railcar values plus tariff rates with fuel surcharges on selected shuttle-train routes; the barge index follows the Illinois River rate as a percent of tariff; the ocean indices follow rates to Japan from the US Gulf and the Pacific Northwest (USDA AMS, Table 1, 22 October 2026).
Chart
Cost index by mode, a year apart
AMS cost indicators, 2017 = 100: week ending 22 Oct 2025 vs week ending 21 Oct 2026
| Mode | Week to 22 Oct 2025 | Week to 21 Oct 2026 | Change |
|---|---|---|---|
| Truck | 137 | 237 | +73% |
| Rail (shuttle) | 126 | 129 | +2% |
| Barge | 194 | 236 | +22% |
| Ocean, Gulf | 145 | 195 | +34% |
| Ocean, Pacific NW | 141 | 178 | +26% |
Truck costs have risen the most because diesel has. The US average on-highway diesel price was $6.352 a gallon on 26 October 2026, up $2.634 from a year earlier, according to the US Energy Information Administration (EIA). The 2017 base for the truck index was $2.65 a gallon, so the index of 237 means diesel cost well over twice the base level.
Rail has moved the least on the index, but rail rates still rose. The October report notes that Class I railroad fuel surcharges averaged $0.61 per mile in July, a record for the series, and that November’s surcharge is set to pass that record because it follows September’s diesel average of $6.291 a gallon (USDA AMS, 22 October 2026). Shuttle secondary railcar bids for October were $125 above tariff in mid-October, $550 lower than a year earlier, which held the rail index down.
Barge rates peaked in September. The barge index reached 274 in the week ending 23 September 2026, against 213 a year before (USDA AMS, 24 September 2026), then eased to 236 by late October. The St. Louis downbound spot rate was $26.87 per ton in the week ending 13 October, 34% above a year earlier.
How the indices moved through the year
The five snapshots below come from AMS weekly reports in January, April, June, September and October 2026 (January, April, June). Truck costs rose from 133 in January to 246 in September. Barge costs dipped in early summer and jumped at harvest. Rail stayed in a narrow band between 122 and 134.
The lesson for anyone pricing a sale: a rate you saw in June is not the rate you will pay at harvest. Check the latest weekly AMS report, or ask your carrier for a quote, before you sign a delivered contract.
Diesel prices by region
Diesel prices differ a lot across the country, so the same haul costs more in some states than others. On 26 October 2026, EIA’s regional averages ranged from $5.951 a gallon on the Gulf Coast to $8.155 in California. The Midwest, where most US corn and soybeans are grown, averaged $6.480.
Chart
US grain transport cost indices through 2026
Weekly AMS cost indicators, 2017 average = 100, five snapshot weeks
Chart
On-highway diesel price by US region
US$ per gallon, retail including taxes, 26 October 2026
Corn and soybean logistics this harvest
Large row-crop harvests test every part of the chain at once. Several points from the October AMS report matter for corn and soybean sellers.
- Rail volumes are high. Class I railroads originated 382,846 grain carloads in the third quarter of 2026, 32% above the third-quarter average. AMS expects lower rail carloads in 2027 because the 2026 corn crop is smaller than the 2025 crop.
- Rail service has slowed. In the week ending 2 October, BNSF Railway delayed an average of 11 grain unit trains per day, its highest weekly total since April 2025, after derailments and severe weather.
- Ocean routes are longer. Because of congestion and transit limits at the Panama Canal, Gulf soybean cargoes to China are sailing around the southern tip of Africa, which adds distance and time. Pacific Northwest soybean inspections for China passed Gulf shipments in mid-October.
- Storage is full in places. The report notes high on-farm and off-farm stocks entering harvest, which can widen basis where elevator space is short.
- Rail lines are getting upgrades. The Federal Railroad Administration awarded more than $400 million in CRISI grants to short line railroads that handle grain, including about $100 million to rebuild track for 286,000-pound railcars.
Source for all five points: USDA AMS Grain Transportation Report, 22 October 2026.
For a corn grower, the practical upshot is simple. Freight costs are high, rail space is tight on some lines, and export routes are longer. That pushes local basis lower in areas far from end users. It also makes on-farm storage and well-timed sales worth more this season.
Where agricultural supply chains lose money
Some losses are physical: product that spoils, spills or gets downgraded. Others are financial: a weaker price because freight is high or storage is full. Both add up.
Food lost between farm and shop
The UN Food and Agriculture Organization (FAO) estimates that 13.3% of food was lost after harvest in 2023, on farms and in transport, storage, wholesale and processing, up from 13.0% in 2015 (FAO, SDG indicator 12.3.1). North America and Europe report the lowest regional loss, at 10.0%. Fruits and vegetables lose the most, at 25.4%, because they spoil fast and bruise easily. Cereals and pulses lose 8.4%.
Waste further down the chain adds to this. The UN Environment Programme’s Food Waste Index Report 2024 found that 1.05 billion tonnes of food went to waste in 2022, about one fifth of the food available to consumers (UN News, March 2024).
Perishability
Fresh produce, dairy and meat start losing value from the moment of harvest or slaughter. Fast cooling, short transit times and steady temperature control are the main ways to slow that. Every extra day in transit raises the chance of a rejected load.
Seasonal peaks
Harvest creates a short, sharp surge in demand for trucks, drivers, railcars, barges and elevator space. The same equipment may sit idle a few months later. That is why AMS rates jump in autumn and ease in early summer, as the 2026 figures above show.
Infrastructure limits
Rural road weight limits, bridge closures, elevator dump speed, railcar supply and river lock capacity all cap how fast product can move. Low water on the Mississippi can force barge operators to load lighter, which raises the cost per ton. A single farm cannot fix these limits, but it can plan around them with storage and with buyers in more than one direction.
Fuel and price swings
Fuel sits inside every freight rate. When diesel rises, truck rates rise within weeks, and rail fuel surcharges follow about two months later. A delivered price that looked strong in spring can look weak at harvest if the freight under it has doubled.
Food safety and paperwork
Carriers and shippers must meet food safety, grading, animal welfare and trade rules. In the US, the FDA’s food traceability rule and sanitary transport rule apply to many foods; in Canada, the UK, the EU and Australia, similar rules exist. Rules differ by product and country, so check the rules that apply to your product with your buyer, your carrier and the local regulator.
Technology in agricultural logistics: what each tool does
Technology does not change the cost of diesel, but it can cut wasted miles, spoiled loads and idle time. The table below sets out the job each tool does and where it fits.
| Tool | What it does | Where it helps |
|---|---|---|
| Sensors (IoT) | Logs temperature, humidity, shock and location | Cold chain, grain bins, reefer trucks |
| GPS fleet tracking | Shows where each truck is and how long it waits | Harvest hauling, dispatch, driver hours |
| Route planning software | Picks routes and load order from distance, weight limits and traffic | Multi-stop delivery, input supply |
| Demand forecasting | Estimates volume and timing from crop and market data | Elevator space, truck booking |
| Traceability records | Keeps a shared record of each lot from field to buyer | Recalls, export papers, buyer audits |
| Satellite crop maps | Shows crop condition by field before harvest | Harvest order, yield estimates, storage plans |
| Mobile apps | Links growers, carriers and buyers | Booking, tickets, payment records |
No national survey publishes how many US farms use each tool for logistics. If you need an adoption figure, the USDA National Agricultural Statistics Service’s Quick Stats database holds the farm computer usage surveys, which cover internet and precision technology use.
Seven ways to cut agricultural logistics costs
These are practical changes a farm or a small agribusiness can make this season. Each one aims at a cost or loss described above.
1. Monitor perishable loads with sensors
Temperature loggers in reefer trucks, cold rooms and pallets record conditions through the whole trip. Live sensors send an alert when a reading drifts, so a driver or store manager can act before the load spoils. The record also settles disputes with buyers over who was at fault for a warm load.
Best for: fruit, vegetable, dairy and meat shippers.
2. Plan routes and load timing
Route planning software weighs distance, road limits, traffic and dump-line waits. On a grain farm, the bigger gain is often in timing: running trucks when the elevator line is short, or hauling to a second buyer when the first is backed up. With diesel above $6 a gallon in October 2026, each empty or idle mile costs more than it did a year ago.
Best for: farms with several trucks, or more than one delivery point.
3. Keep a clean digital record for each lot
A traceability record links each lot to its field, harvest date, storage bin, grade and buyer. This speeds up export papers and recalls, and it helps when buyers ask for proof of origin or growing practice. Some systems use a shared ledger (often called blockchain) so that every party sees the same record. A simple, well-kept database can do much of the same job on a single farm.
Best for: exporters, organic and specialty-crop growers, and anyone selling into retailer programmes.
4. Track the fleet
GPS tracking shows where each truck is, how long it waits at each stop, and how much fuel it burns. At harvest, that lets a manager move trucks from a slow combine to a fast one, or from a long dump line to a shorter one. Keeping trucks and harvest gear in good order cuts breakdowns at the worst time; our guide to used harvesting equipment covers what to check before buying.
Best for: farms and custom harvesters running three or more trucks.
5. Use apps to book carriers and record tickets
Load-board and booking apps connect growers with carriers and show offers in one place. Scale ticket apps send weights and grades straight to the farm office. That cuts lost tickets and speeds up payment.
Best for: farms that hire trucks rather than own them.
6. Plan harvest and storage from crop data
Knowing which fields will be ready first, and roughly how much each will yield, lets you book trucks and storage before the rush. Satellite crop maps show which fields are drying down or under stress. Yield monitor data from past seasons gives a starting estimate of volume. Together they help decide what goes to the bin and what goes straight to town.
Best for: grain farms with more fields than they can walk in a week.
7. Measure the emissions from transport
Some buyers and lenders now ask for the carbon footprint of farm products, including transport. Fuel records from trucks, plus distance and tonnage by mode, give a first estimate. Rail and barge burn less fuel per ton-mile than trucks, so mode choice affects the footprint as well as the cost.
Best for: farms selling into supply chains with emissions targets.

▶ How satellite NDVI maps show crop stress across a large corn farm before it is visible from the ground. · 4:09
What it costs to hire a truck
Custom rate surveys give a guide to hired hauling. The 2026 Texas Agricultural Custom Rates survey from Texas A&M AgriLife Extension put the average for flat-rate hay hauling by semi-trailer at $5.57 per loaded mile, with a most common rate of $5.00, and cattle hauling by semi-truck and trailer at $5.51 per loaded mile (Texas A&M AgriLife Extension, 2026). These are survey averages of rates farmers reported paying or charging, not quotes. Rates were collected before the autumn diesel rise.
In Canada, Manitoba Agriculture’s 2026-27 cost guide estimates hauling grain from field to yard at $0.37 per bushel for the first 3 miles plus $0.03 per bushel for each extra mile, in Canadian dollars (Manitoba Agriculture, 2026-27 guide). The guide warns that these averages may not fit every case and should be used as a guideline only.
For fresh produce, fuel is a large part of the cost. USDA’s Economic Research Service studied how fuel prices passed through to wholesale fruit and vegetable prices using 2000-2009 data (USDA ERS, ERR-160, 2013), and found that the effect depends on the route and the mode of transport.
Haul farther for a better price? Run your numbers
A common harvest choice is between a nearby elevator and a buyer farther away who pays more per bushel. The extra price only helps if it beats the extra freight. The calculator below compares the two. Enter your own distances, truck rate and price gap.
The default numbers are examples only, set close to break-even so you can see how small changes swing the answer. Use a current quote from your carrier, or your own cost per loaded mile, instead of the example rate.
Try the numbers for your own farm below.
Calculator
Is the farther buyer worth the extra miles?
Compare a nearby buyer with one farther away that pays more per bushel.
- Extra freight per bushel: 0.20 US$/bu
- Net gain per bushel: -0.02 US$/bu
- Truckloads needed: 20 loads
- Break-even price gap: 0.20 US$/bu
Example values only, set near break-even; they are not benchmarks or quotes. The truck rate is per loaded mile (example, use today’s price): survey averages were US$5.57 for semi hay hauling and US$5.51 for cattle hauling in the 2026 Texas Agricultural Custom Rates survey, collected before the autumn diesel rise. The formula charges the extra one-way distance per load at your loaded-mile rate, as the Texas survey rates are quoted; if you pay for both directions, double the rate. It leaves out wait time, shrink, drying, grading and any elevator fees.
Best practices for farm supply chains
Tools help, but habits decide most of the result. These practices apply to farms of any size.
- Plan with buyers and carriers early. Share harvest dates and expected volume before the rush, so trucks and dump slots are booked.
- Keep more than one outlet. A second elevator, a processor or an ethanol plant gives you a choice when one line is long or one basis is weak.
- Check freight weekly at harvest. AMS publishes its Grain Transportation Report every Thursday, with datasets you can download. Rates move fast in autumn.
- Price the haul, not just the bushel. Compare buyers on the net price at your farm gate: offer price minus freight minus any shrink or drying charges.
- Store with a plan. Storage pays only if the expected price gain beats the cost of drying, aeration, interest and shrink.
- Keep trucks and bins in shape. A breakdown in the middle of harvest costs far more than routine service.
- Watch the weather. Low river levels, storms and early snow all slow freight. Build slack into delivery dates when forecasts look poor.

▶ Six plain steps to start precision farming, from field maps to satellite monitoring. · 4:18
How satellite crop monitoring fits in
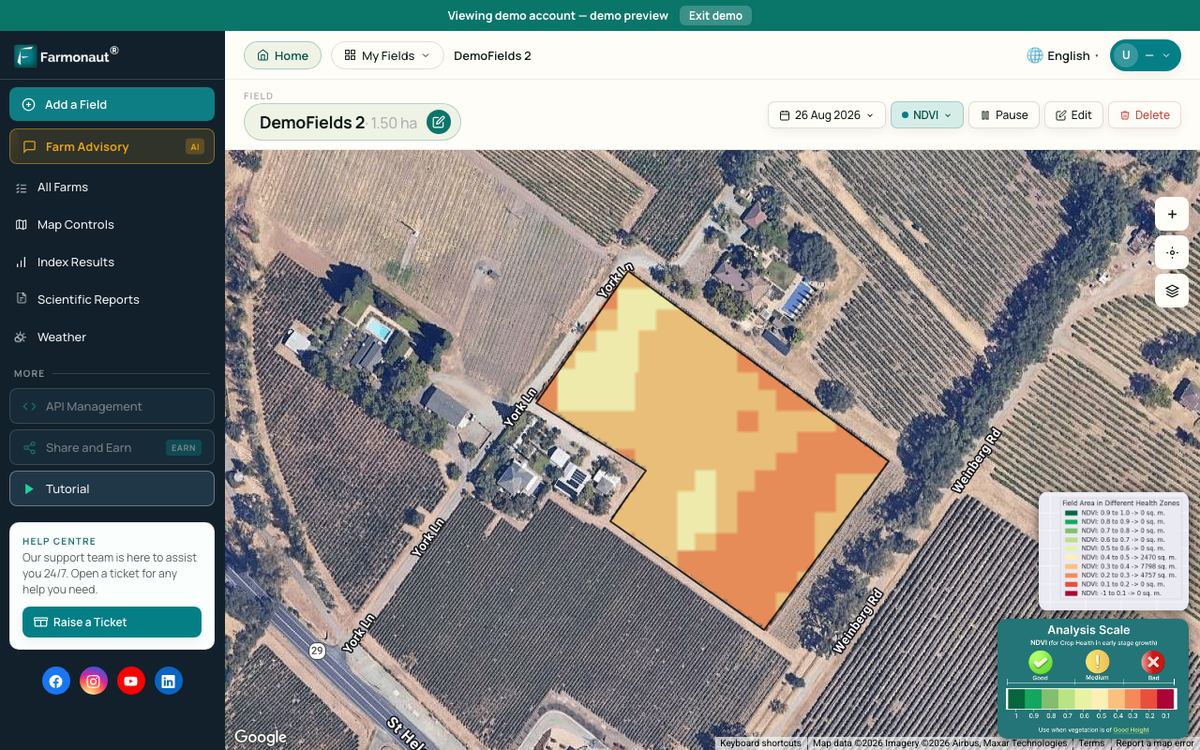
Logistics planning starts with knowing what is in the field. The Farmonaut Satellite + AI Farm Monitoring System gives field-by-field crop health maps from satellite images through the season, on the web, Android or iOS app. Growers and farm managers can use those maps to see which fields are ready first, spot stressed areas that may yield less, and plan harvest order, trucks and storage around that. Data can also be pulled into other farm software through the API, with set-up steps in the developer documentation.
Related pages on our site: fleet management, product traceability, carbon footprinting, large-scale farm management, crop loan and insurance verification, mining claims in Alaska, corn yield by state, farm tool maintenance.

▶ A walk-through of the web app: draw a field and view satellite crop health maps for it. · 8:43
FAQ
What is agricultural logistics?
It is the planning, moving and storing of farm products and inputs between the field and the buyer. It covers transport, storage, inventory, packaging and records. In the US, trucks carried 64% of all grain tonnage in 2020, rail 23% and barge 13% (USDA AMS).
How much does agricultural haulage cost right now?
USDA AMS cost indices (2017 = 100) for the week ending 21 October 2026 were 237 for truck, 129 for shuttle rail and 236 for barge. US diesel averaged $6.352 a gallon on 26 October 2026 (EIA). For a hired semi, the 2026 Texas custom rates survey reported averages of about $5.50 per loaded mile for hay and cattle hauling. Ask carriers for a current quote before you price a sale.
Which is cheaper for grain: truck, rail or barge?
Over long distances, barge and rail cost less per ton than trucks, which is why they carried 84% of US export grain in 2020 (USDA AMS). Trucks win on short hauls and on flexibility. The best choice depends on your distance to a rail loader or river terminal, and on the week’s rates.
How much food is lost in the supply chain?
FAO estimates that 13.3% of food was lost between harvest and retail in 2023, with 10.0% in North America and Europe. Fruits and vegetables lose 25.4%, cereals and pulses 8.4%.
How can a small farm improve its logistics?
Start with records: know your bushels, grades and contracts by bin. Compare buyers on net farm-gate price after freight. Book trucks and dump slots before harvest. Use crop maps and past yield data to plan which fields to cut first.
Do I need special permits to haul farm products?
Rules depend on the product, the vehicle weight and the state, province or country. Farm vehicle exemptions, hours-of-service rules and weight limits all vary. Check with your local transport authority and your insurer before you haul for hire or cross a border.
Bottom line
Freight costs for US farm goods are high and moving fast this autumn. Truck costs rose 73% in a year, barge costs 22%, and rail just 2% on the AMS index, though rail fuel surcharges are at record levels. FAO puts food lost after harvest, in storage, transport and processing, at about 10% in North America and Europe.
The farms that come out ahead check freight each week at harvest, compare buyers on net price, keep good records and plan harvest from field data. Run your own numbers in the calculator above before your next load leaves the yard.
Farmonaut crop monitoring
Plan harvest hauling from your own field maps
Draw your fields once and Farmonaut shows satellite crop health maps for them through the season, on web, Android or iOS, so you can see which fields are ready first.



Keep reading

Sources
- USDA AMS, Grain Transportation Report, 22 October 2026: ams.usda.gov
- USDA AMS, Grain Transportation Report, 24 September 2026: ams.usda.gov
- USDA AMS, Grain Transportation Report, 25 June 2026: ams.usda.gov
- USDA AMS, Grain Transportation Report, 23 April 2026: ams.usda.gov
- USDA AMS, Grain Transportation Report, 22 January 2026: ams.usda.gov
- USDA AMS, Transportation of U.S. Grains: A Modal Share Analysis, 1978-2020 update (2023): ams.usda.gov
- USDA AMS, Grain Transportation Report datasets: ams.usda.gov
- US Energy Information Administration, Gasoline and Diesel Fuel Update (27 October 2026): eia.gov
- FAO, SDG indicator 12.3.1 Global food losses (2025 update): fao.org
- UN News, With 783 million people going hungry, a fifth of all food goes to waste (UNEP Food Waste Index 2024): news.un.org
- Texas A&M AgriLife Extension, 2026 Texas Agricultural Custom Rates survey: agecoext.tamu.edu
- Manitoba Agriculture, Farm Machinery Custom and Rental Rate Guide 2026-27: manitoba.ca
- USDA ERS, How Transportation Costs Affect Fresh Fruit and Vegetable Prices, ERR-160 (2013): ers.usda.gov
- USDA NASS, Quick Stats database: quickstats.nass.usda.gov
Discussion
Questions, corrections or field experience? Share them below. First-time comments are reviewed before they appear, and your email is never published.
No comments yet. Be the first to add a question or your experience.

 Agroes
 Etech Consulting Madagascar
 Vestlandsforsking
 Elders
 Agritein
 Delicio
 WB Dev
 Sama Premium
 Prochecker
 Tres Valles
 LACOS Geoinformation
 Magrifly
 LatConnect 60
 WebsEdge
 Blickwinkel
 Agricultural Credit Policy Council
 Marei Nursery
 eKGIS
 Mostas Tech
 Andex

 Exploration consultancy · South Africa · Gold
 Licence holder · Niger · Gold
 Licence holder · Nigeria · Gold + lithium










