

Reviewed September 2026 against USDA Economic Research Service, USDA NIFA, and Mordor Intelligence.
Try it: Run your own numbers →
Agrigenomics is the application of genome sequencing, genetic markers, and DNA-based selection to breed crops and livestock faster and more precisely than conventional crossbreeding allows. In practical terms, it is already the default in US row-crop agriculture: 96% of US soybean acres and 92% of corn acres planted to herbicide-tolerant seed in 2025 trace back to genomic trait development, according to USDA’s Economic Research Service. This article covers what agrigenomics means, what application of genomics in agriculture actually looks like on a US farm, what the agrigenomics market is worth, and how to verify every figure yourself as the data refreshes.
Table of Contents
- What Is Agrigenomics? A Working Definition
- Genomics Explained: The Vocabulary You Need
- The Agrigenomics Market: Size, Growth, and Who’s Counting
- Application of Genomics in US Agriculture: The Adoption Numbers
- Comparison Table: Agrigenomics Technologies and Applications
- Climate-Resilient Crops: Genomics vs. Abiotic Stress
- Disease Resistance and Genomic Pathogen Tracking
- Genomics in Livestock Breeding
- Precision Farming: Where Genomics Meets Satellite Data
- Calculator: Estimate Your Farm’s GE Trait Exposure
- Where Farmonaut Fits: Verifying Genomic Investment in the Field
- What’s Not Yet Published: Honest Gaps in the Data
- FAQ: Agrigenomics and Genomics in Agriculture
- Conclusion: A Continuing Story, Not a Snapshot
- Try it: Run your own numbers
What Is Agrigenomics? A Working Definition
Agrigenomics — also searched as agricultural genomics — is the study and application of genomic technologies (DNA sequencing, genetic markers, gene editing, genomic selection) to crops, livestock, and the microorganisms that interact with them. It replaces slow observational breeding with direct reading of the genetic code, letting breeders select for traits like drought tolerance or disease resistance years before those traits would show up in a field trial.
The distinction that matters for US growers specifically: agrigenomics is not a future technology. USDA ERS’s most recent tracking (published December 2025) shows genetically engineered (GE) trait adoption in the three major US row crops has been at or near saturation for several years, which is exactly why the growth story in Mordor Intelligence’s agrigenomics market analysis is shifting from “will farmers adopt this” to “how fast does sequencing and data infrastructure scale next.”
Genomics Explained: The Vocabulary You Need
Before going further, a few terms answer the “genomics explained” and “what is genomics” searches directly. Genomics is the study of an organism’s complete set of DNA (its genome) rather than one gene at a time. In agriculture, that whole-genome view is what separates modern breeding from the single-gene approach of the 20th century.
- Genome: The complete set of DNA in an organism. The USDA National Plant Germplasm System currently holds more than 574,000 plant accessions — seed and tissue samples representing genetic diversity that breeders draw on for trait sources, per the USDA Agricultural Research Service.
- Genetic marker: A DNA sequence statistically linked to a trait of interest, such as drought tolerance or disease resistance.
- Genomic selection: Predicting an organism’s breeding value from its whole-genome profile rather than a handful of markers, used heavily in dairy cattle and increasingly in row crops.
- Marker-assisted selection (MAS): An older, narrower technique that screens for a small number of known markers rather than the whole genome.
- Phenotyping: Measuring observable traits (yield, height, disease symptoms) to validate what the genomic data predicts.
- Gene editing (e.g., CRISPR): Directly adding, removing, or altering specific DNA sequences rather than selecting among existing genetic variation.
- Bioinformatics: The computational infrastructure — software, databases, pipelines — that turns raw sequencing output into usable breeding decisions.
A note on genetic gain: some published material claims genomic selection raises crop breeding efficiency by a fixed percentage. That specific figure was not verifiable against a current, citable study for this article, so it has been removed rather than repeated. What USDA and peer-reviewed literature do confirm is a qualitative trend — genomic selection increases the *rate* of genetic gain per breeding cycle compared to phenotype-only selection — without a single agreed number across crops and institutions. If you need a number for a specific crop and breeding program, ask the breeding company or land-grant university running it for their own trial data; the figure varies too much by crop and trait to generalize.
The Agrigenomics Market: Size, Growth, and Who’s Counting
Market-size estimates for agrigenomics come from commercial research firms, not government agencies — USDA does not publish a market valuation for this category, so the numbers below are industry estimates, not federal statistics.
| Source | Current Size | Projected Size | Projection Year | CAGR |
|---|---|---|---|---|
| Mordor Intelligence | $5.49 billion (2026) | $8.74 billion | 2031 | 9.76% |
| Verified Market Reports | $12.5 billion (2025) | $25.1 billion | 2034 | 8.6% |
The two firms disagree by more than double on absolute market size — a reminder that “agrigenomics market” and “agriculture genomics market” are scoped differently between research houses (some include diagnostics and animal genomics, others don’t). Both agree on the direction: high single-digit to high-single-digit-plus annual growth through the early 2030s. If you need a number for a specific report, board deck, or investment memo, pull the underlying methodology section from the vendor report directly rather than citing the headline figure alone, since scope definitions change between editions.
On the funding side, public money is measurable and traceable: the USDA National Institute of Food and Agriculture’s Agricultural Genome to Phenome Initiative announced $1.827 million in new funding in 2026, and a separate $220 million USDA investment in shared genomics data platforms and phenotyping facilities is documented through USDA’s AG2PI program. Check USDA NIFA’s Agricultural Genome to Phenome Initiative page directly for the current fiscal year’s call for proposals and final appropriation, since this is refiled annually and the number above is specific to the 2026 announcement.
Application of Genomics in US Agriculture: The Adoption Numbers
This is the section that answers “application of genomics in agriculture” directly, with the most current verifiable figures. USDA ERS’s GE crop adoption tracking, updated December 2025, is the authoritative US source and it is refiled annually — bookmark it rather than this article if you need next year’s figure.
- Soybeans: 96% of US soybean acres planted to genetically engineered varieties in 2025.
- Corn: 92% of acres to herbicide-tolerant seed, 84% to stacked-trait seed (herbicide tolerance plus insect resistance combined) in 2025.
- Upland cotton: 93% of acres to GE herbicide-tolerant varieties, 87% to stacked traits in 2025.
Read the gap between the herbicide-tolerant and stacked-trait percentages carefully — it is not noise. The difference (92% vs. 84% in corn, 93% vs. 87% in cotton) is the share of acres still planted to single-trait seed rather than combined traits, which matters if you’re modeling input costs or resistance-management risk for a specific operation.
Adjacent to genomics itself, USDA ERS also tracks the precision-agriculture hardware that increasingly rides alongside genomic seed decisions: autosteering system adoption reached 52% on midsize US crop farms and 70% on large-scale crop farms in 2023, the most recent year in that ERS chart series. That is a hardware-adoption statistic, not a genomics one, but it is the clearest available proxy for how fast US operations are digitizing field management generally — relevant context if you’re assessing how ready a given farm is to layer genomic-informed variable-rate decisions on top of what it already runs.
Comparison Table: Agrigenomics Technologies and Applications
| Genomic Technology | Description | Primary US Application | Example Crops/Animals |
|---|---|---|---|
| CRISPR Gene Editing | Precision editing to insert, delete, or enhance specific genes | Disease resistance, herbicide tolerance, quality traits | Corn, soybean, wheat |
| Marker-Assisted Selection (MAS) | Selection guided by a defined set of genetic markers linked to a trait | Breeding for defined single/few-gene traits | Cotton, tomato, potato |
| Whole Genome Sequencing (WGS) | Full DNA sequencing of an organism’s genome | Trait discovery, germplasm characterization | Barley, poultry, dairy cattle |
| Genomic Selection (GS) | Predicts breeding value from whole-genome profile | Rapid genetic gain for complex, multi-gene traits | Maize, beef cattle, dairy cows |
| Transcriptomics & Proteomics | Studies gene expression and protein activity under stress | Understanding abiotic stress response mechanisms | Soybean, canola, legumes |
| Bioinformatics & Data Platforms | Computational storage and analysis of genomic datasets | Shared research infrastructure (e.g., USDA AG2PI) | Cross-commodity |
Climate-Resilient Crops: Genomics vs. Abiotic Stress
Agrigenomics’ most cited application is breeding crops that tolerate abiotic stress — drought, heat, and soil salinity — conditions that are becoming more frequent across the US Corn Belt and Great Plains. Genomic tools identify the genes controlling root architecture, water-use efficiency, and osmotic regulation, letting breeders select for these traits directly from a DNA sample rather than waiting years for a drought year to expose which lines survive.

What is genuinely not published, and worth saying plainly rather than estimating: a measurable, crop-specific yield-lift percentage attributable to genomic selection alone (isolated from agronomic practice, weather, and other breeding inputs) was not found in accessible peer-reviewed literature for this article. The NCBI editorial on genome-wide association studies and genomic selection for crop improvement discusses “increased rate of genetic improvement” qualitatively but stops short of a single cross-crop percentage — and any article that gives you one specific number here without naming the crop, the trial, and the baseline is not citing a real study. If you need this for a specific crop and region, the right method is to contact your state’s land-grant extension breeding program directly and ask for their own multi-year trial data, since genetic gain is measured per breeding cycle and varies by crop, trait, and starting germplasm.
For crops that stack multiple stress-tolerance traits simultaneously — sometimes called “stacked” abiotic stress traits — the genomic case is about hedging against unpredictable weather rather than guaranteeing a fixed yield outcome. Tracking your own field’s actual stress exposure over a season is the practical complement to whatever seed-trait decision you make; see the precision farming section below for how satellite monitoring does that.
Disease Resistance and Genomic Pathogen Tracking
Plant and animal diseases erode yield and income, historically forcing growers toward chemical treatments. Genomic surveillance — sequencing the DNA of fungal, bacterial, and viral pathogens as they evolve — lets breeders and regulators identify resistance genes and track how fast a pathogen is mutating around existing resistance.

USDA-backed breeding programs have released disease-resistant genotypes using this approach — soybean line “JTN 5503,” bred for soybean cyst nematode resistance, is one documented USDA example. What is not published is a percentage figure for disease-loss reduction achieved specifically through genomic breeding versus other resistance-breeding methods; USDA research describes resistant genotypes by name rather than quantifying loss avoidance in aggregate. Treat any “X% disease loss reduction” claim you see elsewhere on this topic with the same skepticism until it names its source study.
For real-time, on-farm detection that complements genomic resistance breeding — spotting disease symptoms in the field before they spread — Farmonaut’s large-scale farm management tools provide satellite-based crop health alerts that flag stress zones for a ground check.

Genomics in Livestock Breeding
Genomic selection is more mature in US livestock breeding than in row crops, particularly in dairy cattle, where whole-genome profiling to predict breeding value has been standard practice for over a decade. Breeders select for feed efficiency, disease resistance (such as mastitis resistance in dairy cows), growth rate, and reproductive performance directly from a genomic test rather than waiting for progeny performance data.
- Shorter generation intervals: Genomic selection lets breeders select replacement animals before they’ve produced offspring, accelerating genetic gain per year.
- Disease-resistant breeding: Selecting for immunity reduces both losses and antibiotic use.
- Feed efficiency: Animals bred for better feed conversion produce more output per unit of input — relevant as feed remains the largest variable cost in most livestock operations.
A specific US adoption-rate figure for genomic selection tools among commercial livestock breeders (as distinct from GE crop trait adoption) was not available in a form clean enough to cite here — USDA and GAO track precision agriculture and GE crop adoption as separate categories from genomic breeding-tool usage, and no unified statistic bridges them. If this number matters for your operation or analysis, breed associations (e.g., the national Holstein or Angus associations) publish their own genomic-testing adoption data and are the correct primary source.
For operations managing livestock across large or dispersed ranges, Farmonaut’s fleet and resource management tools apply satellite tracking to the logistics side of that operation.
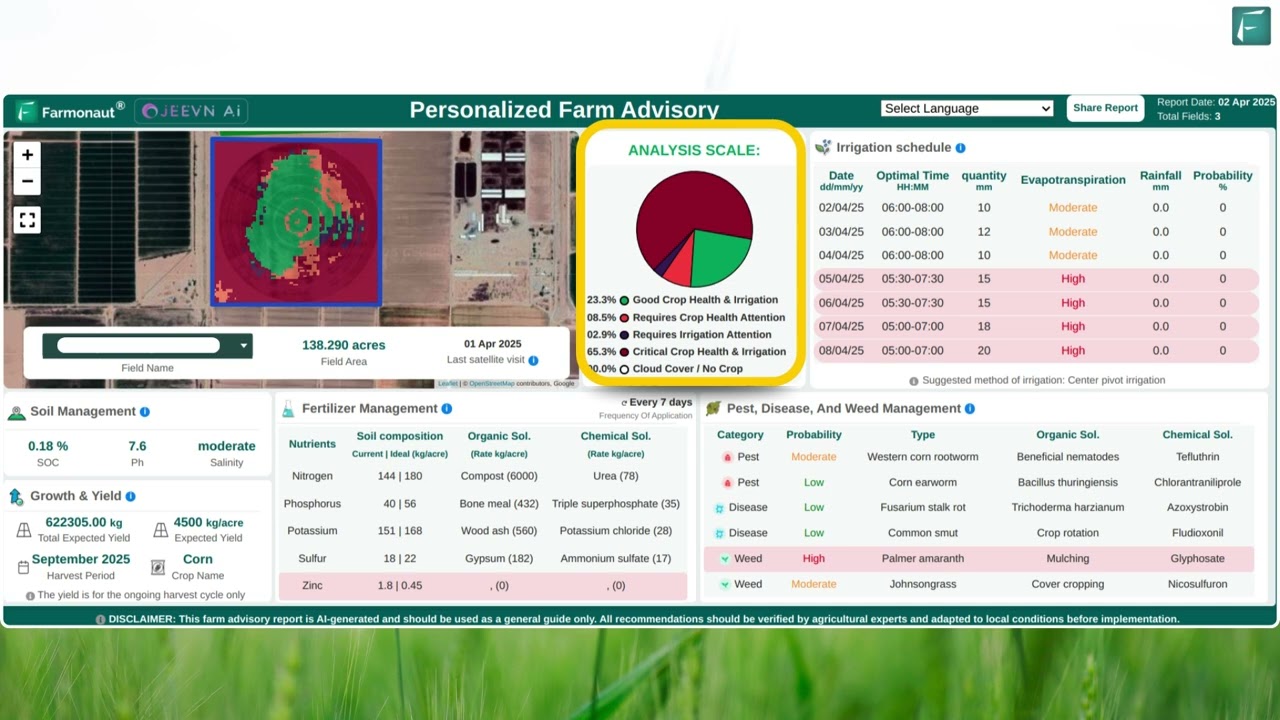
Precision Farming: Where Genomics Meets Satellite Data
A genomically improved seed only delivers its designed trait if field conditions are actually monitored closely enough to catch the stress events the trait is supposed to handle. This is the link between agrigenomics and precision agriculture: satellite imagery, drone data, and AI analytics verify — field by field — whether a drought-tolerant or disease-resistant variety is performing as its genomics predicted.

USDA ERS’s 2023 data on autosteering adoption (52% of midsize, 70% of large-scale US crop farms) is a useful proxy here: it shows the hardware layer for precision management is already widespread on the farms most likely to be planting the highest-value genomic seed. Combining that hardware with genomic seed choice and satellite monitoring is what turns a lab-bred trait into a field-verified outcome.
For real-time crop condition monitoring, Farmonaut’s Satellite Crop Monitoring App tracks multispectral imagery against field-level stress indicators. Full traceability from seed to harvest is available through Farmonaut’s blockchain-based traceability platform, and developers building this into their own systems can use the Farmonaut API alongside the API developer documentation.


Calculator: Estimate Your Farm’s GE Trait Exposure
Use your own acreage and crop mix against USDA ERS’s 2025 adoption rates to estimate how many of your acres are already planted to genomically developed traits, and how that compares to the national average.
Run your own numbers
Assumptions: applies USDA ERS's 2025 national adoption percentages uniformly to your entered acreage; it does not account for regional adoption differences, seed availability, or your specific rotation. It excludes wheat, rice, and other crops not tracked in USDA's GE adoption series. Recheck the USDA ERS GE adoption data annually, since these rates are refiled each year.
Where Farmonaut Fits: Verifying Genomic Investment in the Field
Farmonaut doesn't produce genomic seed or breeding data — it provides the satellite monitoring layer that verifies whether the genomic traits you've already paid for are performing under your specific field's stress conditions during the season. Multispectral imagery tracks crop health, soil moisture proxies, and stress indicators at the field level, which is the practical way to know whether a drought-tolerant variety is earning its premium this season rather than waiting until harvest to find out.

Environmental impact tracking, including carbon footprint monitoring, is relevant to genomically improved crops specifically because many of the resource-efficiency claims made for those varieties (less water, less fertilizer) are only verifiable with season-long field data, not at the point of seed purchase. For growers and lenders needing documentation for financing, satellite-based verification for crop loans and insurance applies the same monitoring data to reduce fraud and speed claims processing.
What's Not Yet Published: Honest Gaps in the Data
Several figures commonly asked about in this space are not currently available from a citable US source, and it is more useful to say so than to guess:
- Cost per genome sequenced for agronomic use: Older figures (around $10–50 per sample, circa 2020) are outdated and sequencing costs have continued to fall, but no current $/sample figure specific to agricultural applications was available for this article. Contact a sequencing service provider (e.g., a land-grant university genomics core facility) directly for current agronomic sequencing quotes.
- Yield improvement attributable to genomic selection alone, by crop: Not published as a clean, isolated percentage; genetic gain studies exist but are crop- and trial-specific. Ask your seed company or extension breeding program for their own multi-year trial data.
- Unified US farmer adoption rate for genomic breeding/selection tools (distinct from GE trait adoption): Not tracked as a single statistic by USDA or GAO. Breed associations and seed companies are the correct primary sources for their own product lines.
- Disease-loss reduction percentage from genomic breeding specifically: USDA documents named resistant genotypes (e.g., soybean line JTN 5503) but does not publish an aggregate loss-avoidance percentage.
- International adoption benchmarks (EU, Canada, Australia): Not covered in this article's research; Eurostat, Statistics Canada, and ABARES are the correct primary sources if you need those figures specifically.
FAQ: Agrigenomics and Genomics in Agriculture
-
What is agrigenomics?
Agrigenomics is the application of genome sequencing, genetic markers, and DNA-based selection to improve crops and livestock — identifying and selecting for traits like disease resistance or drought tolerance directly from genetic data rather than through years of observational crossbreeding.
-
What is genomics, in plain terms?
Genomics is the study of an organism's entire genome — its complete set of DNA — rather than examining one gene in isolation. It lets researchers see how genes interact across the whole genetic code, which is the foundation for genomic selection and gene editing.
-
How big is the agrigenomics market?
Estimates vary by research firm because of differing scope definitions. Mordor Intelligence estimates the global agrigenomics market at $5.49 billion in 2026, growing to $8.74 billion by 2031 (9.76% CAGR). Verified Market Reports estimates the broader agriculture genomics market at $12.5 billion in 2025, growing to $25.1 billion by 2034 (8.6% CAGR).
-
What is the application of genomics in agriculture today?
The clearest, most measurable application is genetically engineered seed trait adoption: 96% of US soybean acres, 92% of corn acres (herbicide tolerance), and 93% of upland cotton acres used GE varieties in 2025, per USDA ERS. Beyond seed traits, genomics is used in pathogen surveillance, livestock genomic selection, and biofortification research.
-
How is agricultural genomics different from traditional breeding?
Traditional breeding selects based on observed performance across generations — slow and imprecise. Agricultural genomics reads the DNA directly, identifying which individuals carry a desired trait before it's even expressed, cutting years off the selection process.
-
Does genomics reduce pesticide and fertilizer use?
Disease- and stress-resistant genomic varieties can reduce the need for certain chemical inputs, and precision agriculture layered on top (satellite and sensor-guided input timing) further reduces waste. A specific aggregate US percentage for input reduction attributable to genomics alone was not available for this article — ask your seed provider for trial-specific data.
-
What role does Farmonaut play in genomic agriculture?
Farmonaut does not develop genomic seed or genetic data. It provides satellite-based crop health monitoring, AI advisory, and traceability tools that verify in-season whether a genomically bred variety is performing as expected on a specific field.
-
Where can I check the current GE adoption numbers myself?
USDA ERS's Recent Trends in GE Adoption page is updated annually and is the authoritative US source — check it directly rather than relying on any single article's snapshot.
Further reading:
Conclusion: A Continuing Story, Not a Snapshot
Agrigenomics in US row-crop agriculture is past the adoption question — GE trait saturation in corn, soybeans, and cotton has held near or above 90% for several years running, and the open questions now are about market growth, funding allocation, and which traits get stacked next. USDA ERS's adoption series and USDA NIFA's funding announcements are both refiled annually; recheck them directly for the current figures rather than treating any single year's numbers as permanent.
What doesn't expire is the verification method: whatever genomic trait is in your seed bag, satellite-based field monitoring is what confirms it's earning its premium under your actual weather and soil conditions this season. Explore Farmonaut's satellite monitoring tools to track that in the field.

 Aerospect
 Delicio
 Payagri
 WB Dev
 Sama Premium
 Prochecker
 Tres Valles
 LACOS Geoinformation
 Pulsar Supernova
 Magrifly
 LatConnect 60
 WebsEdge
 Blickwinkel
 Agricultural Credit Policy Council
 Marei Nursery
 eKGIS
eKGIS Mostas Tech
 Andex
Andex FCF India
 Unifrutti Gulf
 Deluxe Conseil
