EVI vs NDVI: Understanding Vegetation Indices for Precision Agriculture
In the ever-evolving world of precision agriculture, vegetation indices play a crucial role in monitoring crop health and optimizing farm management practices. At Farmonaut, we leverage these indices to provide farmers with valuable insights into their crops’ well-being. Two of the most commonly used vegetation indices are the Enhanced Vegetation Index (EVI) and the Normalized Difference Vegetation Index (NDVI). In this comprehensive blog post, we’ll delve deep into the world of EVI NDVI and explore the key differences in EVI vs NDVI.
Table of Contents
- Introduction to Vegetation Indices
- Understanding NDVI
- Exploring EVI
- EVI vs NDVI: A Detailed Comparison
- Applications in Precision Agriculture
- How Farmonaut Utilizes Vegetation Indices
- The Future of Vegetation Indices in Agriculture
- FAQs
1. Introduction to Vegetation Indices
Vegetation indices are quantitative measurements derived from satellite or aerial imagery that indicate the relative abundance and activity of green vegetation. These indices utilize the unique spectral signatures of plants, particularly their reflectance in the visible and near-infrared portions of the electromagnetic spectrum.
The primary purpose of vegetation indices is to provide a standardized way of measuring vegetation health and density across different landscapes and time periods. They have become invaluable tools in various fields, including agriculture, forestry, ecology, and climate science.
2. Understanding NDVI
The Normalized Difference Vegetation Index (NDVI) is one of the most widely used vegetation indices in remote sensing. It was first introduced in the 1970s and has since become a staple in vegetation monitoring.
How NDVI Works
NDVI is calculated using the following formula:
NDVI = (NIR – Red) / (NIR + Red)
Where:
- NIR = Reflectance in the Near-Infrared band
- Red = Reflectance in the Red band
NDVI values range from -1 to +1, with higher values indicating healthier and denser vegetation. Here’s a general interpretation of NDVI values:
- -1 to 0: Water, snow, ice, or barren land
- 0 to 0.2: Sparse vegetation or unhealthy plants
- 0.2 to 0.4: Moderate vegetation
- 0.4 to 0.6: Dense vegetation
- 0.6 to 1: Very dense, healthy vegetation
Advantages of NDVI
- Simple to calculate and interpret
- Widely available and standardized
- Effective for monitoring seasonal changes in vegetation
- Useful for detecting drought stress and estimating crop yields
Limitations of NDVI
- Saturation in areas with dense vegetation
- Sensitivity to atmospheric conditions and soil background
- Limited ability to differentiate between vegetation types
3. Exploring EVI
The Enhanced Vegetation Index (EVI) was developed as an improvement over NDVI to address some of its limitations. EVI is particularly useful in areas with dense canopy cover and is less sensitive to atmospheric conditions and soil background.
How EVI Works
EVI is calculated using the following formula:
EVI = G * ((NIR – Red) / (NIR + C1 * Red – C2 * Blue + L))
Where:
- NIR = Reflectance in the Near-Infrared band
- Red = Reflectance in the Red band
- Blue = Reflectance in the Blue band
- G = Gain factor (typically 2.5)
- C1 = Coefficient for atmospheric resistance (typically 6)
- C2 = Coefficient for atmospheric resistance (typically 7.5)
- L = Canopy background adjustment (typically 1)
EVI values typically range from -1 to +1, similar to NDVI. However, the interpretation of EVI values can be slightly different:
- -1 to 0: Non-vegetated areas or water
- 0 to 0.2: Bare soil or very sparse vegetation
- 0.2 to 0.4: Grasslands or sparse crops
- 0.4 to 0.6: Moderate vegetation density
- 0.6 to 1: Dense, healthy vegetation
Advantages of EVI
- Improved sensitivity in high biomass regions
- Reduced atmospheric influences
- Better separation of vegetation from soil background
- More responsive to canopy structural variations
Limitations of EVI
- More complex calculation compared to NDVI
- Requires blue band data, which may not be available in all sensors
- May be less effective in areas with sparse vegetation
4. EVI vs NDVI: A Detailed Comparison
When it comes to EVI vs NDVI, both indices have their strengths and weaknesses. Let’s compare them across various factors:
Sensitivity to Vegetation Density
NDVI: Tends to saturate in areas with high biomass, making it less effective in distinguishing between different levels of dense vegetation.
EVI: Maintains sensitivity in high biomass regions, allowing for better differentiation of vegetation density in forests and heavily vegetated agricultural areas.
Atmospheric Interference
NDVI: More susceptible to atmospheric effects, such as aerosols and water vapor, which can lead to inaccuracies in measurements.
EVI: Incorporates the blue band to correct for atmospheric influences, resulting in more accurate measurements, especially in regions with varying atmospheric conditions.
Soil Background Effects
NDVI: Can be influenced by soil background, particularly in areas with sparse vegetation cover.
EVI: Designed to minimize soil background effects, making it more reliable in areas with exposed soil or varying soil types.
Canopy Structure Sensitivity
NDVI: Less sensitive to variations in canopy structure and architecture.
EVI: More responsive to canopy structural variations, providing better insights into the complexity of vegetation cover.
Ease of Calculation and Interpretation
NDVI: Simple to calculate and widely understood, making it accessible for a broad range of users.
EVI: More complex calculation, requiring additional spectral bands and coefficients, which can be challenging for some users to implement and interpret.
Historical Data Availability
NDVI: Extensive historical datasets are available, allowing for long-term trend analysis and comparisons.
EVI: Fewer historical datasets are available compared to NDVI, potentially limiting long-term studies in some regions.
Application in Different Ecosystems
NDVI: Generally performs well across a wide range of ecosystems but may have limitations in very dense or sparse vegetation areas.
EVI: Particularly effective in tropical and subtropical regions with dense vegetation but may be less advantageous in arid or semi-arid environments.
5. Applications in Precision Agriculture
Both EVI NDVI indices have significant applications in precision agriculture. Here’s how farmers and agronomists can leverage these indices:
Crop Health Monitoring
NDVI and EVI can be used to assess crop health throughout the growing season. By analyzing time-series data, farmers can identify areas of stress or potential disease outbreaks early, allowing for timely interventions.
Yield Prediction
Vegetation indices correlate strongly with biomass and can be used to estimate crop yields. EVI, with its improved sensitivity in high-biomass areas, may provide more accurate yield predictions for certain crops.
Irrigation Management
By monitoring changes in vegetation indices, farmers can optimize irrigation schedules. Areas with lower index values may indicate water stress, prompting targeted irrigation efforts.
Fertilizer Application
Spatial variations in EVI or NDVI can guide variable-rate fertilizer applications. Areas with lower index values may require additional nutrients to improve crop performance.
Pest and Disease Detection
Sudden changes in vegetation indices can indicate pest infestations or disease outbreaks. Early detection allows for prompt treatment and minimizes crop losses.
Crop Phenology Tracking
By monitoring seasonal changes in vegetation indices, farmers can track crop growth stages and optimize management practices accordingly.
6. How Farmonaut Utilizes Vegetation Indices
At Farmonaut, we recognize the immense value of vegetation indices in precision agriculture. Our satellite-based farm management solutions incorporate both NDVI and EVI to provide farmers with comprehensive insights into their crop health and performance.
Integrated Vegetation Index Analysis
Our platform combines NDVI and EVI data to offer a more nuanced understanding of crop conditions. By leveraging the strengths of both indices, we provide farmers with a more accurate and reliable assessment of their fields.
Time-Series Monitoring
We offer historical and real-time vegetation index data, allowing farmers to track changes in crop health over time. This temporal analysis helps identify trends and anomalies that may not be apparent from a single snapshot.
Custom Alerting System
Our Jeevn AI Advisory System analyzes vegetation index data to generate personalized alerts for farmers. When significant changes in NDVI or EVI are detected, the system notifies users and provides tailored recommendations for addressing potential issues.
Integration with Other Data Sources
We combine vegetation index data with other crucial information such as weather forecasts, soil moisture levels, and historical yield data to provide a holistic view of farm conditions. This integrated approach enables more informed decision-making.
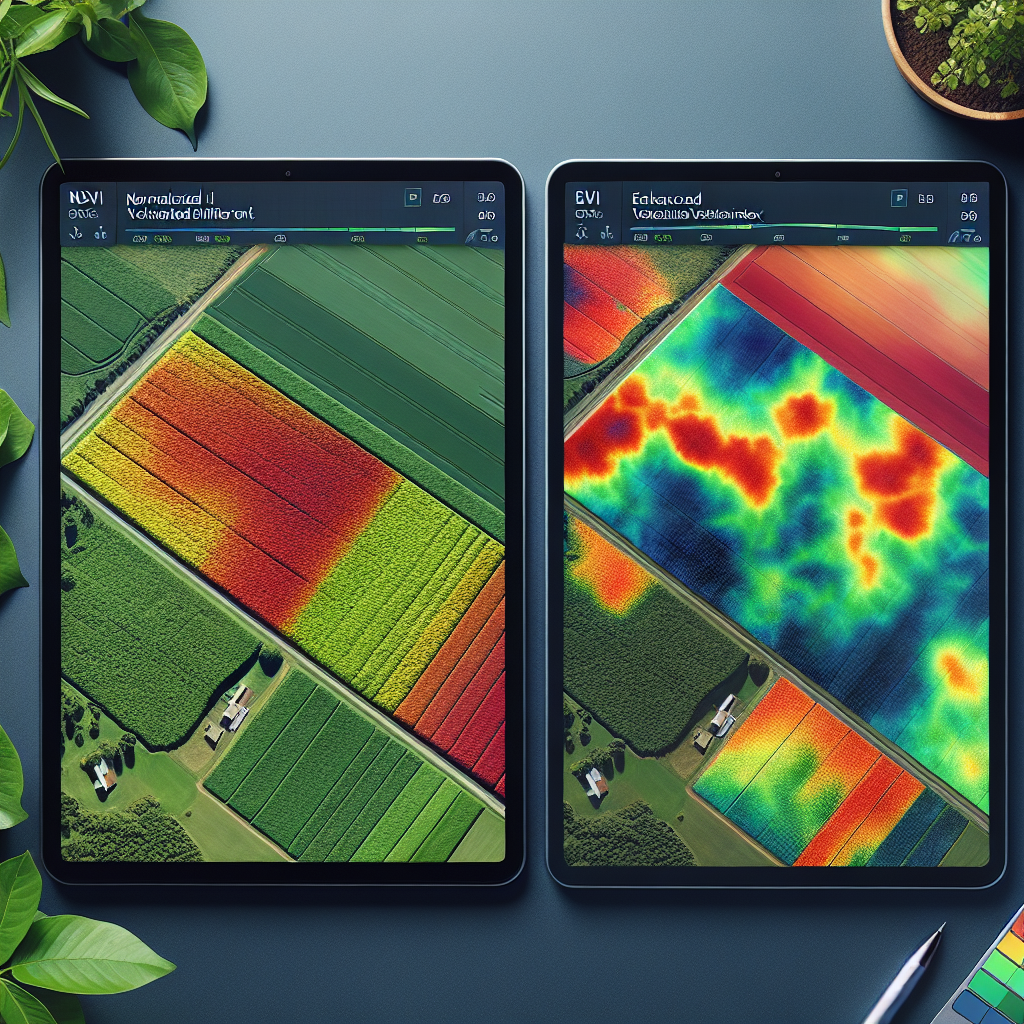
User-Friendly Visualization
Our platform presents vegetation index data in easy-to-understand maps and charts, making it accessible to farmers of all technical backgrounds. Users can easily toggle between NDVI and EVI views to gain different perspectives on their crop health.
API Access for Advanced Users
For developers and advanced users, we offer API access to our vegetation index data, allowing for seamless integration with other farm management tools and custom applications. Learn more about our API at https://sat.farmonaut.com/api.
7. The Future of Vegetation Indices in Agriculture
As technology continues to advance, we anticipate several exciting developments in the use of vegetation indices for precision agriculture:
Integration with Machine Learning
Machine learning algorithms will increasingly be used to analyze vegetation index data, enabling more accurate predictions of crop yields, disease outbreaks, and optimal management practices.
Hyperspectral Indices
As hyperspectral sensors become more accessible, new vegetation indices that utilize a broader range of spectral bands will be developed, offering even more precise insights into crop health and physiological processes.
Fusion with IoT Data
Vegetation index data from satellites will be increasingly combined with ground-based sensor data from IoT devices, providing a more comprehensive understanding of crop conditions at multiple scales.
Automated Decision Support Systems
Advanced AI systems will use vegetation index data along with other inputs to provide automated, real-time recommendations for farm management, further optimizing resource use and crop yields.
Blockchain Integration
Vegetation index data may be incorporated into blockchain-based traceability systems, providing verifiable evidence of sustainable farming practices and crop quality throughout the supply chain.
Farmonaut Satellite System vs. Drone and IoT-based Farm Monitoring
| Feature | Farmonaut Satellite System | Drone-based Monitoring | IoT-based Monitoring |
|---|---|---|---|
| Coverage Area | Large-scale (Global) | Limited (Local) | Limited (Point-based) |
| Frequency of Data Collection | Regular (Every few days) | On-demand (Manual flights) | Continuous |
| Initial Setup Cost | Low | High | Moderate to High |
| Operational Complexity | Low (Cloud-based) | High (Requires skilled operator) | Moderate (Maintenance required) |
| Data Processing | Automated | Semi-automated | Automated |
| Weather Dependency | Low | High | Low |
| Scalability | Highly Scalable | Limited Scalability | Moderate Scalability |
| Integration with Other Data Sources | Extensive | Limited | Moderate |
Subscribe to Farmonaut
Ready to leverage the power of advanced vegetation indices and satellite-based farm monitoring? Subscribe to Farmonaut today and take your precision agriculture practices to the next level.
8. FAQs
Q1: What is the main difference between EVI and NDVI?
A1: The main difference lies in their sensitivity to high biomass areas and atmospheric conditions. EVI is more sensitive in densely vegetated regions and less affected by atmospheric interference compared to NDVI.
Q2: Which index is better for crop monitoring, EVI or NDVI?
A2: Both indices have their strengths. NDVI is widely used and simple to interpret, while EVI may provide more accurate results in areas with dense vegetation or varying atmospheric conditions. The choice depends on the specific crop, region, and monitoring goals.
Q3: How often does Farmonaut update its vegetation index data?
A3: Farmonaut provides regular updates to vegetation index data, typically every few days, depending on satellite pass frequency and cloud cover. For the most up-to-date information, please check our app or API documentation.
Q4: Can I use Farmonaut’s vegetation index data for my own applications?
A4: Yes, Farmonaut offers API access to our vegetation index data. Developers can integrate this data into their own applications or analysis tools. For more information, visit our API documentation page.
Q5: Is Farmonaut’s platform available on mobile devices?
A5: Yes, Farmonaut offers mobile apps for both Android and iOS devices. You can download our app from the Google Play Store or the Apple App Store.
Q6: How does Farmonaut ensure the accuracy of its vegetation index data?
A6: We use high-quality satellite imagery and advanced processing algorithms to calculate vegetation indices. Our data undergoes rigorous quality control measures, and we continuously validate our results against ground-truth data to ensure accuracy.
Q7: Can vegetation indices help in detecting crop diseases?
A7: Yes, vegetation indices can be useful in detecting crop diseases, especially those that affect plant health and cause changes in leaf color or canopy structure. However, it’s important to note that vegetation indices alone may not be sufficient for definitive disease diagnosis and should be used in conjunction with other monitoring methods and on-ground verification.
Q8: How does Farmonaut’s use of vegetation indices compare to traditional farm monitoring methods?
A8: Farmonaut’s satellite-based monitoring using vegetation indices offers several advantages over traditional methods:
- Covers large areas quickly and efficiently
- Provides consistent, objective measurements
- Enables frequent monitoring without field visits
- Allows for historical analysis and trend identification
- Integrates easily with other data sources for comprehensive insights
However, it’s important to note that satellite-based monitoring should complement, not replace, on-ground observations and expertise.
Q9: Are there any limitations to using vegetation indices for farm management?
A9: While vegetation indices are powerful tools, they do have some limitations:
- Cloud cover can interfere with data collection
- May not detect all types of plant stress or diseases
- Resolution may not be sufficient for very small fields or precise applications
- Interpretation may require some expertise or additional context
Farmonaut addresses many of these limitations through advanced processing techniques, integration with other data sources, and user-friendly interpretation tools.
Q10: How can I get started with using Farmonaut for vegetation index monitoring on my farm?
A10: Getting started with Farmonaut is easy:
- Visit our website at farmonaut.com
- Sign up for an account
- Download our mobile app or access the web platform
- Add your farm boundaries
- Start exploring vegetation index data and other insights for your fields
Our support team is always available to help you make the most of our platform and integrate vegetation index monitoring into your farm management practices.
By leveraging the power of EVI NDVI indices through Farmonaut’s advanced satellite-based monitoring system, farmers can gain unprecedented insights into their crop health and optimize their management practices. The future of precision agriculture is here, and it’s more accessible than ever before. Join us in revolutionizing farming practices and ensuring a sustainable future for agriculture worldwide.
Ready to take your farm management to the next level? Sign up for Farmonaut today and start harnessing the power of satellite-based vegetation monitoring!
