

Crops · River valley guide
Crops Grown in River Valleys: Data From 5 Valleys
California’s Central Valley grows more than 250 crops, the Mississippi Delta cotton, soybeans, rice and corn, the Willamette Valley grass seed and the Nile Valley wheat and clover. Five valleys compared with dated numbers.
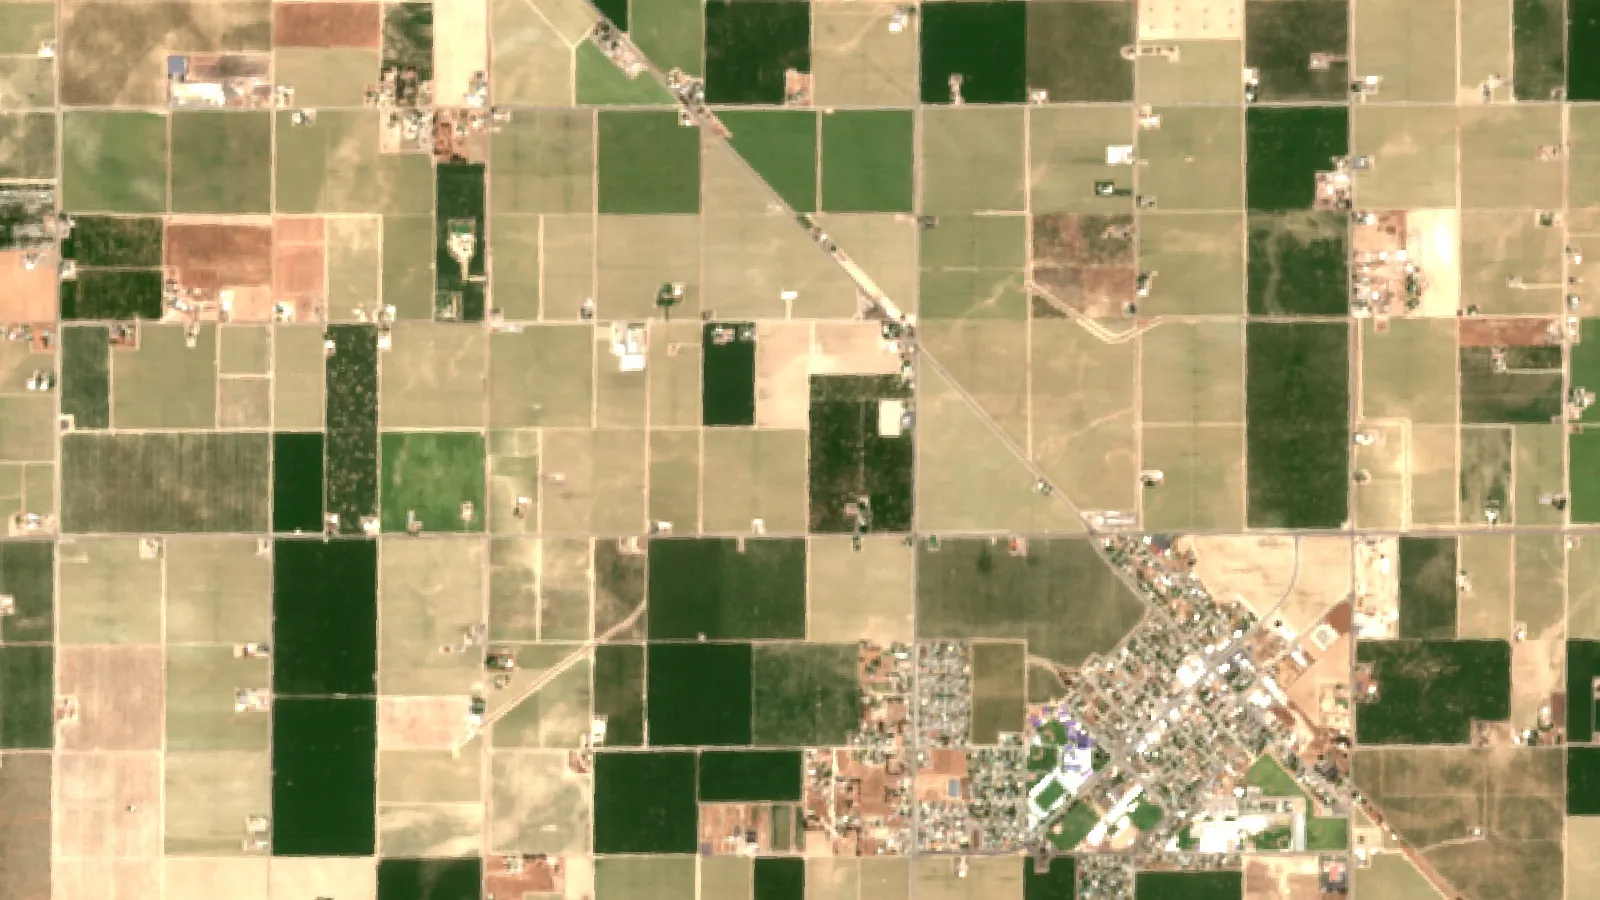
Key takeaways
- The Central Valley grows more than 250 crops worth about US$17 billion a year on under 1% of US farmland (USGS).
- The Mississippi Delta covers over 4 million acres of deep alluvial soil, with 220 to 260 frost-free days (Mississippi State, 2005).
- The Murray Darling Basin held 60% of Australia’s irrigated land and took 62% of its irrigation water in 2020-21 (ABS).
- Crop value swings: California almond receipts fell from US$5.35 billion in 2021 to US$3.88 billion in 2023 (CDFA).
- Floods add fertile sediment but can destroy a crop; the calculator tests your own flood chance.
In this article
- Crops grown in river valleys at a glance
- Why river valleys suit so many crops
- California's Central Valley and Salinas Valley
- Mississippi Delta: cotton, soybeans, rice and corn
- Willamette Valley: grass seed, hazelnuts and berries
- Murray-Darling Basin: irrigation at national scale
- Nile Valley and Delta: a narrow green strip
- Valley crops by group
- Mistakes to avoid on valley land
- Irrigation, floods and salt in valley farming
- How to choose crops for a valley field
- What does flood risk do to a valley field's return?
- Watching valley fields through the season
- FAQ
Crops grown in river valleys depend on the valley: California’s Central Valley grows more than 250 crops, including grains, hay, fruit, nuts, vegetables and cotton, while the Mississippi Delta grows cotton, soybeans, rice and corn (USGS; Mississippi State University). This guide compares five valleys with dated numbers, shows what each one grows and why, and ends with a calculator that tests how flood risk changes the return on a valley field.
The common thread is simple. Rivers lay down deep, level, well-watered soil, so growers can choose crops by market and climate rather than by what the land will tolerate. The sections below show where that works, where it needs help, and what to watch.
Crops grown in river valleys at a glance
The table sums up the five valleys covered here. Each has its own section below with the source behind the numbers.
| Valley | Main crops | Key fact | Source |
|---|---|---|---|
| Central Valley, US | Nuts, grapes, tomatoes, hay, cotton, citrus | More than 250 crops, about US$17 billion a year | USGS |
| Mississippi Delta, US | Cotton, soybeans, rice, corn | Over 4 million acres of deep alluvial soil | Mississippi State |
| Willamette Valley, US | Grass seed, hazelnuts, berries, nursery stock | Grass seed worth US$639 million in Oregon, 2021 | Oregon Dept. of Agriculture |
| Murray-Darling Basin, Australia | Cereals, cotton, rice, dairy, fruit, grapes | 60% of Australia’s irrigated land, 2020-21 | ABS |
| Nile Valley and Delta, Egypt | Wheat, berseem clover, maize, rice, vegetables | 99.8% of cropland irrigated, 1997 | FAO |
Why river valleys suit so many crops
When a river spills over its banks, the water slows and drops its sediment. A university physical geography text from Ohio University explains that these alluvial deposits are often rich in nutrients and naturally fertilize floodplain soils. Over centuries this builds soil that is deep, fine-textured and level.
Four traits explain most of the crop choice in valleys:
- Deep soil: roots go down, so tree crops, cotton and row crops all fit.
- Water close by: a river or its canals lets growers irrigate in dry months.
- Flat land: large machines work well on valley floors, which suits grain, cotton and hay.
- Long seasons: Mississippi State researchers report 220 to 260 frost-free days a year in the Delta, which allows many crop choices.
Valleys also have costs. Floods can destroy a crop in the field. Irrigation water can carry salts, and the Food and Agriculture Organization (FAO) has a guide on irrigation water quality that covers salinity and toxic ions such as sodium and chloride. Tree crops are listed as the more sensitive group. Both risks come up again in the calculator section.
California’s Central Valley and Salinas Valley
The Central Valley covers about 20,000 square miles and is drained by the Sacramento and San Joaquin rivers, according to the U.S. Geological Survey (USGS). It grows more than 250 crops worth an estimated US$17 billion a year. USGS also says the valley uses fewer than 1% of US farmland and supplies 8% of US farm output by value, about a quarter of the nation’s food, and 40% of its fruits, nuts and other table foods. About 75% of California’s irrigated land lies in the valley, in its Valley Facts summary.
The main crop types USGS lists are cereal grains, hay, cotton, tomatoes, vegetables, citrus, tree fruits, nuts, and table and wine grapes. County totals show where the money is. In the California Department of Food and Agriculture review for 2023, Kern, Fresno and Tulare counties ranked first to third. Their leading commodities were grapes, vegetables, almonds, pistachios, cattle, milk and oranges. Monterey County ranked fourth, led by lettuce, strawberries and broccoli, which are the crops of the Salinas Valley on the coast.
Prices move a lot from year to year. Almonds were California’s second-largest commodity in 2021 at US$5.35 billion and ranked sixth in 2023 at US$3.88 billion, while grapes rose from US$5.21 billion to US$6.52 billion (CDFA, statewide cash receipts). A valley’s crop mix is a market decision as much as a soil one.
Chart
Gross farm value of top valley counties, 2023
US$ billion, county gross values (not net of costs)
Mississippi Delta: cotton, soybeans, rice and corn
The Mississippi Delta is one of the largest contiguous farming areas in the United States, with more than 4 million acres of deep alluvial soil. A Mississippi Agricultural and Forestry Experiment Station bulletin lists cotton, soybean, rice, corn and small grain as the major enterprises (Mississippi State University, 2005). The same bulletin says rainfall timing means irrigation is often needed to meet crop needs.
Soil type matters inside the Delta. The bulletin pairs soils with crops. Well-drained soils suit cotton, corn and most vegetables, while heavy silty clay loams hold flood water and suit flood-irrigated rice. A single farm can therefore grow rice on one field and cotton on the next. The bulletin dates from 2005, so check current acreage with USDA’s National Agricultural Statistics Service before planning.
Willamette Valley: grass seed, hazelnuts and berries
In western Oregon, the Willamette Valley grows many specialty crops. The Oregon Department of Agriculture calls the Willamette Valley the grass seed capital of the world. Oregon grass seed was the state’s third most valuable commodity in 2021, worth US$639.2 million, up 28% on 2020. Nursery and greenhouse products led at US$1.32 billion.
Oregon State University’s North Willamette Research and Extension Center says Oregon grows 99% of US hazelnuts and that nearly 40% of the US$5.7 billion farmgate value of Oregon agriculture is produced within 50 miles of its station (OSU fact sheet). The center’s research covers nursery crops, hazelnuts, berries, vegetables, specialty seed and orchard crops.
Murray-Darling Basin: irrigation at national scale
Australia’s biggest farm river system shows how much a valley can carry. The Australian Bureau of Statistics (ABS) reported that in 2020-21 the Murray Darling Basin held 60% of Australia’s irrigated land, about 1.2 million hectares, and took 62% of the water applied for irrigation, 4.9 million megalitres (Water Use on Australian Farms, 2020-21). After a wet year, irrigated cereals other than rice covered 276,000 hectares and cotton 182,700 hectares. Rice jumped from 4,073 hectares in 2019-20 to 43,764, as water became available.
An older ABS profile shows what the basin earns from that water. In 2005-06 it produced a gross value of agricultural production of A$14,991 million, 39% of the national total, and generated 100% of Australia’s irrigated rice value, 92% of irrigated cotton and 84% of irrigated cereals other than rice (ABS statistical profile). It earned 44% of Australia’s irrigated production value while using 66% of its agricultural water. Rice used 16% of the basin’s farm water for a small share of value, while fruit (excluding grapes) earned more per unit of water. Those value figures are from 2005-06; the 2020-21 release above reports area and water, not value.
Nile Valley and Delta: a narrow green strip
Egypt shows a valley at its most extreme. FAO’s country profile says the Nile Valley and Delta cover about 4% of Egypt’s land, yet about 97% of its people live there (FAO AQUASTAT, figures from 2004). A NASA astronaut photograph of the Nile bend near Luxor shows green fields bordered by sharp desert margins.
FAO’s Egypt country profile reports three growing seasons. Winter crops are mainly wheat and berseem clover, and berseem is sometimes grown short as a soil improver before cotton. Most crops grow in both Delta and Valley, except rice, which is grown mainly in the Delta, and sugarcane, mainly in the Valley. With 99.8% of cropland irrigated (1997) and an irrigated cropping intensity of 176% (2002), the same land often carries more than one crop a year.
Chart
Main annual crops in Egypt’s irrigated land, 2002
Harvested area, thousand hectares
Valley crops by group
Sorting the crops from the five valleys by type shows why each valley fits what it grows.
Grains and oilseeds
Wheat, rice, maize and soybeans suit flat, deep soil where large machines can work. In Egypt, wheat took 1.03 million hectares and maize 0.83 million in 2002, ahead of rice at 0.65 million (FAO). In the Mississippi Delta, rice, corn and soybeans share the land by soil type. In the Murray-Darling Basin, cereals other than rice were irrigated on 276,000 hectares in 2020-21 (ABS).
Fruit, nuts and vines
Trees and vines need deep, drained soil and steady water, and a valley with irrigation can supply both. California’s almonds, pistachios, walnuts, table grapes and wine grapes are the clearest case. California’s Department of Food and Agriculture says the state supplies 99% or more of US exports of almonds, pistachios, walnuts, raisins, table grapes and processing tomatoes. Almonds alone were worth US$4.36 billion in exports in 2023, and pistachios US$2.73 billion. California’s top three export markets for all farm goods that year were Canada, the European Union and China/Hong Kong.
Tree crops need a longer view
Almonds, pistachios and walnuts take years to reach full bearing, so a grower who plants them is betting on prices and water supply a decade ahead. The CDFA price swings quoted here show why many valley farms spread risk across several crops, or between crops and livestock. Before planting trees, test the soil and the irrigation water, ask the water district about supply in dry years, and get professional advice on financing.
Fibre, forage and dairy
Cotton grows in the Mississippi Delta, the Murray-Darling Basin and California. Forage crops feed dairy herds: milk was California’s top commodity in 2023 at US$8.13 billion, and hay ranked 15th at US$0.84 billion (CDFA). In Egypt, berseem clover is a winter fodder crop and a soil improver. In the Murray-Darling Basin, dairy led irrigated value at A$938 million in 2005-06 (ABS), and 124,000 hectares of irrigated hay and silage were grown in 2020-21.
Vegetables and specialty crops
Vegetables need regular water and fertile soil, so the Salinas Valley and the Central Valley grow lettuce, broccoli and tomatoes. Egypt grew 472,000 hectares of vegetables in 2002 (FAO). The Willamette Valley adds grass seed, hazelnuts and berries, which OSU lists among the region’s main crops.
Chart
Value of five California commodities, 2021 and 2023
US$ billion, statewide cash receipts
Mistakes to avoid on valley land
Valley land looks forgiving, which makes it easy to skip checks that matter. The list below draws on the sources above and on common field practice. Local extension offices can give exact advice for your county.
- Planting one crop on every soil. The Mississippi Delta bulletin pairs soil types with crops for a reason.
- Ignoring salt. FAO’s guide notes that tree crops are more sensitive to toxic ions than most annual crops. Test irrigation water before planting trees or vines.
- Counting on last year’s price. Almond receipts fell by about a quarter between 2021 and 2023 while grape receipts rose by about a quarter (CDFA).
- Forgetting flood rules. Building, drainage and fertilizer rules near rivers vary by state and country. Check local rules and get professional advice.

▶ Seven simple ways to protect soil and water on a farm. · 4:34
Irrigation, floods and salt in valley farming
Valley soil comes with a water bill and a flood risk. Drip systems, laser leveling and scheduling by soil moisture cut water use, and satellite vegetation maps can show which parts of a field lag. Salt needs watching wherever irrigation water is reused or the water table is high. Flood risk is local: check flood maps and drainage rules for your parcel, and ask your crop insurance agent how flood losses are covered.
Short videos from our channel cover water saving and soil care in plain language:

▶ Seven green farming technologies for saving water, fuel and fertilizer. · 2:24
How to choose crops for a valley field
- Start with the soil map. Heavy clay suits flooded rice or hay. Lighter alluvial soil suits cotton, vegetables and trees.
- Check water rights and cost. The Murray-Darling figures show some crops use far more water per dollar than others.
- Plan for the worst flood year. Use the calculator below with your own flood chance and loss.
- Match the market. The California swings above show that the most valuable crop one year may not be next year.
- Rotate. Egypt’s berseem clover before cotton is an old example of a crop that improves soil for the next one.
What does flood risk do to a valley field’s return?
Use the calculator below to see the expected return per acre when a flood may wipe out part of the crop. Enter your own numbers: the defaults are examples only. This is a planning aid, not financial advice. Talk to a local adviser or lender before you commit money.
Try the numbers for your own farm below.
Calculator
What is a valley field’s expected return with flood risk?
Enter your own field size, yield, price, cost and flood chance.
- Expected return per acre, US$: $45
- Expected share of crop lost: 4.0 %
- Break-even price, US$/bu: $10
Example values only, not a forecast or a benchmark. Price is an example, use today’s price. Expected return = area x (yield x price x (1 – flood chance x loss) – cost). Flood chance is the yearly probability; loss is the share of the crop lost in a flood year.
Watching valley fields through the season
Large valley fields vary in drainage and soil. Satellite vegetation maps, such as those in the Farmonaut Satellite + AI Farm Monitoring System, show where growth differs inside a field so you can check those spots on foot. The maps show plant cover, not the cause, so confirm any problem in the field.

▶ How satellite NDVI maps show crop stress before it is visible from the ground. · 4:09
FAQ
What crops are grown in valleys?
It depends on climate and soil. The Central Valley grows nuts, grapes, tomatoes and hay (USGS), the Mississippi Delta cotton, soybeans, rice and corn (Mississippi State), the Willamette Valley grass seed and hazelnuts (Oregon sources), and the Nile Valley wheat, berseem clover, maize and rice (FAO).
Why are river valleys good for farming?
Floods deposit nutrient-rich sediment, the land is flat and the river gives water for irrigation. Alluvial deposits are often rich in nutrients, according to Ohio University’s physical geography text.
Which valley grows the most food in the United States?
USGS says California’s Central Valley supplies about a quarter of the nation’s food. The Mississippi Delta is also one of the largest contiguous farming areas, over 4 million acres.
Do floods help or harm valley crops?
Both. Floods bring fresh sediment, but a flood in the growing season can destroy a crop. Flood chance and the share of crop lost are the two inputs to the calculator.
What is the best crop for a floodplain field?
There is no single answer. Rice tolerates flooded fields on heavy soil, while cotton and vegetables need well-drained soil (Mississippi State). Ask your local extension office for crops that suit your soil and flood history.
Can valley land grow more than one crop a year?
Often, where the season and water allow. FAO reports an irrigated cropping intensity of 176% in Egypt (2002), which means the average irrigated hectare carried 1.76 crops that year. Check what is possible on your own soil and in your own climate with local extension.
How can I check a valley field during the season?
Walk the field, read soil moisture and look at satellite vegetation maps for weak patches. Maps show where plant cover differs, and a visit then shows why. For chemical or fertilizer decisions, follow the product label and local rules.
How we checked the numbers
We opened every source linked on this page. Figures are quoted with their year and publisher, and older ones are marked. California values are statewide cash receipts, and county values are gross farm values from county reports; they do not subtract costs. Murray-Darling figures are from 2020-21 (area and water) and 2005-06 (value), the Egypt crop areas are from 2002, and the Mississippi Delta bulletin is from 2005.
Related pages on our site: Arkansas River Valley farming, farming practices, multiple cropping, carbon footprints, crop loans and insurance, machinery tracking, product traceability, satellite and weather API, farm admin app.
Farmonaut crop monitoring
See your own fields from space
Draw your fields once and see satellite vegetation maps for them through the season, on web, Android or iOS.




Keep reading

Sources
- USGS California Water Science Center, California’s Central Valley: ca.water.usgs.gov
- CDFA, California Agricultural Statistics Review 2023-2024: cdfa.ca.gov
- Mississippi State University, Bulletin 1143 Current Agricultural Practices of the Mississippi Delta (2005): mafes.msstate.edu
- Oregon Department of Agriculture, Top 20 Agricultural Commodities release (2023): content.govdelivery.com
- Oregon State University, North Willamette Research and Extension Center fact sheet: agsci.oregonstate.edu
- Australian Bureau of Statistics, Irrigated and non-irrigated agricultural production (2005-06): abs.gov.au
- FAO AQUASTAT, Egypt country profile: fao.org
- NASA Earth Observatory, The Great Bend of the Nile, Day and Night: science.nasa.gov
- FAO, Water quality for agriculture: fao.org
- Ohio University, The Physical Environment: alluvial landforms: people.ohio.edu
- ABS, Water Use on Australian Farms, 2020-21: abs.gov.au
Discussion
Questions, corrections or field experience? Share them below. First-time comments are reviewed before they appear, and your email is never published.
No comments yet. Be the first to add a question or your experience.

 MISE Maroc
 Drift-Sense
 NWNS
 Hydenmet
 Dirks Bros Farms
 Red August Group
 Farm Inc
 WeMe Global
 Agrotoken
 Blue BearX
 Insignito
 Croptimum
 DnCubed
 Field Capacity
 Indosistim Teknologi
 Liquify Digital
 CU Foods
 BeyondTech Global

 Licence holder · Niger · Gold
 Licence holder · Nigeria · Gold + lithium










