

Canada · Province farm guide
Quebec Agriculture: Key Products, Farm Data and Trends
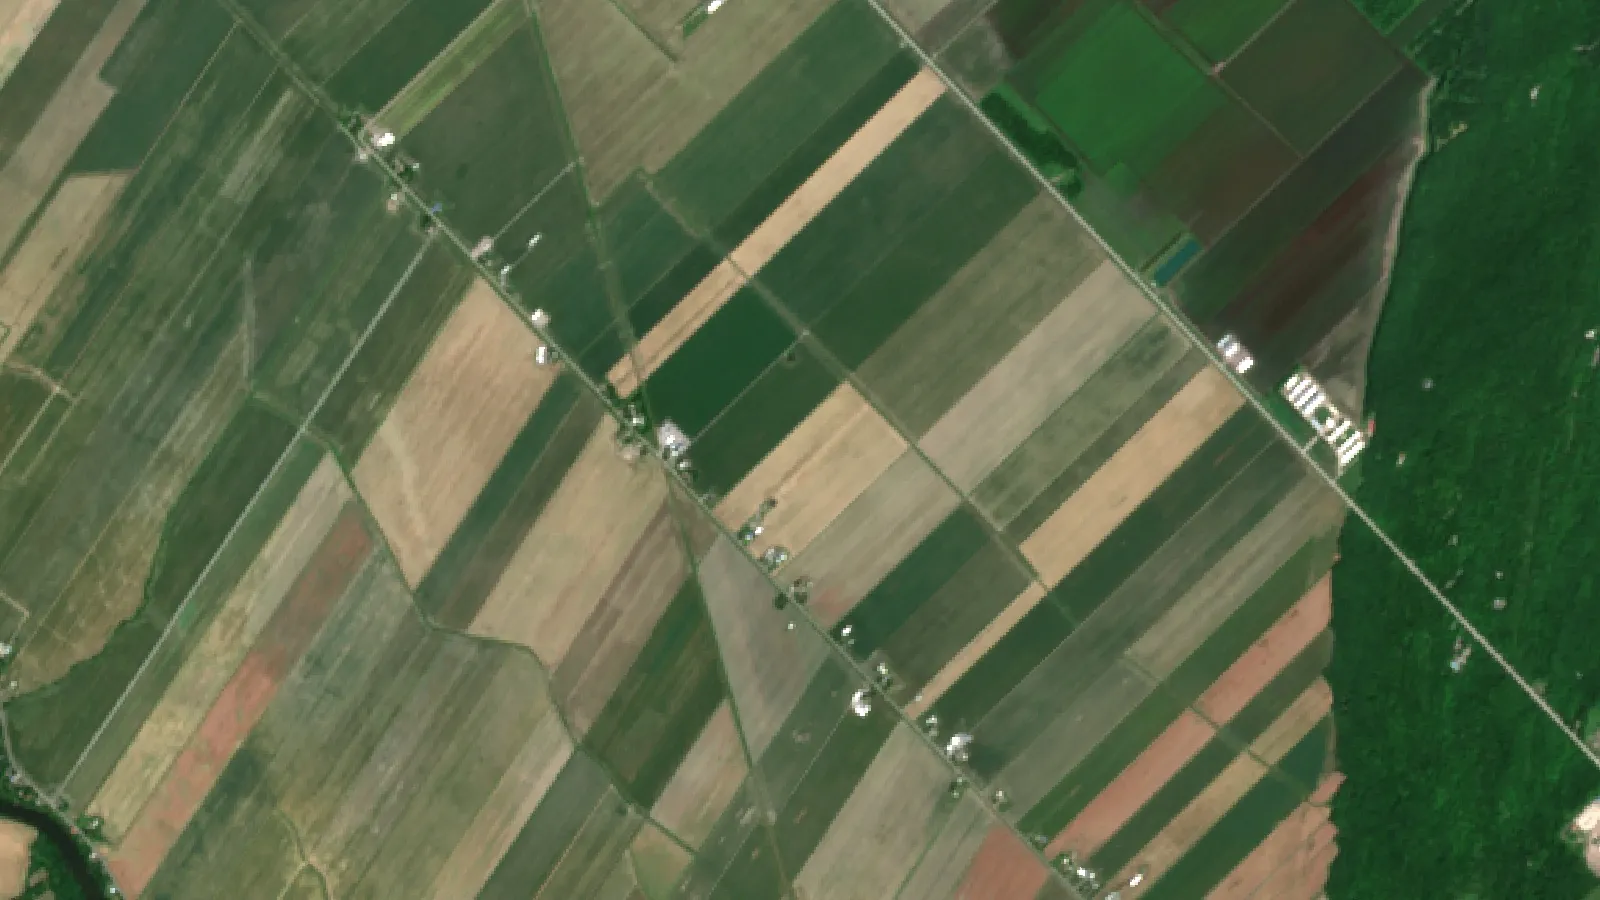
Quebec agriculture rests on dairy, pork, maple syrup, grains and berries: 29,380 farms in 2021, dairy earning 24.5% of farm revenue, and 90.0% of Canada’s maple syrup in 2025 (Statistics Canada).
Key takeaways
- Quebec had 29,380 farms in 2021, up 1.6% from 2016 while Canada’s total fell 1.9% (Statistics Canada).
- Dairy earned 24.5% of Quebec farm revenue in 2020, hogs 15.7% and oilseeds and grains 13.5%.
- Quebec made 17.0 million gallons of maple syrup in 2025, 90.0% of Canada’s output (Statistics Canada, Dec 2025).
- Quebec cultivated farmland values rose 4.8% in 2025 against 9.3% nationally (Farm Credit Canada).
- Quebec reported the largest provincial gain in realized net farm income in 2025, up C$474.4 million (Statistics Canada, May 2026).
In this article
- Quebec agriculture in numbers
- Main agricultural products of Quebec
- Where Quebec stands in Canada
- Quebec farmland values
- A short history: the pioneers of Quebec farming
- Who supports Quebec farmers
- The Montreal Chamber of Commerce and farm exhibitions
- Farm education in Quebec
- 7 trends shaping Quebec agriculture
- Practical steps for farming in Quebec
- Technology on Quebec farms
- Maple syrup income calculator
- FAQ
- Conclusion
Quebec agriculture is built on dairy, pork, maple syrup, grains and berries. The 2021 Census of Agriculture counted 29,380 farms in the province, and dairy farms earned 24.5% of all farm revenue (Statistics Canada, Canadian Agriculture at a Glance, 2022). Quebec also made 90.0% of Canada’s maple syrup in 2025.
This guide gives the key numbers, the main products, how farm land and money have moved, who supports Quebec farmers, and seven trends that shape farm decisions. It ends with a maple income calculator you can run with your own numbers.
Quebec agriculture in numbers
The census is the best single picture of farming in the province. Figures below are for 2021; revenue shares are for 2020, the year the census asked about.
| Measure | Quebec |
|---|---|
| Farms | 29,380 (up 461 from 2016) |
| Farm operators | 42,265, average age 54.0 |
| Largest farm type | Dairy: 24.5% of farm revenue |
| Next largest | Hogs 15.7%; oilseeds and grains 13.5% |
| Dairy cows | 36.4% of Canada’s herd |
| Pigs | 29.6% of Canada’s pigs |
| Maple taps | 89.1% of Canada’s taps |
| Blueberry area | 40.9% of Canada’s area |
| Cranberry area | 58.4% of Canada’s area |
| Organic farms | 43.7% of Canada’s organic farms |
| Direct sales | 20.9% of farms (13.6% nationally) |
Two facts stand out. First, the number of farms in Quebec rose by 1.6% between 2016 and 2021, while the Canadian total fell by 1.9%. Second, farm size is uneven. Farms with C$1 million or more in revenue were 9.9% of all farms but earned 62.5% of farm operating revenue in 2021, according to the same census article.
The long view is very different. Quebec had 135,957 farms in 1931. The count fell in almost every census until 2016, then turned up slightly in 2021.
Chart
Number of farms in Quebec
Farms counted by the Census of Agriculture, selected census years
Main agricultural products of Quebec
The province’s farm output is led by a few large sectors. Here is what each one looks like.
Chart
Share of Quebec farm revenue by farm type
Percent of total farm revenue, 2020, largest seven farm types
Milk and dairy
Dairy is the largest farm type by revenue. Milk is sold under Canada’s supply management system, which sets production quotas and farm prices for dairy, eggs and poultry. Supply-managed receipts across Canada grew 3.2% to C$15.7 billion in 2025 (Statistics Canada, farm cash receipts, February 2026). Quebec dairy farms are also leaders in automation: 902 farms reported robotic milking in 2020, 41.1% of the Canadian total. Les Producteurs de lait du Québec say they represent 9,281 milk producers on 4,087 farms (Les Producteurs de lait du Québec).
Pork
Hog and pig farms were only 4.3% of Quebec farms but earned 15.7% of farm revenue in 2020. Quebec had more pigs than any other province in 2021, just ahead of Ontario (27.9%) and Manitoba (23.7%).
Maple syrup
Quebec producers made 17.0 million gallons of maple syrup in 2025, down 5.9% from the record 18.0 million gallons of 2024 (Statistics Canada, Maple products, December 2025). Canada made more than 75% of the world’s maple syrup in 2025, and Canadian maple exports reached C$844.2 million, up 17.2% on the year (Agriculture and Agri-Food Canada, maple industry overview 2025). Quebec has run a maple syrup production quota system since 2004, managed by the Quebec Maple Syrup Producers, and a 2025 review found the quota has limited Quebec’s production growth compared with other regions and held producer prices below their late-2000s level (Frontiers in Sustainable Food Systems, 2025).
Grains and oilseeds
Oilseed and grain farms were 17.6% of farms and earned 13.5% of revenue in 2020. Corn and soybeans grow mainly in the St. Lawrence lowlands, where the season is longest.
Berries, vegetables and greenhouses
Quebec farms reported 79,091 acres of blueberries and 11,477 acres of cranberries in 2021, both up from 2016. Blueberries are a large crop in Saguenay–Lac-Saint-Jean, and cranberries in Centre-du-Québec. Vegetable and melon farms earned 8.1% of farm revenue, and greenhouse, nursery and flower farms 6.4%.
Where Quebec stands in Canada
Quebec’s share of Canadian output changed between the 2016 and 2021 censuses. Its share of cranberry and blueberry area grew, while its share of maple taps, dairy cows and pigs slipped a little, even though the province’s own tap count rose 14.4% to 48.7 million.
Chart
Quebec’s share of Canadian output
Percent of national total, census years 2016 and 2021
Farm cash receipts show where money comes from each year. Canada’s farm cash receipts reached C$101.4 billion in 2025, up 3.4%, with livestock receipts up 13.2% (Statistics Canada, February 2026). In the farm income release of May 2026, Quebec reported the largest gain in realized net farm income of any province in 2025, up C$474.4 million, mainly from higher livestock receipts (Statistics Canada, farm income, May 2026). Quebec crop receipts rose C$237.6 million in the same year.
Quebec farmland values
Land is the largest asset on most farms. Cultivated farmland values in Quebec rose 4.8% on average in 2025, compared with a 9.3% national average (Farm Credit Canada, Farmland Values Report 2025). FCC describes the gains in Ontario and Quebec as more tempered than in the Prairies. FCC figures are averages built from reported sales, not prices for any one farm. Quebec also protects farmland by law through the Act respecting the preservation of agricultural land and agricultural activities, so non-farm use of zoned land needs approval. Check the rules with a notary or lawyer before buying or splitting land.
Chart
Farmland value change by province
Average annual change in cultivated farmland values, 2025
A short history: the pioneers of Quebec farming
Modern farm education in Quebec owes much to Joseph-Xavier Perrault, born in Quebec City in 1836 and grandson of educator Joseph-François Perrault (Dictionary of Canadian Biography).
- He studied at the Petit Séminaire de Québec, then agronomy at the University of Durham, the Royal Agricultural College in Cirencester and the École de Grignon in France.
- Back home in 1857, he tried to set up schools with farms at Varennes and Sainte-Thérèse, an early push for French-language farm schools in Canada.
- He was secretary of the Bureau and Board of Agriculture of Lower Canada for 11 years and edited a farm journal, linking government and agriculture in Quebec.
- He was elected for Richelieu to the Legislative Assembly of the Province of Canada in 1863.
- He was secretary of the Canadian commission at the 1876 Philadelphia exhibition and held a similar post in Paris in 1878.
- He persuaded Montreal businessmen to set up the Chambre de Commerce du District de Montréal in 1886 (incorporated 1887) and became its vice-president, and France named him a chevalier of the Legion of Honour.
Who supports Quebec farmers
Several public and farmer-run bodies shape daily farm decisions.
- La Financière agricole du Québec: runs crop insurance, AgriStability, AgriInvest, farm loans and support for new farmers, plus programs such as winter cover crop support (La Financière agricole du Québec).
- Union des producteurs agricoles (UPA): the province’s farm union, with regional and commodity groups that speak for producers in policy talks.
- Commodity marketing boards: groups for milk, pork, grain and maple handle marketing rules, quotas and collective sales in their sectors.
- The ministry of agriculture (MAPAQ): sets provincial farm policy, food safety rules and advisory programs.
Program names and terms change. Check the current rules with each agency and get professional advice before applying.
The Montreal Chamber of Commerce and farm exhibitions
The Montreal Chamber of Commerce, first the Chambre de Commerce du District de Montréal, was set up in 1886 by French Canadian businessmen at Perrault’s urging. He returned to Paris in 1889 as the chamber’s delegate. Today the chamber runs trade missions and business services for Montreal companies, including food and farm businesses that want export markets. For farmers, the practical value is market contacts, export paperwork help and meetings with buyers.
Farm education in Quebec
Quebec has two university faculties of agriculture. Université Laval’s Faculté des sciences de l’agriculture et de l’alimentation teaches in French in Quebec City. McGill’s Faculty of Agricultural and Environmental Sciences sits on the Macdonald Campus in Sainte-Anne-de-Bellevue. Colleges and vocational centres across the province train future farmers in French and English.
Training matters for the next generation. The average operator in Quebec was 54.0 years old in 2021, and only 8.6% were under 35. Just 8.5% of farms reported a written succession plan, below the national 12.0% (Statistics Canada, 2022).
7 trends shaping Quebec agriculture
These trends come from the census and recent federal data. Each has a “What it means” line for farm owners and managers.
1. Ageing operators and farm succession
The average age rose from 52.9 in 2016 to 54.0 in 2021, and fewer farms had a succession plan. What it means: start transfer planning early, with an accountant and a notary.
2. More organic production
2,474 Quebec farms reported organic production in 2021, 8.4% of farms and more than twice the national rate. Maple farms make up a large part of the total. What it means: organic markets are established in the province, but certification takes time and records.
3. Selling direct to buyers
20.9% of Quebec farms sold directly to consumers in 2020, up from 18.9% in 2015. What it means: farm stands, markets and online sales are a common second income stream.
4. Robots and farm technology
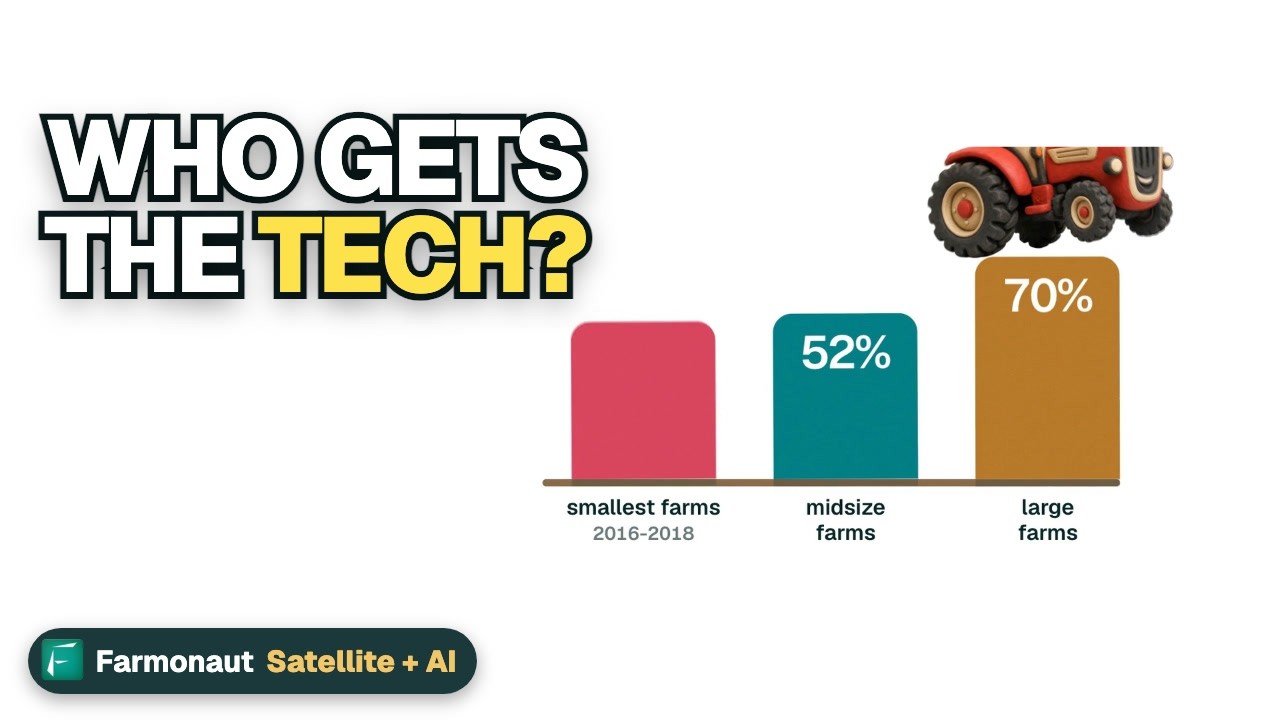
Robotic milking nearly doubled, from 454 farms in 2015 to 902 in 2020. About half of Quebec farms (49.8%) reported using some farm technology, close to the national 50.4%. What it means: technology use is mainstream, but returns depend on herd and field size. Satellite crop maps, GPS guidance and digital agronomy are part of this shift.
5. Renewable energy on farms
7.8% of Quebec farms reported renewable energy production in 2021, up from 1.8% in 2016; bioenergy systems were the most common method. The national rate was 11.9%. What it means: there is room to grow, and energy can cut costs on some farms.
6. Stronger livestock income
Higher livestock receipts drove Quebec’s net farm income gain in 2025, and Canadian hog receipts rose by C$880.8 million (Statistics Canada, 2026). What it means: hog and cattle receipts were higher in 2025, mainly on higher prices, but prices move in cycles, so plan for weaker years.
7. Land costs keep climbing
Quebec farmland rose 4.8% in 2025, slower than most provinces but still rising. What it means: expansion by buying land is costly; renting, sharing equipment or adding value on existing land can be cheaper ways to grow.
▶ How farm technology changes money, jobs and internet in rural towns. · 3:50
Practical steps for farming in Quebec
Readers who came from our older page on Quebec farming strategies will find the practical points here.
- Know your zoning. Check whether land sits in the protected agricultural zone before you buy or build.
- Insure the crop. Look at crop insurance and income programs from La Financière agricole before the season starts.
- Fit the crop to the season. Corn and soybeans suit the warmer lowlands; maple, forage, berries and pasture suit cooler regions.
- Protect the soil over winter. Cover crops and residue reduce erosion on bare fields during spring melt.
- Watch each field. Scouting, yield maps and satellite vegetation maps show which parts of a field lag behind, so you can check them on foot.
- Keep good records. Organic, insurance and loan files all depend on clear field and input records.
- Plan the handover. Write a succession plan years before retirement.
For fertilizer and pesticide decisions, always follow the product label and local rules.
Technology on Quebec farms
Common tools include satellite crop health maps (NDVI and similar indices), GPS guidance, robotic milkers, farm management software and equipment tracking. Satellite maps show where crop growth is weaker; they do not tell you the cause, so a field visit is still needed. Good equipment care also matters: see our guide on the maintenance of agricultural machinery, and our overview of digital agronomy.
Farmonaut, a US-based company, offers the Farmonaut Satellite + AI Farm Monitoring System on web, Android and iOS apps. It gives satellite vegetation maps for fields you draw once, and developers can use the satellite data API.

▶ Tutorial: monitoring crops with satellite imagery in the Farmonaut web app. · 8:43
Maple syrup income calculator
Maple is the product most tied to Quebec, and Statistics Canada reports the 2025 harvest was still the second-highest on record (Statistics Canada, Maple products, 2025). Use the calculator below to test your own sugarbush numbers: taps, syrup per tap, price and cost per tap.
Try the numbers for your own farm below.
Calculator
What could your sugarbush earn per season?
Enter your own taps, yield, price and costs.
- Syrup produced (lb): 15,000
- Gross revenue (C$): $45,000
- Total cost (C$): $42,500
- Break-even price (C$/lb): 2.83
Example values only, set near break-even; not a benchmark or a forecast. Every number is your input. Price is an example, use today’s price from your buyer or marketing agency. Cost per tap should include labour, tubing, energy, depreciation and fees.
FAQ
What are the main agricultural products of Quebec?
Milk is the largest by farm revenue (24.5% in 2020), followed by hogs (15.7%) and oilseeds and grains (13.5%). Quebec also leads Canada in maple syrup, blueberries and cranberries (Statistics Canada, 2022).
How many farms are there in Quebec?
The 2021 Census of Agriculture counted 29,380 farms, 15.5% of all farms in Canada, and 42,265 farm operators.
How much of the world’s maple syrup comes from Quebec?
Quebec made 90.0% of Canada’s maple syrup in 2025, and Canada made more than 75% of world output that year (Agriculture and Agri-Food Canada, maple industry overview 2025).
How much did Quebec farmland values rise?
Cultivated farmland values in Quebec rose 4.8% on average in 2025, against a 9.3% national average (Farm Credit Canada).
Who supports farmers in Quebec?
La Financière agricole du Québec handles insurance and farm finance, the UPA represents producers, commodity boards manage marketing, and the provincial ministry sets farm policy. Check current program terms with each body.
Conclusion
Quebec agriculture combines a strong dairy and pork base with world-leading maple and berry output. Farm numbers held steady in the last census, net farm income rose in 2025, and land values kept climbing. The main pressures are an ageing workforce, few succession plans and costly land. Farmers who plan the handover, watch costs per field and use the support programs are best placed for the next decade.
Related pages on our site: sustainable farming practices in Quebec · farm carbon footprint tracking · food product traceability · farm fleet management · satellite data for crop loans and insurance · large farm management tools · satellite and weather API documentation
Farmonaut crop monitoring
See your own fields from space
Draw your fields once and Farmonaut shows satellite vegetation maps for them through the season, on web, Android or iOS.




Keep reading


Sources
- Statistics Canada, Quebec continues to be the main force behind maple, blueberries, cranberries, dairy cows and pigs (2022): www150.statcan.gc.ca
- Statistics Canada, Farm cash receipts, 2025 (The Daily, February 2026): www150.statcan.gc.ca
- Statistics Canada, Net farm income, 2025 (The Daily, May 2026): www150.statcan.gc.ca
- Statistics Canada, Maple products, 2025 (The Daily, December 2025): www150.statcan.gc.ca
- Agriculture and Agri-Food Canada, Statistical overview of the Canadian maple industry, 2025: agriculture.canada.ca
- Farm Credit Canada, Farmland Values Report 2025: fcc-fac.ca
- Dictionary of Canadian Biography, Perrault, Joseph-Xavier (University of Toronto/Université Laval): biographi.ca
- La Financière agricole du Québec, programs: fadq.qc.ca
- Union des producteurs agricoles (UPA): upa.qc.ca
- Université Laval, Faculté des sciences de l’agriculture et de l’alimentation: fsaa.ulaval.ca
- McGill University, Faculty of Agricultural and Environmental Sciences: mcgill.ca
- Les Producteurs de lait du Québec, homepage: lait.org
- Frontiers in Sustainable Food Systems, The maple syrup industry in Canada and the United States (2025): frontiersin.org
- Statistics Canada, Maple products, 2025 (StatsCAN Plus summary): statcan.gc.ca
Discussion
Questions, corrections or field experience? Share them below. First-time comments are reviewed before they appear, and your email is never published.
No comments yet. Be the first to add a question or your experience.

 Contec Global
 ASQI
 Teledarbas
 Wild Oak Farm
 SFX
 BACF Africa
 Doodlakine
 Exurbia Geospatial
 FieldZero
 Indico Company
 Kubota
 FFBS
 Jontra
 Tucor

 Licence holder · Niger · Gold
 Client · Tanzania · Gold
 Client · Somalia · Gold
 Client & affiliate partner · Ghana · Gold










