

ASX miners · Company comparison
Best Mining Stocks ASX: 9 Miners Compared on Filings
BHP reported 1,953 kt of copper and Fortescue shipped a record 201.3 Mt of iron ore in the year to June 2026, while Northern Star sold 1,543 koz of gold. This page compares nine ASX miners on what their filings say, with best-for lines, pros and cons.
Key takeaways
- BHP made 1,953 kt of copper and 291.2 Mt of iron ore (100% basis) in FY26, and guides FY27 copper to 1,650-1,800 kt (BHP, July 2026).
- Fortescue shipped a record 201.3 Mt at a Hematite C1 cost of US$18.74 per wet tonne in FY26 (Fortescue, August 2026).
- Northern Star sold 1,543 koz of gold at an AISC of A$2,698/oz; Evolution made 715 koz at A$1,717/oz. Both guide FY27 costs higher (company reports, 2026).
- PLS made 879.5 kt of spodumene in FY26 and guides FY27 to 1,030-1,100 kt; Lynas made 1,857 t of NdPr in the June 2026 quarter.
- Australia mined about 38% of world iron ore and 32% of world lithium in 2025 (USGS, 2026; shares calculated from its tables).
In this article
- How we chose these nine ASX miners
- What Australia mines for the world
- Best mining stocks on the ASX at a glance
- Diversified ASX majors: BHP, Rio Tinto and South32
- Iron ore miners: Fortescue and Mineral Resources
- Gold miners: Northern Star and Evolution
- Lithium and rare earth miners: PLS and Lynas
- How to compare ASX miners on their filings
- What the filings do not show: risk and ground truth
- Frequently asked questions
No single ASX miner is the best fit for every investor, because the nine large ones below earn their money from different metals. In the latest filings, BHP reported 1,953 kt of copper and 291.2 Mt of iron ore (100% basis) for the year to 30 June 2026, Fortescue shipped a record 201.3 Mt of iron ore, Northern Star sold 1,543 koz of gold and PLS made 879.5 kt of lithium concentrate. This page compares the nine on what their own filings say, with a best-for line, pros and cons for each.
Units used below: kt is thousand tonnes, Mt is million tonnes, koz is thousand troy ounces, and A$ and US$ are Australian and US dollars. FY26 means the financial year ended 30 June 2026. The page gives facts from company reports, not recommendations; read the closing disclaimer.
How we chose these nine ASX miners
The list is written for investors who want to understand what an Australian-listed miner actually digs up, how much, and at what cost, before looking at any share price. We used five rules.
- Listed on the ASX with its own ticker. That includes Rio Tinto, which is dual-listed in London and Sydney. Companies whose main listing is elsewhere, such as Barrick, are covered on our page about Barrick and its share price and the wider global gold miners comparison.
- Producing, not exploring. Every company here reported tonnes or ounces sold or shipped in its most recent results. Explorers, funds and exchange-traded products (for example the gold fund with the ticker GLD) hold metal or shares rather than operate mines, so they are left out.
- One or two names per segment. We picked the diversified majors, iron ore, gold, lithium and rare earths, because those are the groups Australian investors search for most.
- Company reports only. Each volume, cost and guidance figure comes from an ASX announcement or the company’s own results page, listed in the sources. We state the basis (100% of a joint venture or the company’s share) whenever it matters.
- No share prices or targets. Prices change by the minute and we cannot date them usefully. The order of the list follows the segments, not merit.
Pure uranium, coal and oil-and-gas companies are outside this page. Gold is covered in more depth on the pages about the ASX gold and silver miners and the largest gold producers, and rare earths on our rare earth stocks page.
What Australia mines for the world
ASX miners are mostly commodity producers, so the country’s weight in each market explains a lot about them. The USGS Mineral Commodity Summaries 2026 estimate Australia’s 2025 iron ore output at 980 Mt of usable ore out of a rounded world total of 2,600 Mt, and the lithium table gives 92,000 t of contained lithium out of 290,000 t. Gold, rare earths and copper are smaller shares of much bigger or more spread-out markets.
Chart
Australia’s share of world mine production, 2025
Per cent of the USGS world total (estimates); calculated by dividing Australia by world
The chart divides each Australian figure by the USGS world total, so it shows how concentrated each market is, not how profitable it is. For a wider view of who else produces these metals, see our page on the biggest gold, silver and lithium producers.
Best mining stocks on the ASX at a glance
The table lists the nine companies by segment with the latest full-year output each one reported. Financial years differ: eight of the nine end on 30 June, while Rio Tinto reports on a calendar year.
| Company (ASX code) | Main commodities | Latest reported output (basis) | Year ends | Best for |
|---|---|---|---|---|
| BHP (BHP) | Copper, iron ore, coal | FY26: copper 1,953 kt; Western Australia Iron Ore 291.2 Mt (100%) | June | One large company with copper and iron ore |
| Rio Tinto (RIO) | Iron ore, copper, aluminium, lithium | 2025: Pilbara shipments 326.2 Mt (100%); copper 883 kt | December | Reading a calendar-year, multi-metal major |
| South32 (S32) | Copper, zinc, silver, manganese; aluminium being sold | FY26: Sierra Gorda 87.1 kt copper equivalent | June | Following a portfolio change |
| Fortescue (FMG) | Iron ore | FY26: 201.3 Mt shipped | June | Single-commodity iron ore exposure |
| Mineral Resources (MIN) | Mining services, iron ore, lithium | FY26: 341 Mt moved; iron ore 29.5 Mt; lithium sales 559 kt SC6 | June | A contractor plus two commodities |
| Northern Star (NST) | Gold | FY26: 1,543 koz sold | June | Gold output of about 1.5 Moz a year |
| Evolution Mining (EVN) | Gold, copper | FY26: gold 715 koz; copper 66 kt | June | Gold with a copper by-product |
| PLS (PLS) | Lithium | FY26: 879.5 kt spodumene | June | Lithium-price exposure |
| Lynas Rare Earths (LYC) | Rare earths | Jun 2026 quarter: NdPr 1,857 t | June | Rare earths outside China |
Diversified ASX majors: BHP, Rio Tinto and South32
The diversified majors sell several metals at once, so one weak market is partly offset by the others. The three below differ in size and in how much of the group depends on one commodity.
BHP (ASX: BHP): copper and iron ore at scale
Best for: investors who want one large company with copper and iron ore under the same roof.
BHP’s operational review for the year ended 30 June 2026 shows copper output of 1,953 kt (down 3% from 2,017 kt), a record 256.9 Mt of iron ore at its Western Australia Iron Ore (WAIO) business on BHP’s share, or 291.2 Mt counting all joint-venture partners, 18.6 Mt of steelmaking coal and 16.4 Mt of energy coal. The average realised copper price was US$5.74 per pound, up 35%.
- Pros: the company expected every asset to be within unit-cost guidance; it has copper growth options in Chile, South Australia and Argentina; potash at Jansen in Canada is on track to start production the following year.
- Cons: FY27 copper guidance is 1,650 to 1,800 kt, below FY26, mainly because Escondida’s planned feed grade falls (0.90% copper against 1.02%); coal and the suspended Western Australia nickel operation add exposure to other markets.
Rio Tinto (ASX: RIO): iron ore, copper, aluminium and lithium
Best for: investors who prefer a calendar-year reporter that also produces aluminium and lithium.
Rio’s fourth-quarter 2025 operations review gives Pilbara iron ore shipments of 326.2 Mt (100% basis, down 1%), copper of 883 kt (up 11%, helped by the Oyu Tolgoi underground ramp-up) and aluminium of 3.38 Mt. Its third-quarter 2026 release of 14 October 2026 reported nine-month copper of 646 kt and global iron ore sales of 255.3 Mt, with full-year guidance unchanged. Simandou in Guinea reached an annualised rate of about 10 Mt a year in the quarter and targets a 60 Mt rate during the second half of 2028.
- Pros: several product groups; Oyu Tolgoi copper was up 29% for the first nine months of 2026; the company reports guidance ranges for each product.
- Cons: 2026 copper guidance of 800 to 870 kt sits below the 883 kt made in 2025; Simandou must ramp up as planned; calendar-year numbers do not line up with the June-year peers on this page.
South32 (ASX: S32): a base-metals and manganese portfolio in transition
Best for: investors who want to follow a company that is selling its aluminium business and growing in copper and zinc.
South32’s 2026 annual report shows underlying EBITDA (earnings before interest, tax, depreciation and amortisation, adjusted for one-offs) up 28% to US$2.5 billion and underlying earnings up 55% to US$1 billion. On 30 June 2026 it agreed to sell its aluminium value chain, including Worsley Alumina and Hillside, to Alcoa for up to US$5.6 billion, with Alcoa also taking on about US$1.1 billion of rehabilitation provisions. Completion is expected in the second half of FY27, subject to conditions precedent. After the sale South32 would hold Sierra Gorda copper (45%), Cannington silver-lead-zinc, Hermosa, Ambler Metals and its manganese mines; Sierra Gorda made 87.1 kt of copper equivalent in FY26 (South32’s 45% share; the mine’s 100%-basis guidance was 190 kt).
- Pros: a clear plan to focus on copper, zinc, silver and lead, with silver also covered in our page on silver-producing stocks; Sierra Gorda’s EBITDA rose from US$482 million to US$758 million with higher realised metal prices.
- Cons: the Alcoa sale is conditional; the company invested US$711 million in Hermosa in FY26 before it produces; Mozal Aluminium in Mozambique was placed on care and maintenance in March 2026.
We cover a connected topic in AI Mineral Stocks: Copper Miners and Explorers Compared.
Iron ore miners: Fortescue and Mineral Resources
Iron ore is Australia’s largest mining market, and BHP and Rio Tinto above are its two other big names. Fortescue is the pure iron ore play, and Mineral Resources adds contracting and lithium. Our page on iron ore and mining technology explains the products.
Chart
Latest reported iron ore volume by miner
Million tonnes; mixed periods and bases (see caption)
Fortescue (ASX: FMG): iron ore only
Best for: investors who want exposure to one commodity and a cost-per-tonne figure to track.
Fortescue’s FY26 results announcement reports record shipments of 201.3 Mt (FY25: 198.4 Mt), a Hematite C1 cost of US$18.74 per wet tonne (C1 is Fortescue’s measure of operating cost per tonne; read the company’s definition before comparing it with others), underlying EBITDA of US$8.6 billion (up 9%, a 51% margin) and a gross debt to EBITDA ratio of 0.7 times. Total FY26 dividends declared were A$1.08 per share (A$0.62 interim and A$0.46 final).
- Pros: record volumes; low gross debt relative to earnings; a dividend policy of paying out 50 to 80 per cent of underlying profit after tax (65% in FY26).
- Cons: earnings depend on one commodity; a US$525 million non-cash impairment on the Iron Bridge magnetite project cut statutory profit; C1 cost rose 4% from FY25.
Mineral Resources (ASX: MIN): contracting, iron ore and lithium
Best for: investors who want a contracting business and two commodities in one company.
MinRes’s June 2026 quarterly report lists record FY26 volumes: 341 Mt for Mining Services, 29.5 Mt for iron ore and 559 kt of SC6 lithium concentrate sales (Wodgina 317 kt and Mt Marion 242 kt; SC6 means concentrate standardised to 6% lithium oxide). Onslow Iron’s FY26 cost was A$52 per wet tonne, below its A$54 to A$59 guidance. Bald Hill restarted in May 2026, and a final investment decision for a flotation plant and underground mining at Mt Marion was made in the same month for A$490 million (100% basis).
- Pros: record volumes in all three segments; liquidity rose to A$2.4 billion in the June quarter; Onslow’s cost beat guidance.
- Cons: net debt was still about A$4.3 billion; Pilbara Hub’s A$79 per tonne cost finished at the upper end of its A$75 to A$80 guidance; the company changed its injury classification (the 12-month TRIFR would be 7.07 under the new method against 3.33 before) and the company has since announced that its lithium chief executive is resigning.
Gold miners: Northern Star and Evolution
Gold miners are judged on ounces, cost per ounce and the price they receive. AISC, or all-in sustaining cost, is the World Gold Council’s standard measure of what it costs to produce an ounce, including sustaining capital. The World Gold Council put the global average AISC at US$1,785 per ounce in the first quarter of 2026, up 16% on a year earlier. Our page on supply chain challenges in gold mining covers the sourcing side.
Chart
Gold AISC: FY26 against FY27 guidance
A$ per ounce sold; midpoint is the middle of the company’s guidance range
Northern Star Resources (ASX: NST): gold at 1.5 Moz a year
Best for: investors who want gold output of about 1.5 Moz a year, with a large mill project under way.
Northern Star’s June 2026 quarterly report shows FY26 gold sold of 1,543 koz at an AISC of A$2,698 per ounce. The Kalgoorlie centre sold 844 koz, Yandal 434 koz and Pogo in Alaska 265 koz. Its FY26 results show revenue of A$7.6 billion and an average realised price of A$4,925 per ounce, up 26%, with gold sold down 6% from 1.63 Moz.
- Pros: undrawn A$1.75 billion corporate bank facilities (plus US$600 million senior notes) and cash and bullion of A$1.2 billion; the KCGM mill expansion from 13 to 27 Mt a year began commissioning on schedule; a decision on the Hemi project is targeted for late FY27.
- Cons: FY27 guidance of 1,500 to 1,650 koz at an AISC of A$3,050 to A$3,450 per ounce implies higher unit costs; output is weighted to the second half because of shutdowns and the commissioning.
Evolution Mining (ASX: EVN): gold with copper
Best for: investors who want gold plus a copper by-product and a record cash-flow year to read.
Evolution’s FY26 results report 715 koz of gold (FY25: 751 koz), 66 kt of copper (FY25: 76 kt), an AISC of A$1,717 per ounce (FY25: A$1,572) and an achieved gold price of A$6,023 per ounce (FY25: A$4,300). Underlying EBITDA reached A$3,171 million at a 57% margin, and group cash flow A$1,389 million. The balance sheet moved to a small net cash position (A$1,347 million cash and A$1,329 million debt), and the company is now unhedged, meaning it has delivered all of its forward gold sales.
- Pros: record profit and cash flow; no debt repayments due until FY29; a 60% cash-flow payout policy and a record final dividend of 21 cents per share.
- Cons: FY27 guidance has gold at 660 to 730 koz, below FY26, and AISC at A$1,795 to A$1,995 per ounce; the guidance assumes a gold price of A$5,700 per ounce, so results are sensitive to that input.
▶ Follows a gold nugget from rock to ring, showing the steps that sit behind the ounces gold miners report. · 5:27
Lithium and rare earth miners: PLS and Lynas
Lithium and rare earths are the two critical-mineral stories on the exchange. Both have swung sharply with prices, so unit cost and quarterly output matter more than a single annual number. For the lithium sector as a whole, see our ranking of hard-rock lithium producers in Australia and the page on the largest lithium mines.
Chart
Lynas quarterly rare earth production
Tonnes ready for sale, total REO and NdPr
PLS (ASX: PLS): Pilgangoora lithium
Best for: investors who want a single large lithium mine with a clear volume plan.
PLS Group, formerly Pilbara Minerals, reported in its June 2026 quarterly report FY26 spodumene production of 879.5 kt (up 17% from 754.6 kt) and an average realised price of US$1,488 per tonne against US$672 a year earlier. The FOB unit operating cost (cost loaded onto a ship) fell to A$569 per tonne from A$627, cash margin from operations reached A$1,356 million, and net cash was A$1,344 million at 30 June 2026 after a US$600 million bond. The Ngungaju plant began restarting on 1 July 2026, and FY27 production is guided at 1,030 to 1,100 kt.
- Pros: production above the top of guidance; a large increase in cash margin; A$175 million of pre-decision spending was approved in June for the P2000 expansion study.
- Cons: one mine and one product; FY27 unit cost is guided up to A$575 to A$625 per tonne; September-quarter output will be lower while the plant ramps up.
Lynas Rare Earths (ASX: LYC): rare earths outside China
Best for: investors who follow rare earth supply chains and can read quarterly volatility.
Lynas’ June 2026 quarterly report shows total rare earth oxide (REO) production of 3,481 t, including 1,857 t of NdPr (neodymium-praseodymium, the oxide used in magnets), plus 19 t of dysprosium and terbium and first samarium output. Closing cash was A$1,209 million. In March 2026 Malaysia renewed its operating licence for 10 years, as Reuters reported.
- Pros: production in Western Australia and Malaysia; new heavy rare earth and samarium products; a large cash balance.
- Cons: NdPr swung between 1,404 t and 2,080 t across five quarters, and the June quarter was affected by ore concentrate quality and a new water-recycling plant at Mt Weld; the Malaysian licence carries waste-treatment conditions.
Iluka (ASX: ILU) is the other rare earth name on the exchange. Its June 2026 quarterly review puts spending on the Eneabba refinery at A$1,101 million against a A$1.7 to 1.8 billion estimate, with construction near 60% complete.
How to compare ASX miners on their filings
Most mistakes come from comparing numbers that are not like for like. Before putting two companies side by side, check these items in each report.
- Basis. BHP’s iron ore is 256.9 Mt on its share and 291.2 Mt on a 100% basis. Rio and Fortescue quote 100%. Always check which one a table uses.
- Period. Rio reports on a calendar year, the rest on a June year, so annual figures cover different months.
- Currency. BHP, Rio, Fortescue and South32 report in US dollars; Northern Star, Evolution, PLS, MinRes and Lynas report in Australian dollars.
- Cost definitions. AISC follows World Gold Council guidance, but C1 cost, FOB unit cost and cash cost are company-defined. Read the footnotes.
- Guidance. A guidance range is the company’s own forecast. FY27 guidance for BHP copper, NST gold and Evolution gold already points to lower volume or higher unit cost than FY26.
- Balance sheet. Net cash or net debt (Evolution small net cash, MinRes about A$4.3 billion net debt) says how a company copes with a price fall.
The calculator below turns three numbers from a gold miner’s report into a margin per ounce. Use your own price and the company’s reported AISC; the defaults are round examples and not any one company’s figures.
Calculator
What margin does an ounce of gold leave?
Enter ounces sold, a price and the AISC from a company report.
- Operating margin (A$ million): 2,500 A$m
- Illustrative after-tax margin (A$ million): 1,750 A$m
- Margin as share of price: 50.0 %
Example values only, not any company’s figures or a forecast. Price is an input: example, use today’s price (A$ per ounce). AISC follows the World Gold Council definition and is read from the company’s report. The margin excludes interest, growth capital, and any hedging; the tax rate is an input to confirm with an adviser.
What the filings do not show: risk and ground truth
The filings above show what mines produced. They do not show the grade of a deposit still in the ground, or whether an expansion will perform like the pilot. Other risks are visible in the reports: copper grade decline at Escondida, higher diesel prices and inflation that BHP cited as cost headwinds, a conditional asset sale at South32, and a Mt Weld ore-quality problem at Lynas. Our page on the most sustainable mining companies covers the environmental side that investors also weigh.
Satellite data can add one more layer. Farmonaut maps licence areas from space to help rank exploration targets; the result is an exploration target, not a resource estimate, and does not replace drilling.

▶ Explains how satellites map the rock and alteration around gold rather than the gold itself. · 4:25
Frequently asked questions
What are the best mining stocks on the ASX?
There is no single best one. The ASX miners with the largest reported output are BHP and Rio Tinto for iron ore and copper, Fortescue for iron ore, Northern Star for gold, PLS for lithium and Lynas for rare earths. Which suits you depends on the commodity you want exposure to, your tolerance for price swings and your tax position, so speak to a licensed adviser.
Which ASX mining stocks are the biggest?
BHP and Rio Tinto report the largest volumes, but their periods differ: Rio shipped 326.2 Mt from the Pilbara in calendar 2025 and BHP’s WAIO produced 291.2 Mt (100% basis) in the year to June 2026, so the two are not a like-for-like ranking. Size by market value changes daily and is not given here; check the ASX website for a dated figure.
Which ASX mining stocks are gold miners?
Northern Star Resources (NST) and Evolution Mining (EVN) are the two covered here. Our pages on ASX gold and silver miners and global gold miners cover more of them.
Which ASX mining stocks produce lithium?
PLS (Pilgangoora) and Mineral Resources (Wodgina, Mt Marion and Bald Hill) are the two here. Rio Tinto also produces lithium, with 2026 guidance of 61 to 64 kt of lithium carbonate equivalent, but it is mainly an iron ore and copper company.
What does AISC mean for a gold miner?
All-in sustaining cost is the World Gold Council’s standard measure of the cost to produce an ounce, including mining, processing, royalties, sustaining capital and corporate costs. Companies report it per ounce sold; compare it with the price they receive to see the margin.
Do ASX miners report in Australian dollars?
Some do and some do not. BHP, Rio Tinto, Fortescue and South32 report in US dollars, while Northern Star, Evolution, PLS, Mineral Resources and Lynas report in Australian dollars. Convert before comparing.
When do ASX miners publish their results?
Most have a 30 June year end and publish quarterly activity reports in late July, October, January and April, with annual results in August. Rio Tinto has a 31 December year end and published its third-quarter 2026 review on 14 October 2026.
Are all ASX mining stocks Australian companies?
No. Rio Tinto is dual-listed in London and Sydney, and several smaller ASX miners operate mainly overseas. Listing location does not tell you where the mines are, so check the asset list in each report.
Do ASX mining stocks pay dividends?
Some do. In FY26 Fortescue declared A$1.08 per share in total and Evolution declared a record final dividend of 21 cents per share. Dividends are decided by each board and depend on commodity prices, so past payments are not a guide to future ones.
Is this investment advice?
No. The page summarises company filings for information. It does not weigh your goals, tax or risk tolerance, and it does not predict prices. Check each source and speak to a licensed adviser before you invest.
This page is for information only. It is not investment advice. It does not consider your goals, tax or risk tolerance, and it gives no share prices or targets. Check each company’s own reports and speak to a licensed adviser before you invest.
Farmonaut mining
See a licence area from space before drilling
Investors can see how satellite data screens a licence area for minerals as an exploration target, ahead of a resource estimate.
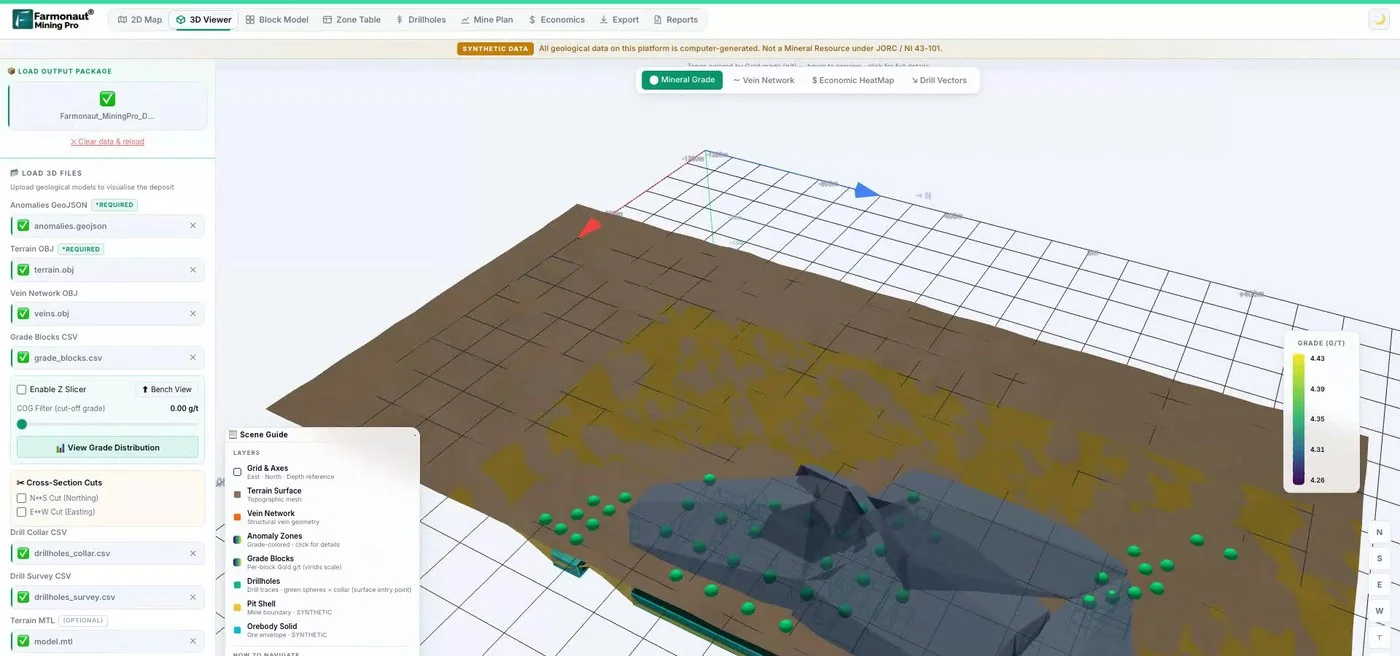
Mining Pro sample view, synthetic data
Keep reading
Sources
- USGS, Mineral Commodity Summaries 2026: Iron Ore: pubs.usgs.gov
- USGS, Mineral Commodity Summaries 2026: Lithium: pubs.usgs.gov
- USGS, Mineral Commodity Summaries 2026: Gold: pubs.usgs.gov
- USGS, Mineral Commodity Summaries 2026: Copper: pubs.usgs.gov
- USGS, Mineral Commodity Summaries 2026: Rare Earths: pubs.usgs.gov
- BHP, Operational review for the year ended 30 June 2026 (ASX, 16 Jul 2026): announcements.asx.com.au
- Rio Tinto, Fourth quarter 2025 production results (ASX, 21 Jan 2026): announcements.asx.com.au
- Rio Tinto, Third quarter 2026 production results (14 Oct 2026): riotinto.com
- South32, Annual Report 2026 (ASX, 27 Aug 2026): announcements.asx.com.au
- Fortescue, FY26 full year results (ASX, 20 Aug 2026): announcements.asx.com.au
- Mineral Resources, Q4 FY26 Quarterly Activity Report (29 Jul 2026): mineralresources.com.au
- Northern Star Resources, June 2026 Quarterly Activities Report (29 Jul 2026): nsrltd.com
- Northern Star Resources, FY26 financial results (20 Aug 2026): nsrltd.com
- Evolution Mining, FY26 full year results (ASX, 19 Aug 2026): announcements.asx.com.au
- PLS Group, June 2026 Quarterly Activities Report (ASX, 30 Jul 2026): announcements.asx.com.au
- Lynas Rare Earths, Quarterly Report June 2026 (ASX, 22 Jul 2026): announcements.asx.com.au
- Iluka Resources, Quarterly review to 30 June 2026 (ASX, 28 Jul 2026): announcements.asx.com.au
- Reuters via Kitco, Malaysia renews Lynas operating licence for 10 years (2 Mar 2026): kitco.com
- World Gold Council, Record gold prices outpace rising mining costs, Q1 2026: gold.org
Discussion
Questions, corrections or field experience? Share them below. First-time comments are reviewed before they appear, and your email is never published.
No comments yet. Be the first to add a question or your experience.

 Kidepo Associates
 GKY Mining
 Alkimy SARL
 Double A Trading
 GemSprout Metals Limited
 Qader Group
 Ileys General Trading
 SG Gold Mining LLC
 VRV Global Pte Ltd
 Omsri International FZE
 G.I.T.T.
 Jaunita Erss Ltd
 Almosi SARL
 SRK Consulting
 Berks Gold Limited
 Mwerezi Minerals Company Limited
 Mining SARL
 SenGold Invest SAS
 Sean Mining Limited

 Exploration consultancy · South Africa · Gold










