

Mining finance · Project lifecycle guide
Lassonde Curve: 7 Stages, Real Timelines and a Calculator
The Lassonde curve maps a mining company’s value through seven stages, with peaks at discovery and in production and a long dip, the orphan period, between them. Gold mines averaged 15.2 years from discovery to production in S&P Global’s 2024 study.
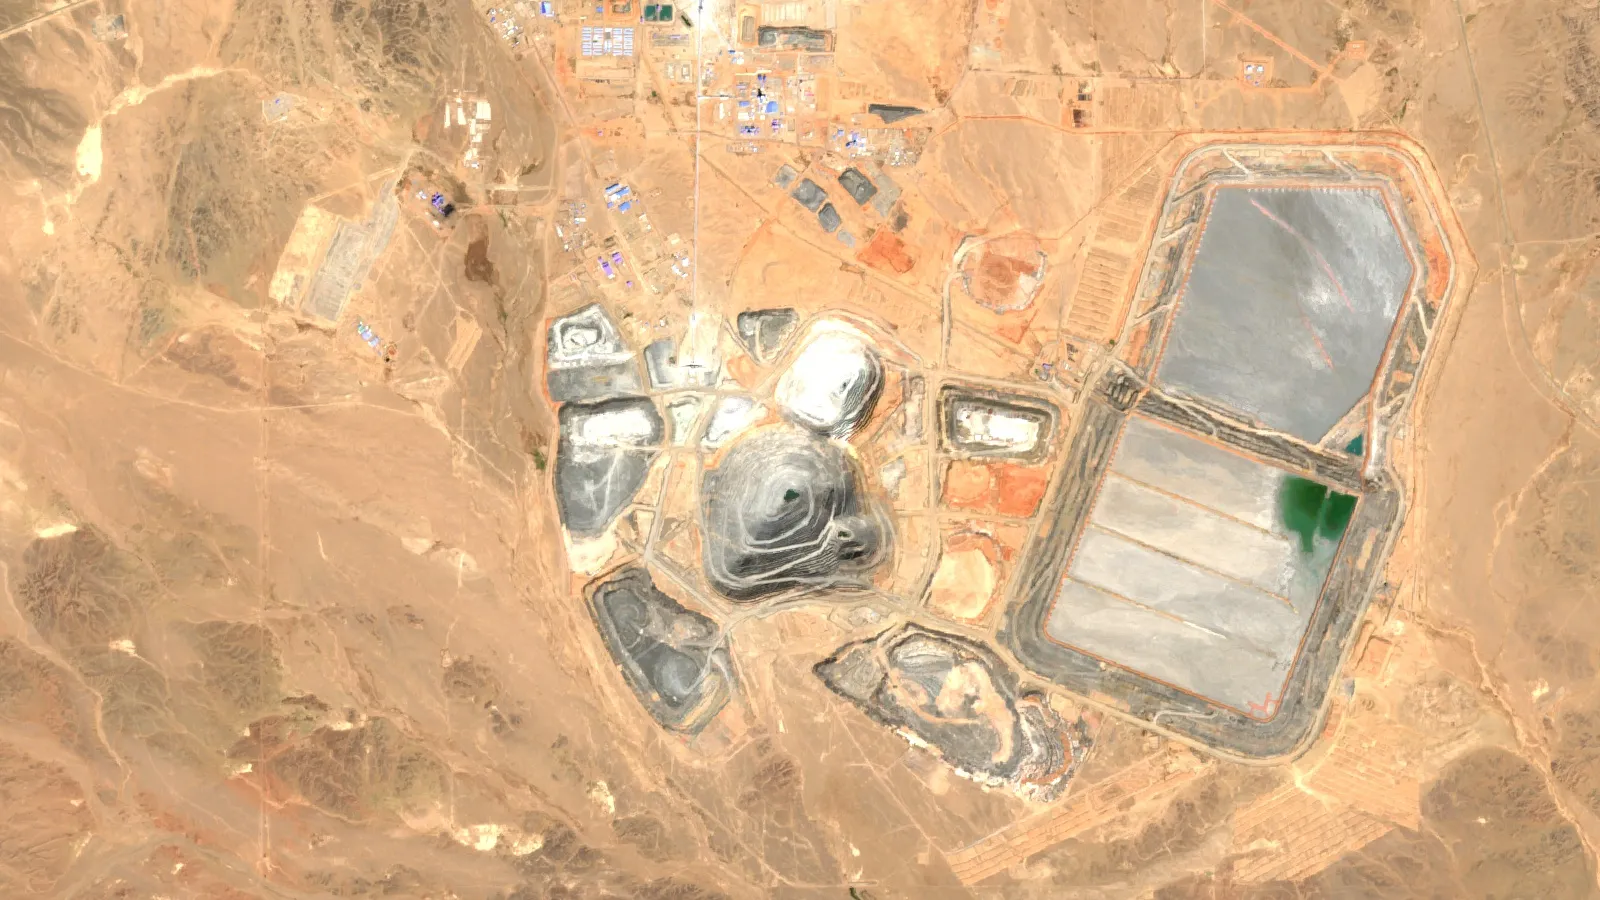
Key takeaways
- The curve has two peaks, at discovery and in production, with the orphan period between them (Visual Capitalist).
- S&P Global’s 2024 study of 268 mines gave gold an average of 15.2 years from discovery to production and nickel 17.5.
- Country averages ran from roughly 10 to 15 years in Ghana, the DRC and Laos to 34 years in Zambia.
- In 2025, grassroots work took a record low 21% of exploration budgets and mine-site work a record 45% (S&P data, via MiningVisuals).
- Dilution can cut a holder’s result even when the deposit gains value: test it in the calculator.
In this article
- What the Lassonde curve shows
- The 7 stages of the Lassonde curve
- Who is Pierre Lassonde?
- How long each part of the curve takes
- Where exploration money sits today
- How the gold price moves the curve
- Using the curve to advise a client or review a project
- What licence owners and investors should take from it
- Limits of the Lassonde curve
- Operations, ESG and tools across the stages
- Frequently asked questions
The Lassonde curve is a chart of how a mining company’s share value tends to move from first idea to worked-out mine. It has two peaks: one at discovery and one in production, with a long dip between them called the orphan period. Visual Capitalist’s version splits the path into seven stages, and it is named after the gold investor Pierre Lassonde.
The curve is a pattern, not a formula. It has no fixed values on its axes and no promise that any one project will follow it. Its use is practical: it tells a consultant, licence owner or investor what kind of risk is being priced at each stage, and what evidence moves a project to the next one. Below you will find the stages, real timelines, current exploration spending and a dilution calculator for testing a stake through the dip.
What the Lassonde curve shows
The horizontal axis is time. The vertical axis is the market value of the company or project. Value starts low, rises on drilling success, sags while the project is studied and financed, rises again as the mine proves it can make money, and falls as ore runs out.
The theory rests on one idea: share prices react to changes in risk and to the arrival of news, not only to the metal in the ground. Exploration results come often and are exciting. Engineering studies and permit reviews are slow and quiet. So a deposit can be better understood than ever while its shares drift lower. That gap between knowledge and price is what the shape tries to capture.
The 7 stages of the Lassonde curve
| Stage | What happens | Main risk | Usual value direction | Evidence a consultant should ask for |
|---|---|---|---|---|
| 1. Concept | Geologists test a theory with mapping and sampling | No deposit exists | Lowest point | Title documents, geological model, surface sampling |
| 2. Pre-discovery | First drilling; speculation builds | Drill holes miss | Rising | Drill plan, targets, quality control on assays |
| 3. Discovery | Drill results confirm a deposit | Results do not repeat or scale | First peak | True widths, grades, continuity between holes |
| 4. Feasibility | Engineering, permitting and financing studies | Economics or permits fail | Falling or flat | Metallurgy, resource report, permit schedule |
| 5. Development | Money is raised and the mine is built | Cost overruns, dilution | Low, then recovering | Funding plan, budget against spend, contracts |
| 6. Startup and production | Ore is processed and revenue arrives | Ramp-up shortfall | Second peak | Recovery, unit costs, output against plan |
| 7. Depletion | Reserves run down | Closure liabilities | Declining unless ore is added | Reserve life, closure estimate, near-mine drilling |
Infographic
The curve in 7 stages
- 1ConceptTest a theory.
- 2Pre-discoveryFirst drilling.
- 3DiscoveryFirst peak.
- 4FeasibilityThe quiet dip.
- 5DevelopmentFund and build.
- 6ProductionSecond peak.
- 7DepletionValue fades.
The stage names follow Visual Capitalist. The risk and evidence columns are our own working summary for reviewing a project, not part of the original chart. Grade here means the amount of metal per tonne of rock, usually in grams per tonne (g/t) for gold.
Why the first peak forms
At discovery, the largest single unknown has just been removed: whether there is a deposit at all. Early holders have often paid very little, so many sell into the excitement. This is why the theory says the largest gains tend to go to those who hold before or at discovery. It says nothing about the far larger number of exploration projects that never reach that point, which is the survivor problem any reader should keep in mind.
Why the orphan period happens
After discovery, the speculators who came for drill news leave. The people who buy producing mines for income are not ready to arrive, because there is no income. The project is left without a natural owner, hence “orphan”. Meanwhile the company must spend heavily on studies, and often sells new shares to pay for them.
A resource report is a formal estimate of tonnes and grade. In Canada, public disclosure of it falls under National Instrument 43-101, the mineral project rule that Canadian securities regulators proposed to replace in June 2025. Elsewhere, the JORC Code plays a similar part, and our guide to JORC reports explains how to read one.
Why a second peak follows
Once the plant runs and revenue arrives, a different group of buyers can value the company on cash flow. A project that was judged on drill holes is now judged on ounces sold and cost per ounce. Fruta del Norte in Ecuador shows what this stage looks like: Lundin Gold’s mine is listed just outside the top 20 with 498.3 thousand ounces of 2025 output in a Mining.com ranking of gold mines, and Newmont reports a 32% interest in Lundin Gold in its 2025 annual filing.
▶ How gold is mined and refined, step by step, for the production stage. · 5:27
Who is Pierre Lassonde?
Pierre Lassonde is a Canadian businessman and philanthropist, born in Quebec in 1947. He studied electrical engineering in Montreal, took an MBA at the University of Utah in 1973 and earned the CFA charter in 1983. After his MBA he worked at Bechtel and Rio Algom, and from 1980 was a mining analyst and precious-metals portfolio manager at Beutel, Goodman.
The University of Utah’s institute that carries his name says he launched Franco-Nevada in 1983 with Seymour Schulich. Franco-Nevada made its first royalty investment in 1986. A royalty is a right to a share of a mine’s revenue or output, usually without paying its running costs. That business gave its founders an unusually long view of projects across every stage. Franco-Nevada was later valued at $2.5 billion in a deal with Newmont, and Lassonde served as Newmont’s president from 2002 to 2007.
If you are valuing a royalty rather than shares, the risks sit differently along the curve. Our guide on selling mineral royalties covers that side of the market.
How long each part of the curve takes
The most common mistake with this chart is reading it as a short trip. An S&P Global study of 268 mines, reported in July 2024, put gold as the fastest metal from discovery to production at an average of 15.2 years, with nickel the slowest at 17.5 years. Most of those mines are operating, so the averages leave out projects that never got built. The International Energy Agency’s 2021 critical minerals analysis reached a similar figure, 16.5 years on average from discovery to first production.
Chart
Two projects measured in calendar years
Oyu Tolgoi: discovery to first concentrate. Great Bear: takeover close to targeted first gold.
Chart
Average years from discovery to production
Selected countries, S&P Global study of 268 mines
Location changes the answer more than metal does. The same study gave averages of 34 years for Zambia and 29 years for the US, against 20 years for Australia and roughly 10 to 15 years for Ghana, the Democratic Republic of the Congo and Laos. For anyone holding through the dip, those are the difference between one financing cycle and several.
Two real projects on the clock
Oyu Tolgoi in Mongolia is the usual teaching example. Its reference history gives discovery in 2001, construction from 2010 and first concentrate in 2013. That same record shows the build estimate rising from US$4.6 billion in 2010 to about US$10 billion by 2013, which is the development-stage risk in one line.
Great Bear in Red Lake, Ontario, shows how a buyer can step in during the gap. Kinross offered about C$1.8 billion (about US$1.42 billion) for Great Bear Resources in December 2021 and closed in February 2022, with first gold targeted for late 2029. By its second-quarter 2026 results, Kinross said advanced exploration construction there was about 93% complete. For the seller’s shareholders, that takeover ended the wait early; the remaining study, permit and build risk passed to the acquirer.
Where exploration money sits today
The early left side of the curve depends on money willing to take grassroots risk, and that money is scarce relative to mine-site spending. MiningVisuals’ summary of S&P Global’s World Exploration Trends 2026 gives a global nonferrous budget of US$12.40 billion for 2025, down 0.6%. Gold took US$6.2 billion, half the total, and copper US$3.3 billion.
Chart
Share of 2025 exploration budgets by work type
Percent of budgets; other work is the remainder we calculated
Chart
Exploration budgets by metal, 2025
US$ billion, global nonferrous budgets, selected metals
The same summary puts drilling at or next to existing mines at a record 45% of budgets and grassroots work at a record low of 21%. Junior and intermediate companies raised US$21.43 billion, more than double the previous year, with money directed heavily to project development. Together those figures suggest more capital is chasing projects with existing deposits than brand-new concepts. That is an inference from one year’s data, not a permanent rule.
How the gold price moves the curve
A rising metal price lifts the whole curve, but not evenly. Projects without cash flow tend to respond sharply because their value depends on a distant, uncertain margin. A higher price can also bring marginal deposits into consideration and make equity easier to raise. A falling price does the reverse, and can lengthen an orphan period because financing dries up.
Spot gold was about US$4,125 an ounce on 5 November 2026 (Trading Economics), up 3.71% from a year earlier and well below the all-time high of about US$5,608 reached in January 2026. Those moves are the reason to run any project at several prices rather than one. A study priced at the top of a range gives a very different answer from one priced near the long-run trend.
Using the curve to advise a client or review a project
For a consultant, the chart works best as a checklist for three questions: where is this project, what must happen next, and who pays for it?
- Place the project on evidence, not on the company’s slides. A deck that says “advanced” with no metallurgical work is still early. Use the evidence column in the stage table above.
- List the next value event and its date. It might be a drill result, a resource update, a permit decision or a financing. If nothing is scheduled for two years, that is the orphan period in practice.
- Estimate the money needed to reach that event. Compare it with cash on hand. The shortfall will most likely be filled by new shares, debt, a royalty sale or a partner.
- Model dilution. Dilution means your percentage falls because new shares are issued. A correct view of the deposit can still lose money if the stake shrinks faster than value grows. The calculator below tests this.
- Check the jurisdiction’s timeline. Use the S&P lead times as a starting point, and then ask for the actual permit steps in that country.
- Check the land. Title, surface rights, protected areas and nearby settlements can stop a good deposit. The video below shows how much of an anomaly can sit in unusable ground.
- Decide the exit. Sale to a major, a joint venture, a royalty sale or building the mine each suit different stages. Our guide on how to sell a mine walks through the seller’s side.
Satellite imagery can help at the concept stage and in land checks, by mapping alteration, structure and surface access before a drill rig is paid for. Results of that kind are exploration targets, not resource estimates, and they do not replace drilling. Farmonaut offers this kind of screening among other providers.
Calculator
What does dilution do to your stake through the orphan period?
Enter your own stake, company value and funding needs. All money is in US$.
- Your stake at entry (%): 0.02
- Your stake after the raise (%): 0.01
- Multiple of money invested: 4.00
- Simple gain or loss per year (US$): $3,750
Example values only, not a benchmark or forecast. New money is assumed to be raised in one round at the value you enter, with no debt, tax or fees. Future value is your own assumption.
What licence owners and investors should take from it
If you own a licence or claim
Your negotiating position changes along the curve. Before drilling, a buyer pays for geological ideas and clean title. After a confirmed discovery, a buyer pays for ounces in the ground, discounted for the study and permit work still needed. Selling or partnering during the quiet stage often brings a lower price than the discovery headlines suggested. It can still be right if the alternative is years of funding you cannot provide. Our overview of what makes a mine profitable sets out the numbers a buyer will test.
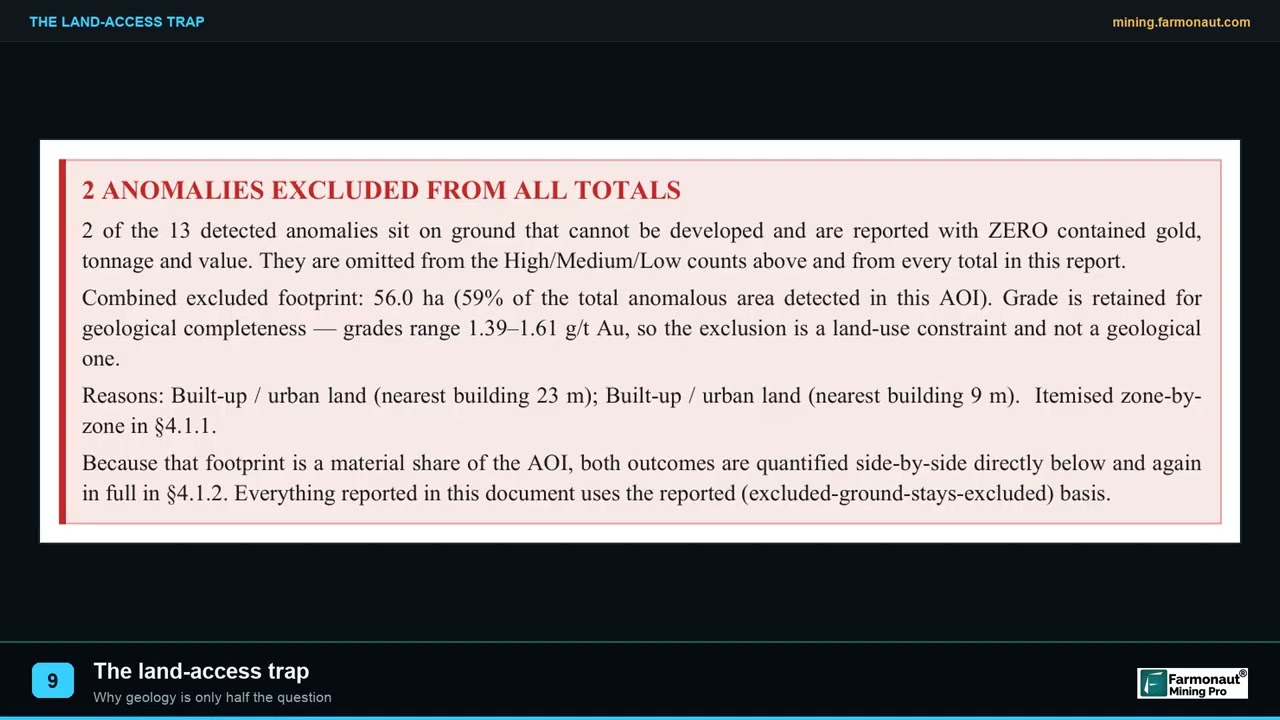
▶ Why land access can block otherwise attractive ground. · 2:05
If you invest in mining shares
The theory describes two commonly discussed entries: before or at discovery, or during the orphan period with a hold into production. Each has a matching failure. The first can end with a dry hole. The second can end with a study that disappoints, a blocked permit or repeated share issues. Spreading exposure, checking cash runway and reading the technical reports are the ordinary defences. To see who sits at the producing end, look at our list of large gold and copper miners.
Limits of the Lassonde curve
- Survivor bias. The curve follows projects that make it. Most exploration projects end long before a mine exists.
- Shares are not assets. Dilution, debt and management decisions separate the deposit’s value from the shareholder’s outcome.
- Timing does not repeat. As the S&P figures show, the same stage can take very different lengths of time by country.
- Takeovers shorten the path. A buyer can end the public story at any point, as Great Bear shows.
- Depletion is not always the end. Mine-site drilling can add ore and delay the decline, which helps explain why near-mine spending has grown.
- Closure costs arrive late. Reclamation, meaning the repair of mined land, is a real liability at the right edge of the chart. It should be in the model well before that stage.
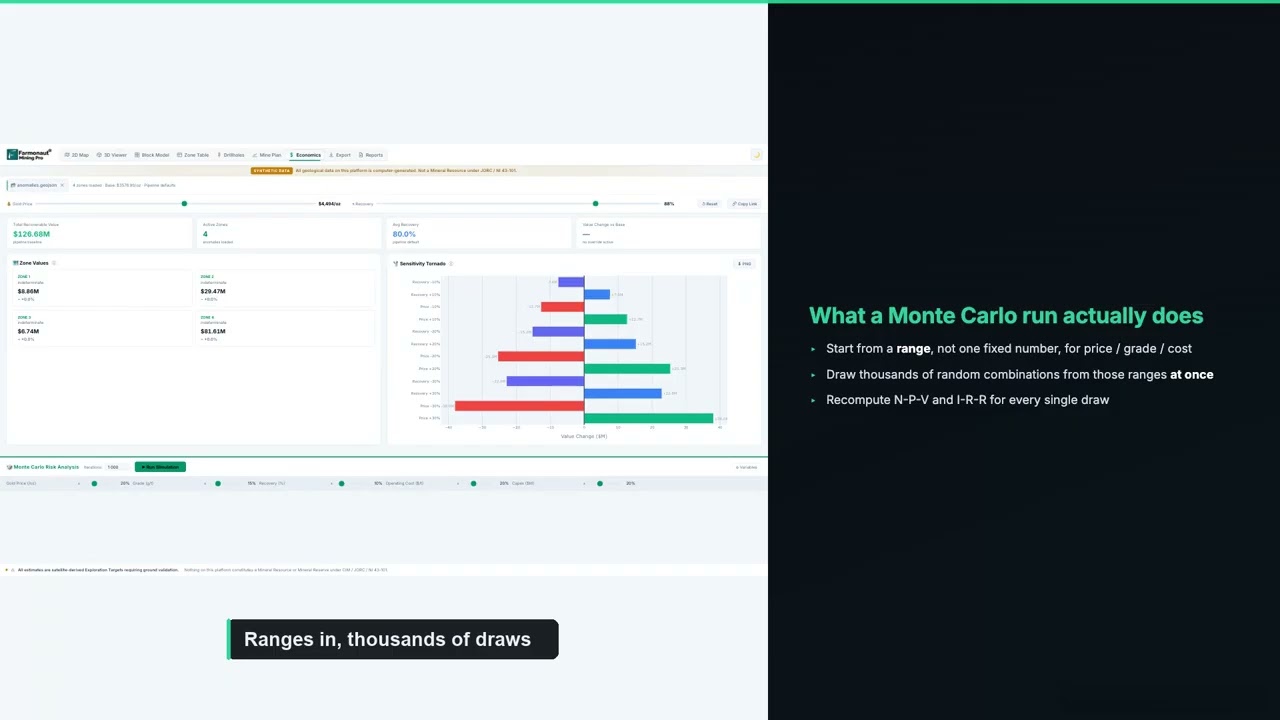
▶ How Monte Carlo P10, P50 and P90 ranges describe project uncertainty. · 14:59
Operations, ESG and tools across the stages
ESG (environmental, social and governance) work does not sit in one stage. Community relations and baseline studies start early, permits dominate the middle, and closure planning matters at the end. Weak work at any point tends to show up as delay, which on this chart means a longer dip.
Operational tools become relevant from development onward. Our review of drill and blast monitoring software covers one such category. Farmonaut also has general pages on carbon footprinting, product traceability, fleet management and its satellite and weather API.
Frequently asked questions
What is the Lassonde curve?
It is a chart of how a mining company’s value tends to change over a project’s life, from concept through discovery, studies, construction and production to depletion. It has two peaks with a dip between them.
What is the orphan period in mining?
It is the dip after discovery, when studies, permits and financing take years and produce little news. Speculators have sold and income buyers have not yet arrived, so the shares often drift lower.
Who created the Lassonde curve?
Visual Capitalist credits the chart to Pierre Lassonde, the Canadian investor who built Franco-Nevada with Seymour Schulich and later served as Newmont’s president.
What is the Lassonde curve theory for investors?
The theory holds that the strongest gains tend to come before or at discovery, or from buying during the orphan period and holding into production. It describes a tendency among surviving projects and does not predict any single share.
Is the Lassonde curve only for gold?
No. It is most often discussed for gold, but the same stages apply to copper, lithium, nickel and other mined commodities. Timing differs: S&P’s 2024 study gave 15.2 years for gold and 17.5 for nickel.
How long does it take a mine to go from discovery to production?
S&P Global’s study of 268 mines gave averages from roughly 10 to 15 years in the fastest countries to 34 years in Zambia. Gold averaged 15.2 years worldwide.
How does dilution affect the curve?
The curve is often drawn for company value, while you own a percentage. If a company issues many shares to fund a mine, your slice shrinks. Your result depends on both the value gained and the share of it you keep.
What is the Lassonde Kurve?
It is the German name for the same chart. The stages and the reasoning are identical.
Can the curve tell me when to sell?
No. It can help you ask what risk is left and which event comes next, but actual prices depend on the deposit, the metal price and the market for financing.
Where does a royalty company fit on the curve?
A royalty can be bought at any stage. An early one is cheap but may never pay, and a later one costs more but is closer to revenue. Royalty holders usually do not fund construction, which limits their exposure to dilution and cost overruns.
More from Farmonaut: crop loan and insurance, mining cost curve 2025 cost to mine gold insights.
This page is for information only. It is not investment advice.
Farmonaut mining
Map your mining site before the next stage
Screen a project area from satellite data when you review where it sits on the curve; results are exploration targets ahead of any resource estimate.

Mining Pro sample view, synthetic data
Keep reading
Sources
- Visual Capitalist, The life cycle of a mineral discovery: visualcapitalist.com
- Mining.com, S&P Global US mine development timelines (July 2024): mining.com
- MiningVisuals, 2025 global exploration budget by commodity (March 2026): miningvisuals.com
- IEA, The Role of Critical Minerals in Clean Energy Transitions, executive summary (2021): iea.org
- University of Utah, About Pierre Lassonde: lassonde.utah.edu
- Wikipedia, Pierre Lassonde: en.wikipedia.org
- Wikipedia, Franco-Nevada: en.wikipedia.org
- Wikipedia, Oyu Tolgoi mine: en.wikipedia.org
- Wikipedia, Kinross Gold: en.wikipedia.org
- Kinross Gold, Q2 2026 results: s204.q4cdn.com
- Trading Economics, Gold (5 November 2026): tradingeconomics.com
- Mining.com, World’s top 20 largest gold mines: mining.com
- Newmont, 2025 Form 10-K: s24.q4cdn.com
- Canadian Mining Journal, Newmont sells Coffee gold project: canadianminingjournal.com
- Canadian Securities Administrators, NI 43-101 request for comment (June 2025): osc.ca
Discussion
Questions, corrections or field experience? Share them below. First-time comments are reviewed before they appear, and your email is never published.
No comments yet. Be the first to add a question or your experience.

 Enterprise Takreem
 Sean Mining Limited
 NTS Group (Pty) Ltd
 Mine4Africa
 Lithspo Minerals Limited
 Tintina Mining Group
 Dalgety Minerals Pty Ltd
 Vortex Minerals Pty Ltd
 Faith At Work (Pty) Ltd
 Geotech Mining Solutions plc
 Vulcan International Limited
 Kidepo Associates
 GKY Mining
 Alkimy SARL
 Double A Trading
 GemSprout Metals Limited
 Qader Group
 Ileys General Trading
 SG Gold Mining LLC
 VRV Global Pte Ltd
 Omsri International FZE
 G.I.T.T.
 Jaunita Erss Ltd
 SRK Consulting
 Berks Gold Limited

 Client · Tanzania · Gold










