

Peru and Zambia copper · Mine guide
Las Bambas Copper Mine: Output, Owners and Costs
Las Bambas made 410,834 tonnes of copper in 2025 and MMG guides to 380,000 to 400,000 tonnes for 2026. Owners, quarterly output, costs, blockades, and how it compares with Zambia’s Lubambe mine.
Key takeaways
- Las Bambas produced 410,834 t of copper in concentrate in 2025, up 27% on 2024 (MMG, Q4 2025 report).
- MMG owns 62.5%, Guoxin 22.5% and CITIC Metal 15%; MMG operates the mine (MMG, mine page).
- C1 cost was US$1.12 per lb in 2025 and US$0.55 per lb in the first half of 2026, helped by gold and silver credits; MMG now guides 2026 C1 to US$0.85 to US$1.05 per lb (MMG, Q2 2026 report).
- Peru ranks third in world copper mine output at 2.7 Mt in 2025, behind Chile and the DR Congo (USGS, 2026).
- Lubambe in Zambia is owned by JCHX (70%) and ZCCM-IH (30%); Zambia made 890,346 t of copper in 2025 (Reuters, 2026).
In this article
- Las Bambas copper mine at a glance
- Who owns Las Bambas
- How much copper does Las Bambas produce each quarter
- Las Bambas costs, by-product credits and a margin calculator
- Road blockades and community relations at Las Bambas
- Where Las Bambas sits in world copper
- Lubambe Copper Mine in Zambia: owners, output and plans
- Las Bambas and Lubambe side by side
- How satellites help monitor a large open-pit mine
- How to check any copper mine's figures yourself
- Mining terms used on this page
- Frequently asked questions
The Las Bambas copper mine is an open-pit mine more than 4,000 metres above sea level in the Apurímac Region of Peru. MMG Limited operates it and owns 62.5% of the project. It produced 410,834 tonnes of copper in concentrate in 2025, its second-best year on record, and MMG guides to 380,000 to 400,000 tonnes for 2026 (MMG, fourth quarter 2025 production report). This guide gives the owners, the output by quarter, the cost per pound, the history of road blockades and a calculator for the margin at your own copper price. It also covers Lubambe, an underground copper mine in Zambia, so you can compare the two.
Las Bambas copper mine at a glance
The figures below come from MMG’s own mine page and its quarterly reports. “Copper in concentrate” means the copper metal contained in the concentrate the mine ships, not the weight of the concentrate itself. Concentrate is the product of crushing, grinding and flotation: a powder far richer in copper than the raw ore.
| Item | Detail | Source and date |
|---|---|---|
| Location | Near Challhuahuacho, between the Cotabambas and Grau provinces, Apurímac Region, Peru | MMG mine page |
| Mine type | Large open pit; concentrate leaves by truck to a transfer station, then by rail to the port of Matarani | MMG mine page |
| Owners | MMG 62.5%, Guoxin International Investment 22.5%, CITIC Metal 15%; MMG operates | MMG mine page |
| First commercial production | 2016 | MMG mine page |
| Copper in concentrate, 2025 | 410,834 tonnes, up 27% on 2024 | MMG, Q4 2025 report |
| Guidance for 2026 | 380,000 to 400,000 tonnes (unchanged in July 2026; MMG expects the upper end) | MMG, Q2 2026 report |
| By-products, 2025 | 85,604 oz gold, 5.26 million oz silver, 2,910 t molybdenum | MMG, Q4 2025 report |
| Estimated mine life | More than 18 years | MMG mine page |
| Workforce | 10,635 direct and indirect employees, 98% Peruvian nationals on site | MMG mine page |
Molybdenum is a metal used to harden steel. At Las Bambas it is a by-product, so the mine earns money from it without mining for it. The same goes for the gold and silver that travel in the copper concentrate.
Who owns Las Bambas
Minera Las Bambas S.A. belongs to a consortium led by MMG Limited, a Hong Kong-listed company. MMG holds 62.5%, Guoxin International Investment holds 22.5% and CITIC Metal holds 15%, and MMG operates the mine (MMG, Las Bambas operation page). The consortium agreed in April 2014 to buy the project from Glencore Xstrata for US$5.85 billion (Fastmarkets, 14 April 2014), and commercial production began in 2016.
Peru’s state agency Activos Mineros (AMSAC) supervises the contractual commitments tied to the transfer of Las Bambas to private investors, alongside projects such as Toromocho and Bayóvar (IISD, Peru country profile).
The owners matter for one practical reason. Nearly all of the mine’s copper is sold as concentrate to smelters, so the revenue follows the copper price and the treatment charges that smelters take, not a fixed contract. Treatment and refining charges (TC/RCs) are the fees a smelter keeps for turning concentrate into metal. MMG reported that spot TC/RCs averaged negative US$66.6 per tonne in the December 2025 quarter, which means smelters were paying miners to get concentrate (MMG, fourth quarter 2025 production report).
How much copper does Las Bambas produce each quarter
Output is steady at around 100,000 tonnes of copper a quarter, and the first half of 2026 totalled 210,195 tonnes, level with the first half of 2025. The fourth quarter of 2025 gave 97,322 tonnes, the first quarter of 2026 gave 101,003 tonnes and the second quarter of 2026 gave 109,192 tonnes, down 5% on a year earlier but up 8% on the first quarter; the first half totalled 210,195 tonnes (MMG, first quarter 2026 report; MMG, second quarter 2026 report). The chart shows those three quarters.
Chart
Las Bambas copper by quarter
Tonnes of copper in concentrate
Three numbers explain most of the movement:
- Ore milled grade. Grade is the share of copper in the rock. It fell to 0.76% in the fourth quarter of 2025 from 0.92% a year earlier, and held at 0.88% in the first quarter of 2026.
- Throughput. A record 14.31 million tonnes of ore were milled in the fourth quarter of 2025, helped by softer ore from the Ferrobamba pit.
- Recovery. Recovery is the share of the copper in the ore that ends up in the concentrate. It reached 89.5% in the first quarter of 2026, against 88.1% a year earlier.
MMG says the 2025 total, up 27% on 2024, was the second-highest in the mine’s history and above the top of its guidance.
Las Bambas costs, by-product credits and a margin calculator
The industry’s standard cost figure is C1 cost: the cash cost of mining, milling, shipping and selling the copper, minus the money earned from by-products, per pound of payable copper. Las Bambas reported C1 costs of US$1.12 per pound for 2025, below its revised range of US$1.25 to US$1.35, because gold and silver prices were high. MMG first guided 2026 C1 to US$1.20 to US$1.40 per pound. The first quarter came in at US$0.45 per pound and the first half at US$0.55, because of higher gold and silver output and prices, so in July 2026 MMG cut the 2026 range to US$0.85 to US$1.05 per pound (MMG, second quarter 2026 report; MMG, first quarter 2026 report).
Chart
LME copper price, quarterly average
US$ per tonne, 2025 quarters
That is why copper price alone does not decide the margin. A by-product credit is revenue from gold, silver or molybdenum that is subtracted from the cost of producing copper. When gold is high, the credit is large and the C1 number looks low; when gold falls it rises again. C1 also leaves out sustaining capital, depreciation, royalties and tax, so it is not profit.
The London Metal Exchange (LME) copper price averaged US$9,524 per tonne in the second quarter of 2025, US$9,797 in the third and US$11,092 in the fourth, closing the year at a record US$12,504 (MMG, fourth quarter 2025 production report). The calculator below takes your own tonnage, price and C1 cost, converts pounds to tonnes (1 tonne = 2,204.62 lb) and shows the gross margin before the items C1 leaves out.
Calculator
What is the gross margin at your copper price?
Enter a tonnage, a copper price and a C1 cost per pound.
- Gross value of copper (US$ million): $4,000
- C1 cost of that copper (US$ million): $882
- Break-even copper price (US$ per tonne): 2,205
Example values only, not a benchmark. Tonnage is the top of MMG’s 2026 guidance (380,000 to 400,000 t); C1 US$1.00 per lb sits inside MMG’s revised 2026 range of US$0.85 to US$1.05 per lb (Q2 2026 report), and MMG’s 2025 actual was US$1.12. The copper price is an example, use today’s price. The result is before sustaining capital, depreciation, royalties, treatment charges and tax.
Road blockades and community relations at Las Bambas
Las Bambas has a long record of road disputes, because its concentrate moves along a public corridor of about 450 km through communities that were not always consulted. The mine was disrupted for more than 100 days in 2019, when over 70 communities along the road to Matarani demanded action on truck dust and loss of farmland. A three-week roadblock at the end of 2020 stopped the export of 189,000 tonnes of concentrate worth US$530 million, and in September 2021 MMG said it would halt operations again as protests in Chumbivilcas blocked shipments (MINING.COM, 27 September 2021). In May 2019 the Fuerabamba community had blocked the road across its farmland after compensation talks failed (Reuters via MINING.COM, 22 May 2019).
MMG now reports a calmer period. Its first quarter 2026 report says the mine has run for almost three years without material social disruption. It credits a social model called “Corazón de Las Bambas”, introduced in 2023. In 2025 MMG also said a community company from Huancuire, Corhuan, won a contract to move concentrate with 30 new trucks, bringing the permitted truck fleet to 155 (MMG, first quarter 2025 release). MMG’s first quarter 2026 report adds that the mine “remains vigilant to heightened social tensions” around Peru’s 2026 election, so the risk has not gone away. The calm-period description is MMG’s own view; the blockade history above comes from news reports.
For a consultant or investor, the useful question is not whether blockades happened but how much stock sat at the port and on site when one hit. MMG’s first quarter 2026 report shows payable copper sold at 119,977 tonnes, 13% more than a year earlier, helped by drawing down port stockpiles.

▶ The seven environmental impacts of mining, explained in clay. · 2:31
Where Las Bambas sits in world copper
The US Geological Survey (USGS) estimates world copper mine output at 23 million tonnes in 2025. Chile led with 5.3 million tonnes, the Democratic Republic of the Congo followed with 3.2 million and Peru was third with 2.7 million (USGS, Mineral Commodity Summaries 2026: Copper). Many web pages still call Peru the second-largest producer; the current USGS table puts it third. On those numbers Las Bambas supplied about 15% of Peru’s 2025 copper and roughly 2% of the world’s, our own division of MMG’s 410,834 tonnes by the USGS totals.
Chart
Copper mine output, main producers
Thousand tonnes of contained copper
The chart compares the 2024 and 2025 estimates for the main producers. Zambia’s rise stands out, and the country is covered below.
Mining is a large part of Peru’s economy. The Extractive Industries Transparency Initiative (EITI) reports that the extractive sector made up 11.3% of Peru’s GDP and about 68% of its exports in 2022 (EITI, Peru). Peru also ranks fourth for molybdenum mine output on the USGS table, with 39,000 tonnes in 2025 behind China, Chile and the United States (USGS, Mineral Commodity Summaries 2026: Molybdenum).
▶ Why electric vehicles need so much copper and where it is mined. · 6:03
Lubambe Copper Mine in Zambia: owners, output and plans
Lubambe is an underground copper mine near Chililabombwe on Zambia’s Copperbelt. It is far smaller than Las Bambas and it is not run by EMR Capital any more. EMR’s 80% stake passed to China’s JCHX Mining Management in 2024, and ZCCM Investments Holdings, the Zambian state-backed investor, held the other 20%. In August 2024 ZCCM-IH announced a deal to take another 10% for US$1, lifting its stake to 30% and cutting JCHX to 70%, and said JCHX planned to invest about US$300 million to extend the mine’s life (ZCCM-IH, 28 August 2024). ZCCM-IH’s own Lubambe page now lists JCHX at 70% and ZCCM-IH at 30% (ZCCM-IH, Lubambe Copper Mines).
A Lubambe manager speaking at the Energy Forum for Africa conference in Lusaka said that the mine then milled about 135,000 tonnes of ore a month, making about 1,800 tonnes of concentrate, and that planned output was 24,000 tonnes of concentrate in 2026, 34,000 tonnes in 2027 and 2028 and 40,000 tonnes a year from 2029. Peak power demand was 28.5 megawatts, two new shafts were under construction (a main shaft planned to reach 1,350 metres and an auxiliary shaft 700 metres) and water pumping, at 47,000 cubic metres a day, was forecast to reach 80,000 within five years (Zambia Monitor). Those are plans, not results.
Zambia’s copper output was 890,346 tonnes in 2025, up 8% on 825,513 tonnes in 2024 but short of the 1 million tonne target, according to the mines ministry. It named Lubambe among the mines that raised output (Reuters via MINING.COM, 27 January 2026). The government aims for 3 million tonnes by 2031. That report gave no tonnage for Lubambe alone. Lubambe is a copper producer.
Las Bambas and Lubambe side by side
The two mines differ in almost every way. The table compares them on figures that are published. The output rows are not on the same basis: Las Bambas reports contained copper, Lubambe’s plan is stated in tonnes of concentrate, so do not divide one by the other.
| Item | Las Bambas (Peru) | Lubambe (Zambia) |
|---|---|---|
| Mining method | Open pit | Underground |
| Operator and main owner | MMG, 62.5% of the project | JCHX Mining Management, 70% (80% before the 2024 ZCCM-IH deal) |
| State or partner share | Guoxin 22.5%, CITIC Metal 15% | ZCCM-IH 30% (20% before the 2024 deal) |
| Output figure | 410,834 t copper in concentrate (2025) | About 1,800 t of concentrate a month; plan of 24,000 t of concentrate (2026) |
| Biggest stated risk | Road blockades and community disputes | Power supply and water pumping as the mine deepens |
How satellites help monitor a large open-pit mine
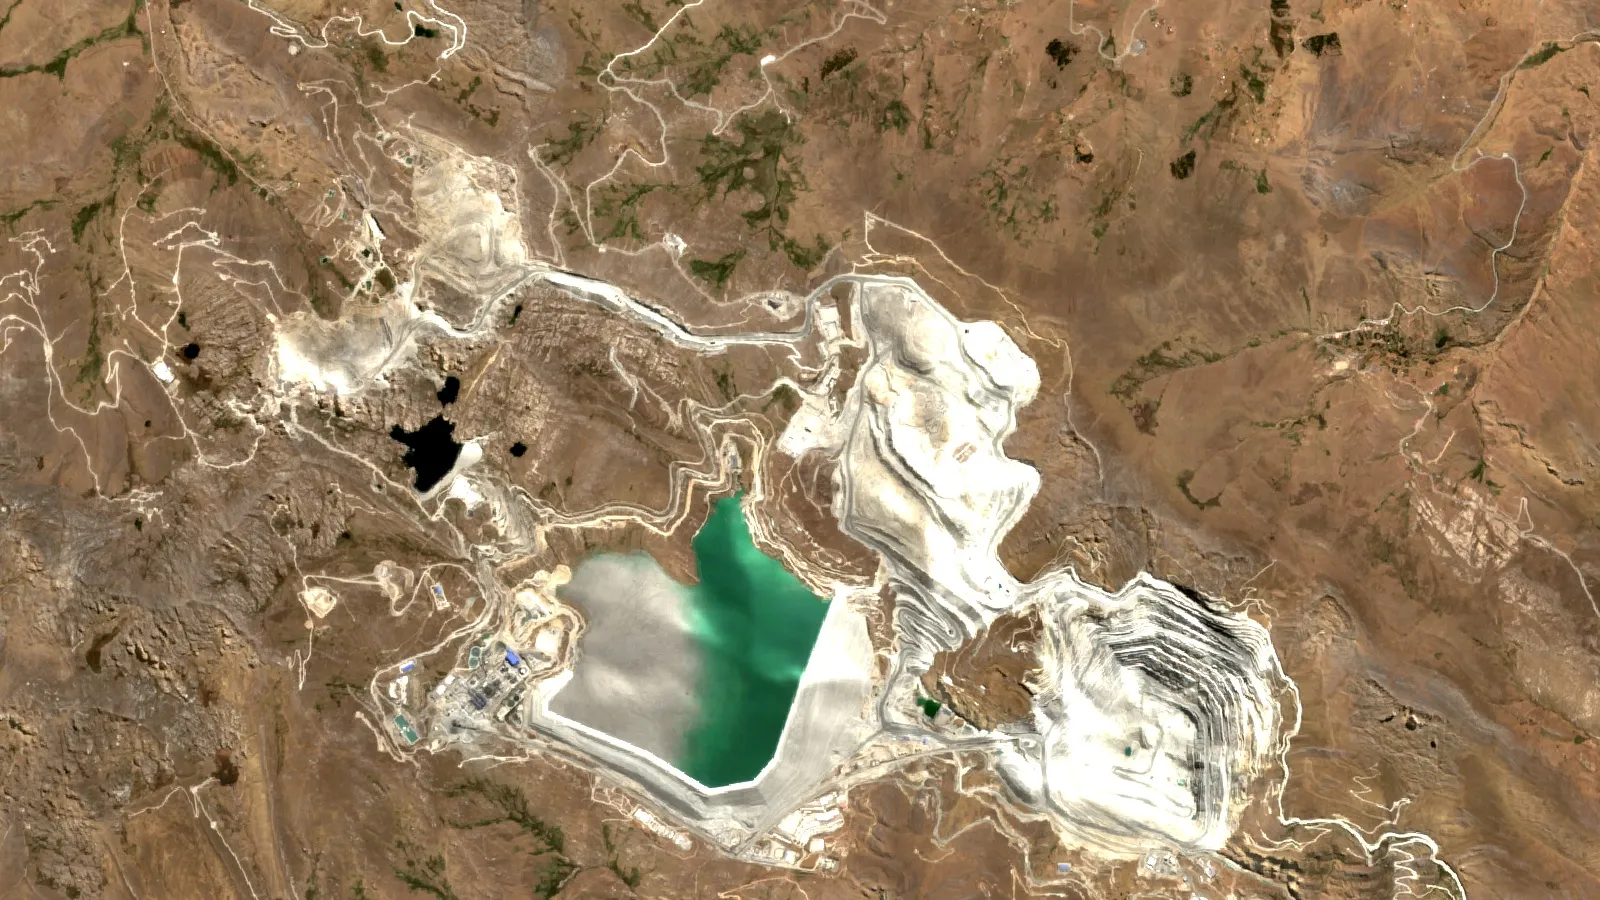
A mine the size of Las Bambas changes every few weeks. Pits deepen, waste dumps spread and tailings ponds fill. A medium-resolution satellite such as Sentinel-2 sees the ground at about 10 metres per pixel, which is enough to measure the footprint of a pit or a waste dump from one summer to the next, and to see new roads. The image at the top of this page is built from Sentinel-2 imagery of the Las Bambas area. Farmonaut applies the same kind of data to screen licence areas for mineral targets; see the guide to drill and blast monitoring software for the operating side of a mine, and the Farmonaut platform for the satellite side. Satellite imagery cannot tell you the grade or the reserve; only drilling and assays can.
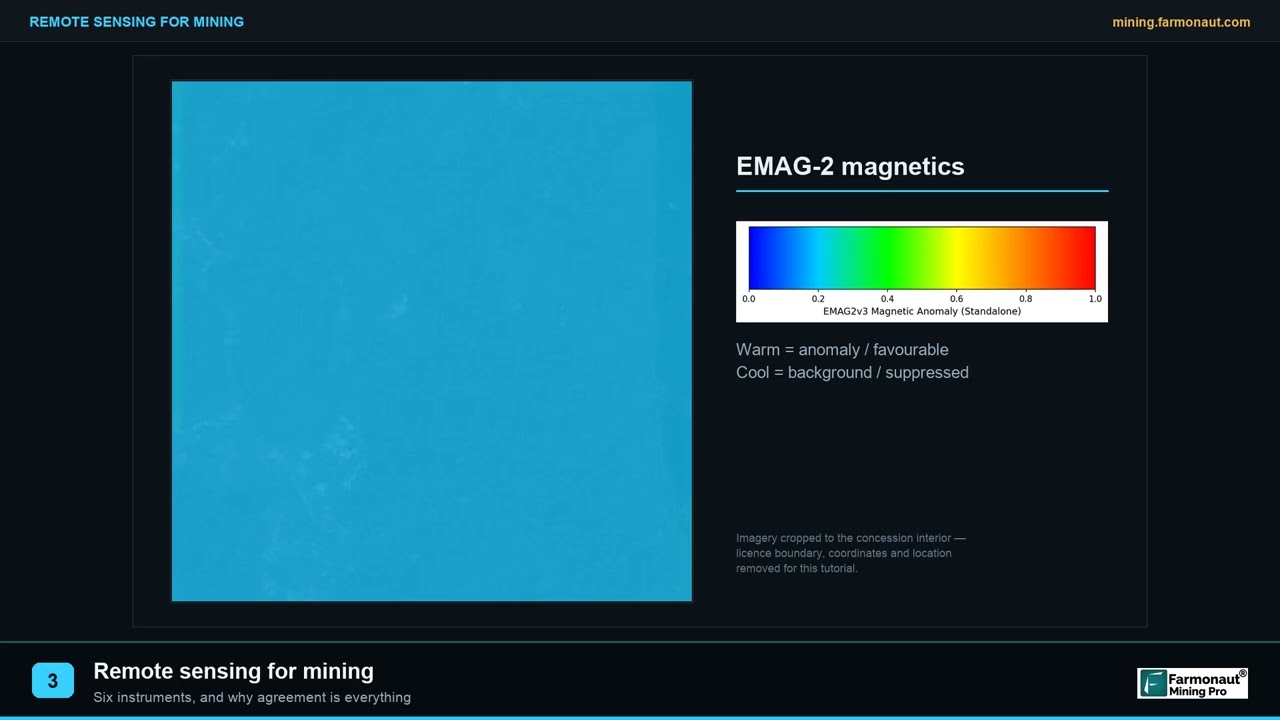
▶ What remote sensing for mining means, in three minutes. · 2:01
How to check any copper mine’s figures yourself
- Find the operator’s quarterly report. For Las Bambas that is MMG’s production report; it separates copper in concentrate from cathode and gives grade, throughput and recovery.
- Match the basis. Contained copper, concentrate tonnes and payable copper are three different numbers. Payable is what the smelter pays for, after deductions.
- Read the cost line. Look at C1 cost and how much of it is by-product credit, and compare the guidance range with the actual.
- Check ownership in a filing. Use the company’s annual report, the stock exchange (Hong Kong for MMG, Lusaka for ZCCM-IH) or the regulator, not a summary page.
- Look at the road. For mines with long haul routes, check local news for blockade history before you trust a production forecast.
- Compare with national statistics. USGS and each country’s mines ministry publish totals you can divide into a single mine’s output.
For wider context, see our list of the top copper-producing countries.
Mining terms used on this page
- Concentrate. The copper-rich powder produced by flotation, sold to smelters.
- Ore milled grade. The percentage of copper in the ore sent to the mill.
- Recovery. The share of the copper in the ore that reaches the concentrate.
- C1 cost. The cash cost per pound of payable copper after by-product credits.
- Treatment and refining charges (TC/RCs). Fees a smelter keeps when it converts concentrate into metal.
For a closer look at a related question, see our guide: De Beers Mines: Output, Costs and Owners by Country.
Frequently asked questions
Who owns the Las Bambas copper mine
MMG Limited owns 62.5% through a consortium, Guoxin International Investment owns 22.5% and CITIC Metal owns 15%. MMG is the operator (MMG, Las Bambas operation page).
Where is Las Bambas
In the Apurímac Region of southern Peru, near Challhuahuacho, between the Cotabambas and Grau provinces, at more than 4,000 metres above sea level.
How much copper does Las Bambas produce
410,834 tonnes of copper in concentrate in 2025. MMG guides to 380,000 to 400,000 tonnes for 2026, and the first two quarters of the year were 101,003 and 109,192 tonnes.
Is Las Bambas an open-pit or underground mine
Open pit. Lubambe, by contrast, is underground.
Why does Las Bambas have road blockades
Concentrate moves on a public road of about 450 km, and communities along it have blocked it to demand jobs, transport contracts, compensation and less dust. MMG reports no material social disruption for almost three years to early 2026.
What does the mine produce besides copper
Gold, silver and molybdenum. In 2025 that was 85,604 ounces of gold, about 5.26 million ounces of silver and 2,910 tonnes of molybdenum.
How long will Las Bambas operate
MMG estimates a mine life of more than 18 years. That is a company estimate and changes with reserves and plans.
Who owns Lubambe Copper Mine
JCHX Mining Management bought EMR Capital’s 80% in 2024. A 2024 agreement moved 10% to ZCCM-IH, and ZCCM-IH’s own Lubambe page now lists JCHX 70% and ZCCM-IH 30%.
How much copper does Zambia produce
890,346 tonnes in 2025, up 8% from 2024, below the 1 million tonne target (Zambian mines ministry via Reuters).
Does Lubambe produce cobalt
No. Lubambe is a copper mine, and this page cites no cobalt figure for it.
The figures on this page come from company reports and public statistics and change each quarter. Production, cost and ownership figures are reported as stated by the sources, with their dates.
This page is for information only. It is not investment advice. Production, cost and ownership figures change; confirm them in each company’s latest filings.
Farmonaut mining
Map your own mining site from space
Mining consultants can use satellite data to screen a licence area as an exploration target, ahead of any resource estimate.

Mining Pro sample view, synthetic data
Keep reading
Sources
- MMG, Fourth quarter 2025 production report: mmg.com
- MMG, First quarter 2026 production report (HKEX): www1.hkexnews.hk
- MMG, Las Bambas operation page: mmg.com
- MMG, First quarter 2025 release: mmg.com
- MMG, Second quarter 2026 production report (21 July 2026): mmg.com
- Fastmarkets, MMG agrees deal to buy Las Bambas (14 April 2014): fastmarkets.com
- MINING.COM, Peru road blockades force MMG to halt Las Bambas (27 Sept 2021): mining.com
- Reuters via MINING.COM, MMG says Las Bambas not disrupted (22 May 2019): mining.com
- USGS, Mineral Commodity Summaries 2026: Copper: pubs.usgs.gov
- USGS, Mineral Commodity Summaries 2026: Molybdenum: pubs.usgs.gov
- EITI, Peru country page: eiti.org
- ZCCM-IH, additional 10% shareholding in Lubambe (28 Aug 2024): zccm-ih.com.zm
- Zambia Monitor, Lubambe targets 40,000 tonnes of concentrate: zambiamonitor.com
- Reuters via MINING.COM, Zambia’s 2025 copper production up 8% (27 Jan 2026): mining.com
- IISD, Peru country profile (2026): iisd.org
- ZCCM-IH, Lubambe Copper Mines page: zccm-ih.com.zm
Discussion
Questions, corrections or field experience? Share them below. First-time comments are reviewed before they appear, and your email is never published.
No comments yet. Be the first to add a question or your experience.

 CIMISCO SARL
 Mining SARL
 SenGold Invest SAS
 Sania Corporation
 Sean Mining Limited
 NTS Group (Pty) Ltd
 Mine4Africa
 Lithspo Minerals Limited
 Tintina Mining Group
 Dalgety Minerals Pty Ltd
 Vortex Minerals Pty Ltd
 Faith At Work (Pty) Ltd
 Geotech Mining Solutions plc
 Vulcan International Limited
 Kidepo Associates
 GKY Mining
 Alkimy SARL
 Double A Trading
 GemSprout Metals Limited
 Qader Group
 Ileys General Trading
 SG Gold Mining LLC
 VRV Global Pte Ltd
 Omsri International FZE











