

Reviewed September 2026 against World Gold Council supply data and Mining.com production rankings.
Try it: Run your own numbers →
Table of Contents
- Quick Answer: Who’s Largest
- Gold Mining Companies: Global Overview
- Comparative Table: Leading Gold Producers
- Calculator: Estimate a Producer’s Annual Revenue
- Which Countries Actually Mine the Gold
- Emerging Gold Producers and Explorers
- Company Profiles: How Each Producer Got There
- Technology and Emerging Leaders
- Sustainability Across the Sector
- Satellite Monitoring for Gold Mining Operations
- Farmonaut’s Role in Mining Oversight
- FAQ
- Conclusion
- Try it: Run your own numbers
Largest Gold Mining Companies in the World, Ranked
Newmont Corporation is the largest gold mining company in the world, with attributable production of 5.9 million ounces in 2025, per Mining.com’s producer rankings (Mining.com). Barrick Mining, which produced 3.91 million ounces in 2024 (Barrick Mining), is the second-largest company; its biggest asset is Nevada Gold Mines, a joint venture it owns 61.5% with Newmont holding 38.5%. Zijin Mining, China’s largest gold company, produced 2.89 million ounces. None of these figures are static: production shifts year to year as mines deplete, new projects ramp up, and ore grades change, so treat this page as a snapshot with a checkable source, not a permanent scoreboard.
This gets confused often, so separate two different questions. “Biggest gold mining company” usually means attributable ounces produced in a year — that’s Newmont. “Biggest gold company” sometimes means market capitalization or revenue instead, and those rankings can shift the order because a company can produce less gold but carry a higher share price, more diversified assets, or lower debt. Neither the World Gold Council nor Mining.com currently publishes a combined, verified revenue/market-cap league table for gold miners specifically — see the Gaps note below for how to check current market cap yourself.
Gold Mining Companies: Global Overview
Global mine production of gold reached a record 3,671.6 tonnes in 2025, up 1% from the prior year, according to the World Gold Council, while the gold price averaged a record $3,431 an ounce for the year. Add 1,404.3 tonnes of recycled gold — up 3% year over year — and total global gold supply for 2025 comes to 5,002.3 tonnes. Recycled supply is now growing faster than new mine output, which matters for any company betting on production growth from the ground rather than from scrap.
At spot price, this sector runs on a number that moves by the minute. Gold traded at $4,434.68 per troy ounce on 7 September 2026, according to KITCO’s live gold chart. That price is what makes marginal deposits economic or uneconomic, and it’s why “emerging gold mining companies” and small explorers move in and out of production depending on where spot sits. Check KITCO, APMEX (apmex.com/gold-price), or BullionVault (bullionvault.com) for the current figure before using any price in a calculation — a number quoted here will be stale within hours.
Gold mining companies remain concentrated: a handful of producers with multi-country asset bases account for a large share of formal, reported ounces, while thousands of smaller “gold exploration company” entities hold ground-stage projects with no production at all. Both ends of that spectrum answer different searches — “gold companies” as a broad category includes explorers with zero output, while “top gold mining companies leaders” refers specifically to the operating majors ranked below.
Comparative Table: Leading Gold Producers
The table below uses verified 2025 attributable production figures where available. Revenue and market-cap columns are intentionally left as “check current” rather than filled with unverified numbers — neither the World Gold Council nor Mining.com publishes a consolidated financial league table for gold miners, and inventing figures here would be worse than leaving the gap visible.
| Company / Operation | 2025 Attributable Production | Ownership Structure | Primary Regions | Source |
|---|---|---|---|---|
| Newmont Corporation | 5.9 million oz | Single public company | USA, Australia, Ghana, Peru, Canada, Mexico | Mining.com, 2025 |
| Nevada Gold Mines (joint venture) | 3.26 million oz | Newmont 38.5% / Barrick Gold 61.5% | Nevada, USA | Mining.com, 2025 |
| Zijin Mining | 2.89 million oz | Single public company | China, Russia, Papua New Guinea | Mining.com, 2025 |
| Barrick Gold | Check current annual report | Single public company | Canada, USA (Nevada JV operator), Argentina, Mali, DRC, Tanzania and others | See refresh method below |
| AngloGold Ashanti | Check current annual report | Single public company | South Africa, Ghana, Australia, Argentina | See refresh method below |
| Agnico Eagle Mines | Check current annual report | Single public company | Canada, Finland, Mexico, Australia | Farmonaut profile |
| Sibanye-Stillwater | Check current annual report | Single public company | South Africa, USA (Stillwater, Montana), Zimbabwe | Farmonaut profile |
Why the blank cells for Barrick, AngloGold, and Sibanye-Stillwater instead of a number? The research base for this article verified Newmont, Nevada Gold Mines, and Zijin against Mining.com’s ranked list of the world’s top 20 gold mines. It did not independently verify the other companies’ current-year attributable ounces, and this page would rather show you where to look than hand you a figure that can’t be traced back to a source. Each company publishes attributable gold production in its quarterly and annual reports — search “[company name] investor relations production results” for the current filing.
Company or mine: reading gold rankings correctly
Many lists of the biggest gold mining companies mix up companies and mines. Nevada Gold Mines is the clearest case. It is not a separate company but a joint venture set up on 1 July 2019, owned 61.5% by Barrick and 38.5% by Newmont, with Barrick as operator. When the two companies combined their Nevada operations, those mines had produced about 4.1 million ounces in 2018 (Nevada Gold Mines).
Each owner reports its share of that output in its own attributable production, so adding Nevada Gold Mines to a company league table counts the same ounces twice. Ranked as companies, the order at the top is:
- Newmont (Denver, Colorado): the largest gold miner, with mines in nine countries plus its Nevada stake, and the only gold miner in the S&P 500. It bought Newcrest Mining for $16.8 billion in November 2023 (Newmont).
- Barrick Mining (Toronto): renamed from Barrick Gold in May 2025. It produced 3.91 million ounces in 2024 and guided 3.9-4.3 million ounces for 2025 (Barrick Mining).
- Zijin Mining (Fujian, China): a gold and copper miner with gold operations in China, Serbia, Papua New Guinea, Ghana, Colombia and other countries (Zijin Mining).
Check each company’s latest annual report for current attributable ounces before quoting a ranking.
Calculator: Estimate a Producer’s Annual Revenue
Gold company revenue is production times realized price, roughly — enter a company’s reported annual ounces and the current spot price to get a rough revenue estimate, then adjust for the fact that miners typically sell somewhat below spot due to refining and hedging.
Run your own numbers
Assumes uniform realized price across all output; ignores hedging contracts, royalty deductions, and by-product credits (silver, copper) that real miners report separately. Update the gold price field from KITCO before relying on the output.
Which Countries Actually Mine the Gold
Company rankings sit on top of a country-level picture that shifts more slowly. China mined 384.3 tonnes in 2025, the largest national total and about 10% of global mine production, according to the World Gold Council's production-by-country data. Russia followed at 345 tonnes, and Australia at 293.2 tonnes. US mine production slipped to an estimated 160 tonnes in 2025 from 163 tonnes in 2024, with Nevada supplying about 64%, per USGS Mineral Commodity Summaries 2026 — a reminder that "largest gold mining company" and "largest gold-producing country" are not the same question, since Newmont is headquartered and listed in the US but mines across nine countries.
No single company controls a national total. China's 384.3 tonnes comes from a fragmented domestic industry alongside Zijin Mining's international operations; Russia's 345 tonnes includes output from Polyus and other domestic producers not separately verified in this research base. If you need a specific company's share of a specific country's output, that's a cross-reference between the World Gold Council's country data and each company's own reported asset list — not a number either source publishes pre-combined.
Emerging Gold Producers and Explorers
"Emerging gold mining companies" and "emerging gold producers" describe a different tier entirely from Newmont or Zijin: smaller-cap companies moving from exploration into first production, or mid-tier producers scaling toward major status. This research base does not include verified production or reserve figures for specific emerging producers — that data lives in each company's own technical reports (NI 43-101 for Canadian-listed issuers, S-K 1300 for US-listed ones) and isn't aggregated by the World Gold Council or USGS at the individual-company level for this tier.
What you can check directly: a company's most recent technical report will state contained ounces, cut-off grade, and stage (resource, reserve, or production-ready). For a primer on what separates an exploration project from a producing mine, see our beginner's guide to gold mining and the innovations shaping where new production comes from. A "gold exploration company" ranking near position 65 in search results, as this query currently does, usually reflects that most searchers want a specific company's technical report rather than a general list — narrow your search to the company name plus "technical report" or "43-101" for the fastest path to real numbers.

Company Profiles: How Each Producer Got There
Newmont Corporation (USA): Largest by Attributable Ounces
Newmont's 5.9 million ounces in 2025 makes it the world's largest gold mining company by attributable production, per Mining.com. Operations span nine countries — the US, Canada, Mexico, the Dominican Republic, Australia, Ghana, Argentina, Peru and Suriname (Newmont) — a spread that insulates the company from any single country's permitting or grade problems. Newmont also holds 38.5% of Nevada Gold Mines, the joint venture that alone produced 3.26 million ounces.
For mining companies tracking machinery use and worker safety across scattered sites, our fleet management solution applies satellite-based tracking to reduce costs and improve safety oversight.

Barrick Gold (Canada): Nevada Joint Venture Partner
Barrick holds 61.5% of Nevada Gold Mines, the majority share of a joint venture producing 3.26 million ounces in 2025. The company, renamed Barrick Mining Corporation in May 2025, produced 3.91 million ounces in 2024 and guided 3.9-4.3 million ounces for 2025 (Barrick Mining). Operations extend across Canada, the US, Argentina, Mali, the DRC, and Tanzania.
Companies needing supply-chain verification tools can review blockchain-based traceability tools for regulatory compliance and stakeholder trust.

Zijin Mining (China): Third-Largest Verified Producer
Zijin Mining produced 2.89 million ounces of gold in 2025, ranking it among the top three companies verified in this research base, per Mining.com. Zijin operates across China, Russia, and Papua New Guinea, and is one of the few majors with major copper assets alongside gold — relevant background on copper and iron ore extraction methods applies directly to how Zijin's polymetallic sites are processed.
AngloGold Ashanti (South Africa)
AngloGold Ashanti operates across South Africa, Ghana, Australia, and Argentina. Current-year attributable production was not independently verified for this article; check the company's most recent annual report for the figure. Its operations rely on techniques covered in our guide to ore-sorting for mining efficiency and sustainability.
Mining operations spanning multiple countries can use carbon footprinting and fleet monitoring to standardize impact measurement across jurisdictions with different reporting rules.

Agnico Eagle Mines (Canada, Finland, Mexico, Australia)
Agnico Eagle Mines operates across four countries and has expanded through electrified underground fleets — see our dedicated profile for the company's site-by-site production history and technology stack.

Sibanye-Stillwater (South Africa, USA, Zimbabwe)
Sibanye-Stillwater runs the Stillwater complex in Montana alongside South African and Zimbabwean assets, making it one of the few companies on this list with a direct US gold and platinum-group-metals footprint. See the linked profile for site-level detail.
Technology and Emerging Leaders in Gold Mining
- AI-assisted exploration: Used across majors to prioritize drill targets and cut discovery cost per ounce; company-specific efficiency gains aren't independently published at a sector level.
- Satellite monitoring: Tracks ore movement, site footprint change, and environmental compliance without site visits.
- Blockchain traceability: Deployed by several majors for supply-chain authentication; adoption rate across the sector is not tracked in a public index.
- Automation and remote operation: Reduces underground labor exposure and supports 24-hour operation in harsh climates like northern Canada and Finland.

Sustainability Across the Sector
Every major gold producer now reports water use, emissions, and land rehabilitation metrics in annual sustainability reports, but these are self-reported and not standardized across companies — comparing AngloGold Ashanti's water-recycling percentage to Barrick's directly requires reading both companies' own methodology notes, since neither uses an identical measurement standard verified by a third party in this research base.
- Water conservation: Recycling and closed-loop systems, particularly at water-stressed South African and Australian sites.
- Renewable energy integration: Solar and wind additions at remote sites reduce diesel dependency and fuel-transport risk.
- Land rehabilitation: Post-mining restoration using native species; see our guide to land remediation practices for restoring soils for the underlying techniques.
- Mining's agricultural footprint: Displaced farmland and forestry near mine sites is a distinct concern from mine-site rehabilitation — covered in our analysis of the effects of mining on agriculture and forestry.
We offer carbon emission tracking solutions that give mining operators a consistent, satellite-based measurement standard rather than relying solely on self-reported figures.
Satellite Monitoring for Gold Mining Operations
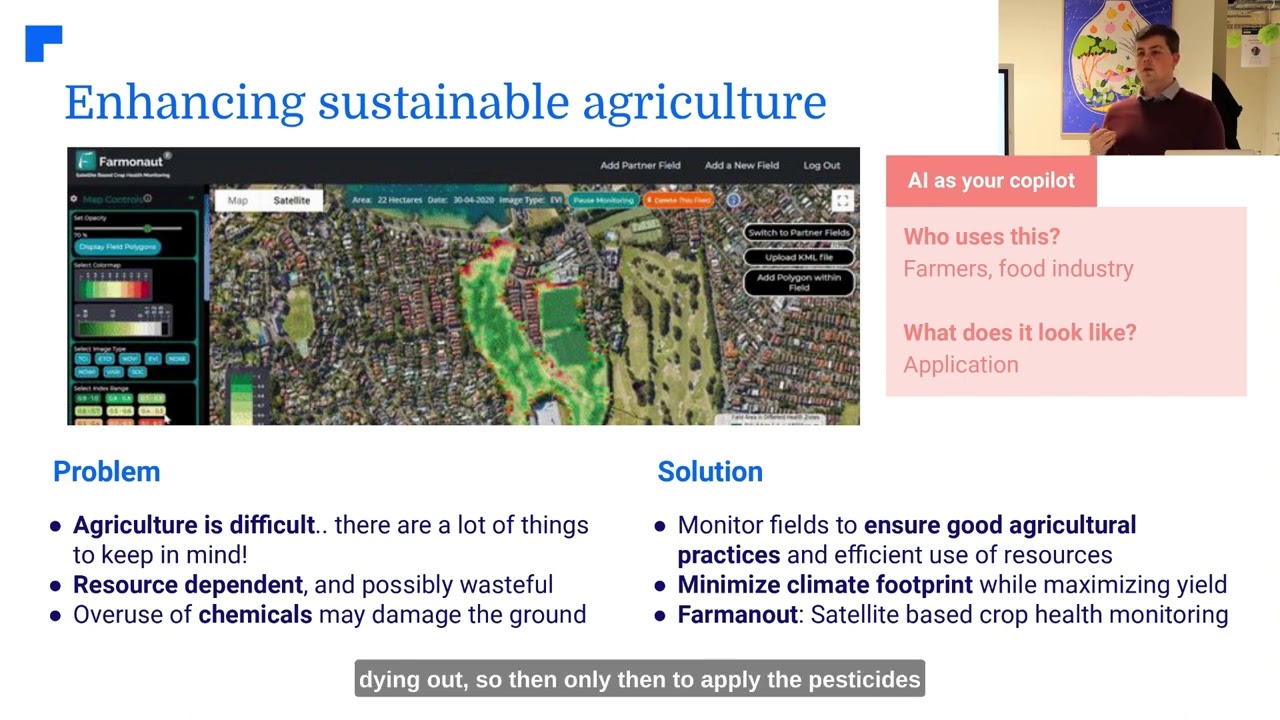
Satellite data platforms like Farmonaut give gold mining companies of any size a way to monitor site conditions without permanent field infrastructure. Applications relevant to the companies profiled above include:
- Site-footprint tracking for permitting and environmental compliance reporting
- Fleet monitoring for logistics and safety across multi-country asset bases
- Blockchain-backed traceability for supply-chain and regulatory requirements
- Access via web, Android, and iOS for site managers working across time zones
Explore our web, Android, and iOS satellite solutions for mining managers and decision-makers.



For developers and corporate IT teams integrating satellite data into custom systems: API Info | Developer Docs.
Farmonaut's Role in Mining Oversight
Farmonaut applies satellite-driven monitoring to mining operations of every size, from single-site operators to multi-country majors like those profiled above.
- Cost-effective monitoring: Satellite-first approach removes the need for expensive in-field hardware at every site.
- Resource efficiency: Detect inefficiencies and reduce losses with current imagery across dispersed assets.
- Sustainability tracking: Our environmental tracking tools support emissions, water, and land rehabilitation reporting with a consistent methodology.
- Traceability: Blockchain traceability meets certified-sourcing and compliance demands across the supply chain.
- Financing support: Satellite-based verification supports loan and insurance assessments for both mining and agricultural land use.
- Scalable access: Our large-scale project management platform works for single sites and multi-location operations alike.
FAQ
Q1. What is the largest gold mining company in the world?
A1. Newmont Corporation, with 5.9 million ounces of attributable production in 2025, per Mining.com. This figure changes annually as mines deplete and new projects come online — check Newmont's current annual report for the latest number.
Q2. Is "largest gold company" the same as "largest gold mining company"?
A2. Not always. Production rankings (ounces mined) and financial rankings (market cap, revenue) can differ. This article's verified data covers production; check each company's investor relations page for current market cap.
Q3. What is the biggest gold company in the world by production, after Newmont?
A3. Nevada Gold Mines, a joint venture 61.5% owned by Barrick Gold and 38.5% by Newmont, produced 3.26 million ounces in 2025 from its Nevada operations, per Mining.com. Zijin Mining followed at 2.89 million ounces.
Q4. Which countries produce the most gold?
A4. China led with 384.3 tonnes in 2025 (about 10% of global supply), followed by Russia at 345 tonnes and Australia at 293.2 tonnes, per the World Gold Council. US output slipped about 2%, to an estimated 160 tonnes, per USGS.
Q5. What defines an "emerging gold producer" versus a major?
A5. No official production threshold separates the two terms. In practice, "emerging" describes companies moving from exploration or first production toward mid-tier status, verified through each company's own technical report (NI 43-101 or S-K 1300) rather than a sector-wide list.
Q6. How is total global gold supply calculated?
A6. Mine production plus recycled gold. In 2025 that was 3,671.6 tonnes mined plus 1,404.3 tonnes recycled, for 5,002.3 tonnes total supply, per the World Gold Council's Gold Demand Trends report.
Q7. How can I check current gold company production figures myself?
A7. Search the company's investor relations site for its most recent quarterly or annual report, which states attributable production in ounces. For country-level totals, the World Gold Council's Goldhub data by country is updated annually.
Q8. How does satellite technology support gold mining operations?
A8. Satellite imagery tracks site footprint, supports environmental compliance reporting, and enables fleet and resource monitoring without permanent field hardware — used across producers of every size, from majors to emerging operators.
Conclusion
Newmont Corporation holds the top spot among gold mining companies by attributable production, at 5.9 million ounces in 2025, with Nevada Gold Mines and Zijin Mining close behind. That ranking is not fixed: mine depletion, new project startups, and shifts in ore grade move the order year to year, and the way to verify it — Mining.com's ranked list of top gold mines, cross-checked against each company's own annual report — will still work long after any specific figure in this article goes stale.
The durable pattern underneath all these rankings: production concentrates in a handful of multi-country majors, national output concentrates in China, Russia, and Australia, and the "largest" answer depends entirely on which metric — ounces, tonnes, revenue, or market cap — the question is actually asking. Check the metric before trusting any single-number claim, including the ones in this article.
For mining, infrastructure, or government teams looking to apply satellite insight to site operations, try our satellite monitoring solutions and APIs.
Discussion
Questions, corrections or field experience? Share them below. First-time comments are reviewed before they appear, and your email is never published.
No comments yet. Be the first to add a question or your experience.

 GKY Mining
 Alkimy SARL
 Double A Trading
 GemSprout Metals Limited
 Qader Group
 Ileys General Trading
 SG Gold Mining LLC
 VRV Global Pte Ltd
 Omsri International FZE
 G.I.T.T.
 Jaunita Erss Ltd
 Almosi SARL
 SRK Consulting
 Berks Gold Limited
 Mwerezi Minerals Company Limited
 Mining SARL
 SenGold Invest SAS
 Sean Mining Limited
 NTS Group (Pty) Ltd










