

Reviewed September 2026 against USDA Economic Research Service and the Association of Equipment Manufacturers (AEM).
Try it: Run your own numbers →
Table of Contents
- What Precision Agriculture Solutions Actually Deliver
- U.S. Adoption Data: Who Is Using Precision Farming Solutions
- Key Components of a Precision Farming Model
- 7 Precision Agriculture Examples Transforming Farms
- Comparative Feature-Benefit Table
- Controlled Precision Agriculture: What “Controlled” Means Here
- Applications in the Field, Including Small Acreage
- Farmonaut: A Smart Precision Farming Platform Without Field Hardware
- Calculator: Estimate Your Farm’s Precision Ag Value
- Farmonaut Subscription Options
- Challenges & Considerations
- Where the Precision Farming Model Goes Next
- Frequently Asked Questions
- Conclusion
- Try it: Run your own numbers
What Precision Agriculture Solutions Actually Deliver
Precision agriculture solutions use GPS guidance, variable rate application, remote sensing, and farm software to match inputs to what each part of a field actually needs, instead of treating a whole farm as one uniform unit. In the United States, 27% of farms used at least one precision agriculture practice to manage crops or livestock as of the 2023 Census of Agriculture, according to the USDA Economic Research Service (USDA ERS, 2023 Census of Agriculture data). On row crops, the Association of Equipment Manufacturers puts the average annual economic value at $118 per acre, or roughly $236,000 a year on a 2,000-acre corn-and-soybean operation (AEM, 2024 benefit-cost study).
This guide walks through what a precision farming model actually contains, seven concrete precision agriculture examples in production today, the adoption numbers by farm size and technology, and where the term “controlled precision agriculture” fits — controlled-environment growing (greenhouses, vertical farms, hydroponic bays) layered with the same sensor and automation stack used outdoors. Every figure below is sourced to USDA ERS or AEM; where a number isn’t published anywhere, that’s stated directly, with the method to get it for your own operation.
Building a platform that ingests satellite or weather data? Review the Farmonaut API and the API Developer Docs.

U.S. Adoption Data: Who Is Using Precision Farming Solutions
Adoption is not even across farm sizes or technology types, and that unevenness is the most useful thing in the USDA dataset for anyone deciding whether to invest. Among large-scale crop farms, 70% use GPS-guided equipment (auto-steer), compared with 52% of midsize crop farms, per the USDA ERS analysis of the 2023 Census of Agriculture. Variable rate technology (VRT) — the software and hardware that change seed, fertilizer, or chemical rates on the move — is used on 45% of large-scale crop farms. Across corn, cotton, rice, sorghum, soybeans, and winter wheat acreage specifically, more than half of planted acres now use auto-guidance systems (USDA ERS, 2023 Census of Agriculture data).
Read together, these numbers say something specific: precision agriculture solutions in the U.S. are not a niche pursued by a handful of large operations. More than a quarter of all farms use at least one practice, and on the largest crop operations GPS guidance is closer to standard equipment than an add-on. The gap between the 70% large-farm GPS rate and the 27% all-farm baseline is mostly a function of scale economics — a guidance system pays back faster over more acres — not a technology ceiling. USDA does not publish a breakdown by individual crop type or by state within this chart series; if you need adoption figures specific to a crop or a region, the Census of Agriculture’s full data tables (linked from the ERS chart page above) are the primary source, refiled roughly every five years with the next full census due after the 2023 release.
Key Components of a Precision Farming Model
A working precision farming model is a stack, not a single purchase. These are the components that appear, in some combination, in nearly every operation counted in the USDA adoption figures above:
- GPS & GIS: Spatial mapping for guidance, planting, and yield records, down to sub-inch accuracy on RTK-corrected systems.
- Variable Rate Technology (VRT): Applies fertilizer, seed, or chemicals at rates that change by zone within a single field pass.
- Remote sensing & drones: Multispectral imagery for crop health, moisture stress, and pest pressure, captured from aircraft, drones, or satellites.
- IoT field sensors: Soil moisture probes and weather stations reporting continuously.
- AI and predictive analytics: Turns sensor and imagery data into a planting, spraying, or irrigation recommendation.
- Autonomous and guided machinery: Auto-steer tractors and, increasingly, fully autonomous units for spraying and weeding.
- Farm management software: The dashboard layer — web and mobile — that ties the other six together into one operating picture.
No single component defines “precision agriculture.” The USDA’s 27% adoption figure counts a farm as a precision agriculture user if it reports using any one of these practices, which is why a small operation running only a soil moisture sensor and a mid-size farm running full auto-steer plus VRT are both captured in the same headline number.
7 Precision Agriculture Examples Transforming Farms
1. GPS & GIS Guidance
GPS and GIS mapping lets a tractor pass over a field with the same line accuracy every time, reducing overlap on planting, spraying, and harvesting. Systems such as John Deere’s StarFire navigation deliver sub-inch repeatable accuracy with RTK correction. This is the single most widely adopted precision agriculture example in the country: 70% of large-scale U.S. crop farms and 52% of midsize crop farms use GPS-guided auto-steer, per USDA ERS.
- Benefit: Cuts input overlap and skips, improves seed placement.
- Use case: Field-boundary mapping that feeds variable-rate fertilizer and spray zones directly.
2. Variable Rate Technology (VRT)
VRT applies fertilizer, seed, or crop protection products at a rate that changes automatically as the applicator moves across zones of different soil fertility or yield potential, instead of one blanket rate for the whole field. USDA ERS reports 45% of large-scale U.S. crop farms use VRT. AEM’s 2024 study attributes an 8% improvement in fertilizer optimization to precision agriculture adoption generally, worth about $20,000 in fertilizer savings per 1,000 acres (AEM, 2024).
- Map-based VRT: Pre-plans application zones from soil nutrient or yield maps.
- Sensor-based VRT: Adjusts rates in real time from on-board crop sensors.
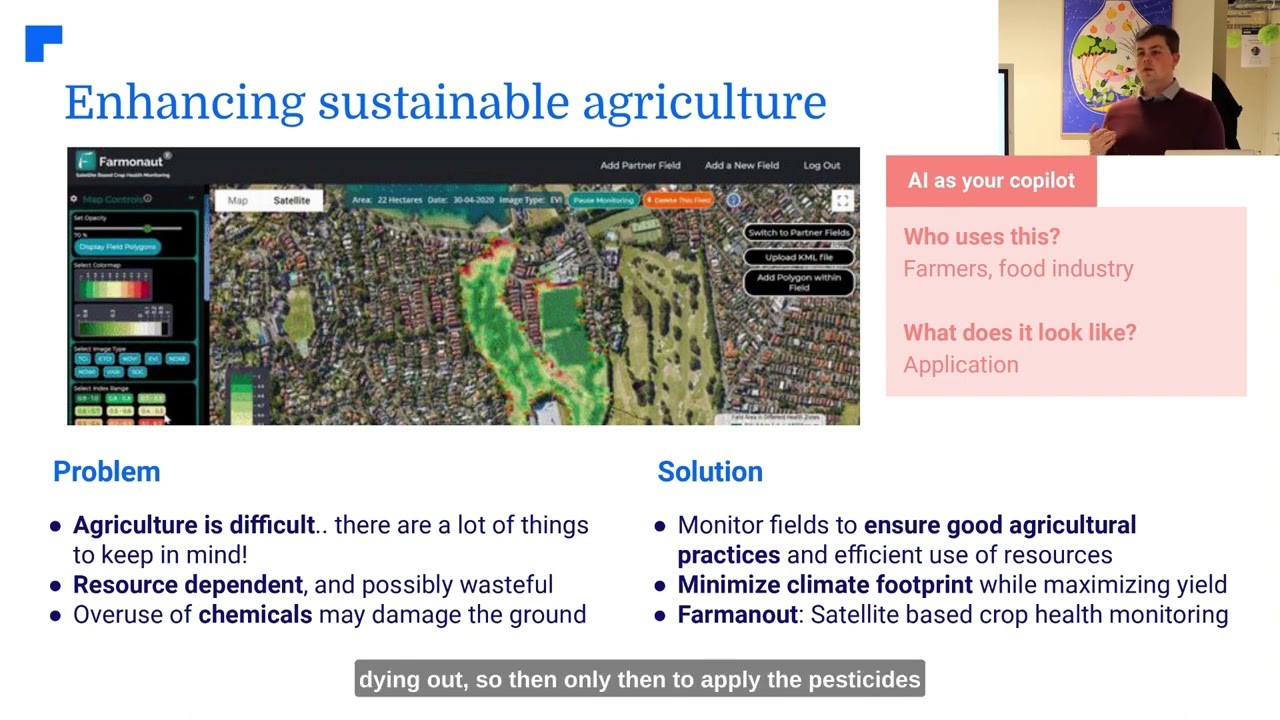
3. Remote Sensing & Drones for Crop Monitoring
Drones and satellites carrying multispectral sensors flag water stress, nutrient deficiency, or pest pressure before the damage is visible to the eye, generating vegetation indices like NDVI from the imagery.
- Aerial monitoring: Flags problem zones early enough to act on them.
- Data-driven insight: Software converts raw imagery into a health index a grower can act on directly.
This is one of the more accessible precision agriculture applications because it scales down: the same NDVI logic that runs on a 2,000-acre grain farm runs identically on a single monitored field. Background on the underlying discipline is at Wikipedia’s precision agriculture overview.

4. IoT Field Monitoring
Soil moisture probes and weather stations report conditions continuously rather than at the interval a person can physically walk the field. This is one of the clearer agriculture automation examples: the alert fires itself.
- Automated alerts: Early warning on frost, drought stress, or irrigation failure.
- Targeted resource use: Water and inputs go where the sensor data says they’re needed, not uniformly.
5. AI and Machine Learning
AI systems combine satellite imagery, soil data, and historical yield records to forecast pest and disease risk and recommend specific actions, an approach detailed further at Farmonaut’s precision farming trends overview.
- Pest and disease forecasting: Earlier detection means a narrower, cheaper treatment window.
- Tailored advisories: Farmonaut’s Jeevn AI Advisory factors weather, soil, and crop stage into one recommendation.
- Yield forecasting: Feeds marketing and logistics planning before harvest.
6. Autonomous Farming Equipment
Guided by the same GPS layer as auto-steer, autonomous sprayers and increasingly autonomous tractors handle planting, spraying, and weeding with consistent accuracy, cutting labor hours and human error on repetitive passes.
- Benefit: Extended operating windows and precise, targeted input application.
- Example: Automated sprayers that dose only where a weed or pest is detected, not the whole row.
7. Smart Irrigation Systems
IoT soil moisture sensors combined with automated valves deliver water on a schedule the field actually needs rather than a fixed calendar. AEM’s 2024 study attributes a 5% reduction in water use to precision agriculture adoption, worth about $16,000 in water savings per 1,000 acres (AEM, 2024).
See large-scale farm management solutions for how this scales to plantation- or cooperative-size irrigation planning.
Comparative Feature-Benefit Table: Precision Agriculture Solutions
AEM’s national benefit-cost figures cover row crops as a whole; per-technology yield ranges below are directional estimates for comparing solutions against each other, not a substitute for the sourced totals in the sections above.
| Solution | Core Technology | U.S. Adoption (large farms) | Documented Economic Value |
|---|---|---|---|
| GPS & GIS Guidance | RTK GPS, mapping software | 70% (auto-steer) | Reduces input overlap; underlies VRT and yield mapping |
| Variable Rate Technology | Sensors, application controllers | 45% | 8% fertilizer optimization; ~$20,000/1,000 acres saved |
| Remote Sensing & Drones | Multispectral imagery, NDVI | Not broken out separately by USDA | Early-detection value folded into the $118/acre AEM total |
| IoT Field Monitoring | Soil/weather sensors | Not broken out separately by USDA | Supports the 5% water-use reduction figure |
| AI & Predictive Analytics | ML models, yield forecasting | Not broken out separately by USDA | Contributes to the 5% production boost, AEM 2024 |
| Autonomous Machinery | Robotics, GPS navigation | Not broken out separately by USDA | Labor-hour reduction; not separately quantified in AEM total |
| Smart Irrigation | IoT sensors, automated valves | Not broken out separately by USDA | 5% water-use reduction; ~$16,000/1,000 acres saved |
Where the table says “not broken out separately,” that’s a direct gap in the published USDA and AEM series, not an estimate we’re withholding. If you need adoption or savings figures isolated to one of these individual technologies, that requires either a primary survey of your own operation type or a vendor-specific study (e.g., from an equipment manufacturer publishing its own telemetry data).
Controlled Precision Agriculture: What “Controlled” Means Here
“Controlled precision agriculture” describes applying the same sensor, GPS, and automation stack inside a controlled-environment setting — a greenhouse, vertical farm, or hydroponic bay — where temperature, light, humidity, and nutrient dosing are all actively managed rather than left to open-field weather. The “precision” layer is identical to open-field VRT and IoT monitoring; the “controlled” layer is the enclosure itself, which removes weather variability as a factor and lets automated systems hold conditions inside a narrow target band continuously. USDA’s Census of Agriculture precision-practice figures (the 27% baseline cited above) are collected across all reporting farms and do not separate controlled-environment operations into their own adoption rate — if that number matters for your planning, USDA’s Census of Horticultural Specialties, the companion survey to the main Census of Agriculture, is the more relevant primary source to check directly.
In practice, a controlled-environment operation runs the same IoT sensor and automated-valve logic described under Smart Irrigation above, just pointed at a climate-controlled enclosure instead of an open field — and the AI/ML forecasting example under item 5 applies the same way to predicting nutrient-solution drift in a hydroponic system as it does to predicting field-scale pest pressure.
Applications in the Field, Including Small Acreage
- Crop monitoring and management: Real-time data from drones, satellites, and IoT sensors flags nutrient deficiencies or pest pressure early enough to act.
— Use the Farmonaut App for field-level monitoring. - Soil health assessment: Remote sensing and nanosensor tools assess nutrient content, moisture, and texture.
— Feeds carbon footprint tracking and sustainable soil management planning. - Automated machinery: Precision robotics handle repetitive seeding and spraying tasks with consistent accuracy.
— See fleet and resource management for equipment and logistics tracking. - Smart irrigation: IoT devices automate scheduling to match actual crop growth stage rather than a fixed calendar.
- Blockchain traceability: Transparent, verifiable tracking through the supply chain.
— Detail at blockchain-based traceability. - Financial services: Satellite-verified field data speeds up crop loan and insurance underwriting.
— More at Crop Loan and Insurance with Farmonaut.
On small acreage — roughly 1 acre — the GPS and VRT layers described above don’t pencil out; that scale of equipment is priced for multi-hundred-acre operations. What does transfer directly is the monitoring and planning layer: satellite-based crop health checks, a soil moisture sensor or two, and a simple rotation and irrigation plan built around microclimate data for the plot. The same NDVI and weather-data principles behind items 3 and 4 above apply at 1 acre exactly as they do at 2,000; only the machinery-heavy solutions (autonomous equipment, large-scale VRT) require scale to justify the cost.
Farmonaut: A Smart Precision Farming Platform Without Field Hardware
Farmonaut delivers precision agriculture through satellite data rather than on-field hardware, which is what makes it usable at both the 1-acre and the multi-thousand-acre end of the range described throughout this guide.
- Satellite-based crop health monitoring: Multi-spectral imagery for crop health, moisture, and vegetation indices (NDVI, EVI).
- Jeevn AI Advisory: AI-generated advice on weather, nutrition, and pest management.
- Blockchain product traceability: Supply chain transparency for farmers and buyers.
- Carbon footprinting: Emission tracking to support sustainability reporting.
- Fleet and resource management: Machinery, logistics, and safety monitoring.
Because the core data source is satellite imagery rather than purchased field sensors, the same account structure works for a single monitored field or a large agribusiness portfolio, with plans built for individual farmers, agribusinesses, and government or research organizations.
- Farmonaut Carbon Footprinting for emissions monitoring.
- Farmonaut Traceability Solutions for supply chain transparency.
- Fleet & Resource Management for agri-logistics.
- Crop Loan and Insurance for satellite-verified lending.
- Large-Scale Farm Management for plantations, forests, and cooperatives.
Calculator: Estimate Your Farm’s Precision Ag Value
Using AEM’s 2024 national benefit figures — $118/acre in overall value, 8% fertilizer optimization, and 5% water-use reduction — enter your own acreage and per-acre input costs below to see an estimated annual value range for your operation.
Run your own numbers
Assumptions: uses AEM’s 2024 national averages ($118/acre baseline value, 8% fertilizer optimization, 5% water-use reduction) applied to your own acreage and input costs. Excludes equipment financing cost, labor savings, and yield-price risk; actual results vary by soil type, crop, and current technology baseline. Source: AEM, 2024.
Farmonaut Subscription Options
Farmonaut’s subscription packages are built for farmers, agribusinesses, and government organizations at different scales.
Note: Our web and mobile apps let you monitor and manage farm operations from anywhere.
Challenges & Considerations
Precision agriculture’s gains are documented; the barriers to adoption are just as real:
- Upfront investment: GPS-guided equipment, VRT controllers, and sensor networks require capital before the $118/acre AEM value starts accruing.
- Technical expertise: Operating and interpreting farm management software is a new skill set for many operations.
- Data management: Storing and analyzing field-level data raises privacy and infrastructure questions.
- Connectivity: Rural broadband gaps limit real-time IoT and cloud-based tools in some regions; the FCC’s broadband data maps are the primary source for checking coverage in a specific county.
These are the reasons the 27% national adoption figure sits well below adoption on large farms specifically — the economics favor scale until equipment and software costs come down further or financing structures change.
Where the Precision Farming Model Goes Next
The AEM and USDA figures in this guide are both periodic: USDA’s precision-practice data comes from the Census of Agriculture, conducted roughly every five years, with the 2023 release the current baseline cited throughout this article. AEM’s benefit-cost study is an independent periodic analysis; check the AEM link above directly for whether a newer edition has been published before citing the $118/acre figure as current. Equipment pricing for GPS receivers, VRT controllers, and auto-steer kits moves with model year and dealer region — check with regional John Deere, AGCO, CLAAS, or Trimble dealers, or annual technology pricing reviews published by trade press such as Implement and Tractor Magazine, for current numbers rather than relying on any figure printed here.
What’s durable, independent of any single year’s pricing, is the adoption pattern itself: precision agriculture adoption tracks farm size closely, VRT and auto-steer usage moves together, and the largest documented value comes from stacking technologies (GPS plus VRT plus monitoring) rather than any one component alone. That structure is unlikely to change even as the specific percentages get refiled in the next census.
Frequently Asked Questions
What is precision agriculture?
A farming approach that uses GPS, IoT sensors, AI, and remote sensing to collect field-level data and apply inputs — seed, fertilizer, water, chemicals — at rates matched to what each zone of a field needs, rather than one rate across the whole field.
What percentage of U.S. farms use precision agriculture?
27% of U.S. farms used at least one precision agriculture practice as of the 2023 Census of Agriculture, per USDA ERS. Adoption is far higher on large-scale crop farms specifically: 70% use GPS auto-steer and 45% use variable rate technology.
What is controlled precision agriculture?
It’s precision agriculture applied inside a controlled-environment setting — a greenhouse, vertical farm, or hydroponic system — where the same GPS, sensor, and automation components manage a climate-controlled enclosure instead of an open field.
How much does precision agriculture actually save?
AEM’s 2024 study puts the average annual value at $118 per acre on row crops, made up of an 8% fertilizer optimization gain (about $20,000 per 1,000 acres), a 5% water-use reduction (about $16,000 per 1,000 acres), and a roughly 5% production boost (about $66,000 in added revenue per 1,000 acres from that yield gain).
What precision agriculture examples work on a small farm, like 1 acre?
Satellite-based crop monitoring, soil moisture sensors, and AI-driven irrigation and nutrition advisories scale down without needing dedicated field hardware. GPS-guided machinery and large-scale VRT generally require more acreage to justify the equipment cost.
Can I access Farmonaut on mobile?
Yes — Farmonaut is available as a web app, Android app, and iOS app, with real-time crop and field data on each.
Conclusion
Precision agriculture in the U.S. is documented, not speculative: 27% of all farms and 70% of large-scale crop farms already use it in some form, and AEM’s figures put a specific dollar value — $118 per acre, roughly $236,000 a year on a 2,000-acre operation — on what it returns. The method for judging any precision agriculture solution stays constant even as those numbers get refiled in future census and study cycles: check the adoption rate for your farm size and crop against USDA’s current release, check the per-acre value claim against AEM’s current study, and run your own acreage and input costs through the calculator above before committing capital.
Ready to start with the monitoring layer, no field hardware required? Try the Farmonaut platform.
For developers and agri-tech integrators: Access the Farmonaut Satellite & Weather API to build precision farming applications directly.

 Krishi GK
 Geno
Geno Hayleys Agriculture
 Linx Agritech
 Adinet
 Save Your Soils
 Grandstream Algérie
 XOS Realty
 Geospatial Lab Africa
 Agro La Gándara
 HIPSAC
 ZOL Zimbabwe
 Juligerm
 AdBio
AdBio MISE Maroc
 NWNS
NWNS

