

Farm records · Buyer and setup guide
Agricultural Database Management System: Uses and Setup
An agricultural database management system stores farm records in linked tables, so a field, animal or lot can be traced from input to sale. USDA NASS found 82% of US farms had a smartphone in 2025, while 22% used precision practices.
Key takeaways
- A DBMS stores and links records; a farm management information system (FMIS) is the finished application built on one.
- Start with nine linked tables: fields, plantings, inputs, applications, harvests, animals, treatments, machines and sales.
- Legal minimums differ: 2 years for US restricted use pesticide records, 3 for EU plant protection use, 5 for US organic records.
- In 2016, 50% of corn farms above 1,725 cropland acres used yield maps, against 7% under 200 acres (USDA ERS).
- Before buying, check that you can export all your data with its IDs, and price the software apart from any bundle.
In this article
- What an agricultural database management system does
- Uses of DBMS in agriculture
- Who uses farm data tools today
- The core tables to build first
- How long to keep farm records
- Dairy farm management system records
- Connecting machines, sensors and imagery
- How to choose: spreadsheet, FMIS or custom build
- Does it pay? Test your own numbers
- Who owns the data, and how to protect it
- A six-step rollout
- Where farm databases are heading
- FAQ
An agricultural database management system is software that stores all of a farm’s records in linked tables, so one field, animal or batch can be traced from input to sale. In 2025, 85% of US farms had internet access and 82% had a smartphone, but only 22% used precision agriculture practices to manage crops or livestock (USDA NASS, August 2025).
So the devices are often already on the farm. The gap is in how the records are organized. This guide shows the main uses of a DBMS in agriculture, the tables to build first and how long the law says to keep each record. A calculator then tests whether a system would pay for itself on your farm.
What an agricultural database management system does
DBMS stands for database management system. It is the layer that stores data, enforces rules and answers questions. On a farm it replaces separate notebooks, spreadsheets and machine memory cards with one set of connected records.
The key idea is the link. A spray record points to a field, a product and an operator. A yield record points to the same field. Because they share a field ID, you can ask which product was used on the best and worst blocks without retyping anything.
Terms overlap in this market, so it helps to separate them:
- Database: the stored tables and the rules that connect them.
- Farm management information system (FMIS): a finished application built on a database, with screens, maps and reports.
- Precision agriculture tools: yield monitors, soil maps, variable rate controllers and imagery. These feed data in, and some take prescriptions back out.
USDA’s Economic Research Service (ERS) noted in 2023 that farmers were increasingly subscribing to cloud-based FMIS tools, sometimes through input suppliers or service providers. If you are buying a product, you are buying an FMIS. If you hire a developer, you are building on a DBMS such as PostgreSQL.
Uses of DBMS in agriculture
These are the jobs where a linked database beats a pile of separate files.
- Compliance records. Pull every application on a field for an inspector or certifier, in minutes.
- Field profit. Join inputs, labor, machinery hours and yield by field to see which land earns its rent.
- Yield analysis. Compare hybrids, planting dates or soil zones over several seasons on the same field.
- Input planning. Turn past rates and soil tests into a purchase list before the season.
- Herd records. Track each animal’s births, treatments, milk tests and withdrawal dates.
- Traceability. Link a lot code back to the field or herd and forward to the buyer.
- Machinery upkeep. Log hours and repairs so service is planned, not forced by a breakdown.
- Lender and insurer files. Hand over clean acreage, production and sales history when asked.
Farmers put yield data to different uses. On corn acres with yield monitors in 2016, ERS charted uses that included monitoring crop moisture and negotiating crop leases. The mix varied by crop and year, though the survey wording changed in 2018. A database makes it easier to get more than one use from data you have already paid to collect.
Who uses farm data tools today
The NASS figures below cover US farms of all sizes, excluding Alaska and Hawaii. They show that basic access is well ahead of formal data practices. The share using precision practices was 27% in 2023 and 22% in 2025, in the same NASS report.
Chart
Digital access and use on US farms
Percent of US farms, excluding Alaska and Hawaii, 2025
Farm size matters a great deal. ERS found that 50% of corn farms above 1,725 acres of cropland had adopted yield maps in 2016, against 7% of those under 200 acres. ERS says adoption tends to rise with farm size across maps, variable rate and guidance on corn, soybeans, wheat and cotton. It suggests scale benefits could be one reason.
That has a practical meaning for smaller farms. You may not have a yield map to import. A simple database of fields, inputs, sales and animals can still do useful work, and machine data can be added later.
Chart
Corn farm technology adoption by farm size
Percent of farms with a surveyed corn field, smallest and largest cropland groups, 2016
The core tables to build first
Whether you buy or build, check that these records exist and connect. If a product cannot link them, you will end up back in spreadsheets. Each table needs one unique ID, and other tables point to that ID.
| Table | Main fields | Links to | Answers |
|---|---|---|---|
| Fields | Field ID, boundary, acres, owner or lease | Everything on the land | What do we farm, and on what terms? |
| Plantings | Crop, variety, date, rate | Fields, Inputs | What grew where each year? |
| Inputs | Product, lot, EPA or approval number, supplier, cost | Applications | What did we buy and at what price? |
| Applications | Date, time, dose, area, operator | Fields, Inputs, Machines | What was applied, when and by whom? |
| Harvests | Date, quantity, moisture, lot code | Fields, Sales | What did each field produce? |
| Animals | Animal ID, breed, birth, dam, group | Treatments, Sales | Who is in the herd? |
| Treatments | Medicine, batch, dose, withdrawal period, vet | Animals, Inputs | When is it safe to sell? |
| Machines | Unit, hours, service, repair cost | Applications | What is due, and what does it cost to run? |
| Sales | Buyer, date, quantity, price, lot code | Harvests, Animals | Who bought which lot? |
Boundaries deserve care. Store them as map shapes rather than a typed acreage. If you build your own system, PostGIS adds spatial data types and queries to PostgreSQL, so you can ask which records fall inside a given field.
How long to keep farm records
Your database design should follow the record rules that apply to you. The minimum periods differ by record and by country, so set the retention period per table and do not delete anything by a single date.
- US restricted use pesticides: certified applicators must record the application within 14 days and keep the record for 2 years.
- US organic operations: records must allow audit from purchase to sale and be kept for at least 5 years.
- US food traceability: covered firms keep records for 2 years and must supply them to FDA within 24 hours of a request, or an agreed reasonable time. Electronic links and true copies are allowed. The original January 2026 compliance date has moved: Congress told FDA not to enforce the rule before July 20, 2028. Check whether your crops and farm size are covered.
- US tax records: the IRS says to keep records for 3 years in the basic case, and longer in some situations.
- EU and GB plant protection products: professional users keep product name, time, dose, area and crop for at least 3 years (Regulation 1107/2009, Article 67, retained GB version). In the EU, Implementing Regulation 2023/564 also requires records not made electronically to be moved to electronic format within 30 days, for uses from 1 January 2026; member states may delay that step to 1 January 2027 (Regulation 2025/2203).
- EU animal medicines: keepers of food-producing animals must hold records for inspection for at least five years (Regulation 2019/6, Article 108).
- UK animal medicines: the keeper of a food-producing animal must retain purchase and treatment records for at least five years, even if the animal has died or left the farm.
These are summaries, not legal advice. State, provincial and scheme rules may ask for more. Check the product label and local rules, and ask your certifier or adviser which periods apply to your farm.
Chart
Minimum record-keeping periods, selected rules
Years; US tax figure is the IRS basic case
Dairy farm management system records
A dairy farm management system works at the level of the animal, not the field. Its links run between cow, lactation, test day, breeding event and treatment. That is why a dairy may keep a specialist herd program even when it uses other software for crops.
Check that a dairy system handles these jobs:
- Health and treatments: medicine, batch, dose, animal and withdrawal period. Article 108 of the EU regulation lists the withdrawal period as a required entry, even when it is zero.
- Reproduction: heats, services, pregnancy checks and expected calving dates.
- Milk records: yield and quality by animal or group, with test dates.
- Feed: rations and costs by group, so milk income can be set against feed spend.
- Sensors and wearables: activity or rumination data, if you use collars or tags. Ask how raw readings are stored and whether you can export them.
Mixed farms should look for shared records between the herd and crop sides. Silage made on a field should link to the group that ate it. If two separate programs must be used, agree the shared IDs early and test an export between them.
Connecting machines, sensors and imagery
Getting data in without retyping it is often a hard part. There are three main routes.
- Machines. ISOBUS, based on ISO 11783, is the shared standard for tractors and implements. The AEF conformance test certifies that products support specific functions, and certified products are listed in its database. Check the functions you need, not just the logo.
- Sensors. Soil moisture probes, weather stations and tank monitors send regular readings. Store summaries in the main tables and keep raw readings apart, or reports will slow down.
- Imagery. Satellite and drone layers show where a crop differs within a field. ERS found that in 2016 to 2019 imagery from drones, aircraft or satellites was used much less than maps or guidance on the crops it surveyed. Imagery shows that a crop has changed; a field check finds out why.
Farmonaut is one example of the imagery route. Its Satellite + AI Farm Monitoring System can feed crop-health layers into a farm’s own software through an API, and the video below shows the web app in use.

▶ Tutorial: monitoring crops in the Farmonaut web system with satellite data · 8:43
How to choose: spreadsheet, FMIS or custom build
No option suits every farm. Start from the size of the record problem and who will maintain the system.
| Option | Best for | Strength | Weakness |
|---|---|---|---|
| Spreadsheets | One operator, few fields | Low cost, familiar | Weak links, errors spread, poor audit trail |
| Bought FMIS | Working farms that want screens and maps | Ready to use, vendor support | Subscription, limits on custom reports |
| Herd software | Dairy and livestock | Built around the animal | Weak on field records |
| Custom database | Large groups, co-ops, agtech startups | Your own data model and rules | Needs a developer and upkeep |
Cost comparisons need care. ERS warns that FMIS tools are often bundled with inputs and consulting, so the cost of the software alone can be difficult or impossible for the farmer to see. Ask for the price without the bundle, and write it down with the date of the quote.
Questions to ask any vendor
- Can I export all my data, with field and animal IDs, in an open format?
- What happens to my data if I cancel?
- Does it read files from my machine brands, and which models were tested?
- Does it work offline in the field, and how does it sync?
- Who else can see my data, including partners and parent companies?
- Can it produce the exact report my inspector or certifier asks for?
- Are edits logged, with user and date?
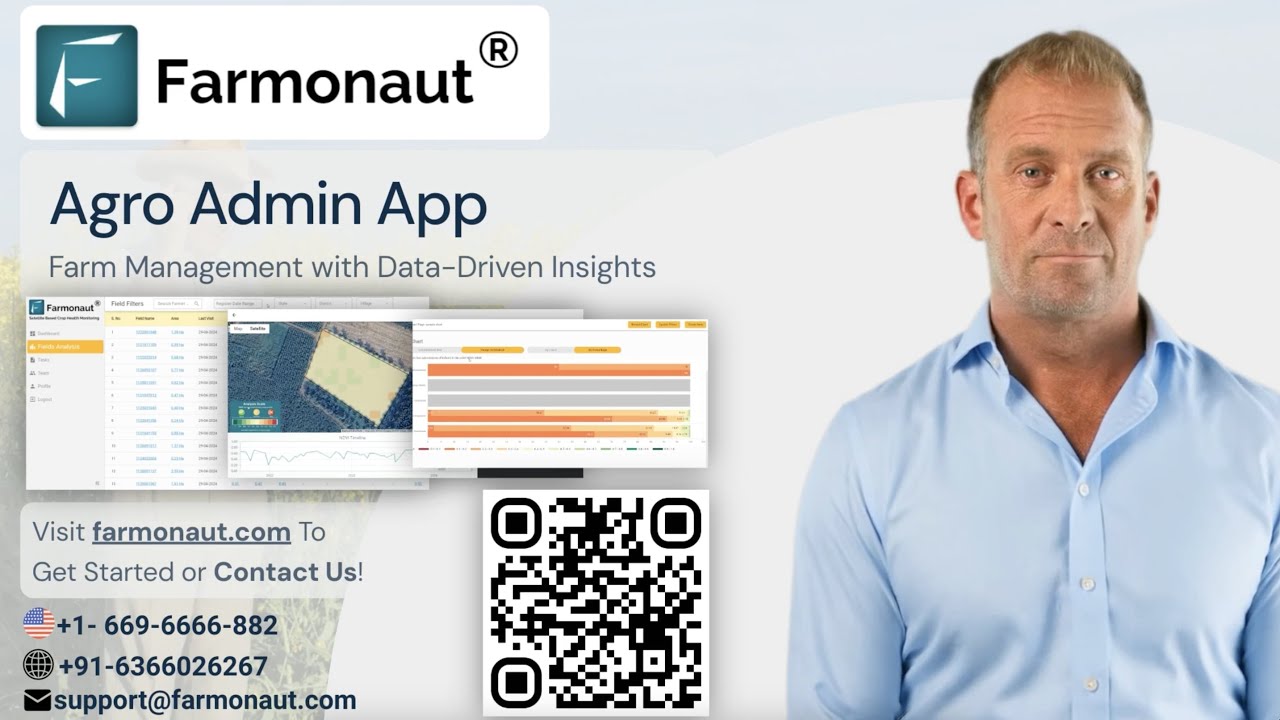
▶ The Farmonaut Agro Admin app for managing large-scale farm operations and tasks · 7:27
Does it pay? Test your own numbers
Time saved is the easiest benefit to measure, so the calculator uses it alone. Enter your own values. Any fall in rework, missed sprays or lost premiums would be an extra benefit.
Try the numbers for your own farm below.
Calculator
Would a farm database pay for itself?
Enter your own hours, wage and software quote.
- Value of time saved per year (US$): $1,560
- Year one cost with setup (US$): $1,600
- Net result in later years (US$): $360
- Hours per week to break even in year one: 1.5 hours
Example values only, set near break-even, not a benchmark or forecast. Use your own quote: all prices are examples. Counts office time saved only. Money in US$.
Who owns the data, and how to protect it
Read the contract before you load years of records. Rules and codes differ by region.
- United States: the Ag Data Transparent core principles, which grew out of 2014 work involving the American Farm Bureau, say farmers should own information from their operations and be able to retrieve it for use on other platforms. These are voluntary principles, not law.
- European Union: the Data Act has applied since 12 September 2025. It lets users of connected products, with agricultural machinery named as an example, access the data they co-create.
- Australia: the Australian Farm Data Code from the National Farmers’ Federation is a voluntary code for providers that manage farm data.
Then cover the basics yourself. Give each worker a separate login with only the access they need. Turn on two-step sign-in where offered. Keep a backup you control, and restore from it once a year to prove it works. Store a full export before you switch vendors.
A six-step rollout
Loading everything at once can stall a project. Phase the work and keep the old records until the new ones have passed a real test.
Infographic
Rolling out a farm database in 6 steps
- 1List your questionsWrite the reports you need for inspectors, lenders and yourself.
- 2Fix your IDsGive every field, animal and machine one permanent ID.
- 3Load one seasonEnter one crop year or herd group first, not your full archive.
- 4Run both systemsKeep old records going through one full cycle.
- 5Connect machinesAdd machine files, sensors and imagery after the basics work.
- 6Test and back upProduce a real report, export the data and restore a backup.
Connectivity should shape the plan. NASS counted 74% of US farms with internet through a cellular plan and 55% with broadband in 2025. If your signal is poor in the field, make sure the app stores entries offline and syncs later.
Training matters as much as software. Give each person one short task at first, such as logging sprays by phone. Add reports once entries are reliable. A database is only as good as what people type into it.
Where farm databases are heading
Three trends are worth tracking, though none replaces clean basic records.
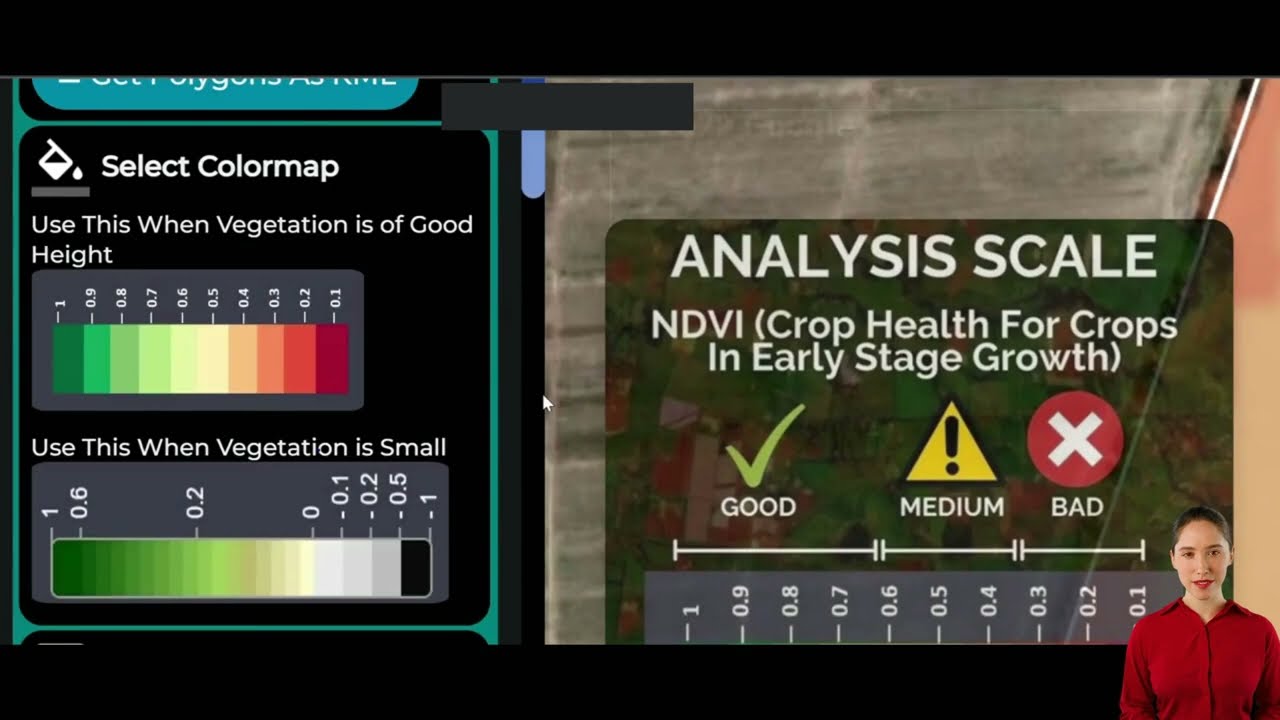
▶ How to read and interpret satellite data sets for farm decisions · 10:16
- AI on top of records. Models can flag anomalies and draft recommendations, but they rely on complete, consistent history. Have an agronomist or vet check advice before you act on it.
- Buyer and regulator demand. Traceability and sustainability reports need field-level records. Some buyers ask for lot-level or chain-of-custody files, so add lot codes early. Tamper-evident ledgers such as blockchain are an option, but ordinary logged edits meet many needs.
- Easier data movement. Rights such as the EU Data Act may make it simpler to take machine data with you, which lowers the risk of getting locked in to one vendor.
Our separate guide to farm data management looks at the wider practice; this page focuses on the database itself. Related pages on our site: satellite crop monitoring, agribusiness admin app, product traceability, fleet management, carbon footprinting, crop loan and insurance checks, satellite data API, API developer docs, web and mobile apps.
FAQ
What is an agricultural database management system?
It is software that keeps farm records in linked tables, such as fields, inputs, harvests, animals and sales. The links let you trace a product or compare fields without retyping data. Many farms use one through a farm management application.
What are the main uses of DBMS in agriculture?
Common uses are compliance records, field profit analysis, yield comparison, input planning, herd records, traceability, machinery upkeep and files for lenders or insurers.
How does a dairy system differ from a crop system?
A dairy system is built around the animal, with lactations, breeding and treatments. A crop system is built around the field, with plantings, applications and harvests. Integrated products try to cover both, so test how well each side works.
Can a small farm benefit from one?
It can, if the records are the real problem. Use the calculator to see how many hours a week the system must save. If that number is hard to reach, a well-kept spreadsheet with fixed field IDs may be enough for now.
Can I connect satellite data to my own farm software?
Yes, where the provider offers an API. Store the field ID, image date and index values in your own tables, so history stays with you if you change provider.
How is farm data kept secure?
Ask vendors about encryption, access controls, backups and who can see your data. On your side, use separate logins, two-step sign-in and a backup you control. Blockchain is not needed for ordinary record security.
Farmonaut crop monitoring
Add satellite crop data to your farm records
See crop-health layers for your own fields on web or mobile.




Keep reading
Sources
- USDA NASS, Technology Use (Farm Computer Usage and Ownership), August 2025: esmis.nal.usda.gov
- USDA ERS, Precision Agriculture in the Digital Era: Recent Adoption on U.S. Farms, EIB-248 (2023): ers.usda.gov
- 7 CFR 110.3, restricted use pesticide records (Cornell LII): law.cornell.edu
- 7 CFR 205.103, organic recordkeeping (Cornell LII): law.cornell.edu
- 21 CFR 1.1455, food traceability records (Cornell LII): law.cornell.edu
- US FDA, Food Traceability Final Rule page: fda.gov
- IRS, How long should I keep records?: irs.gov
- Regulation (EC) 1107/2009, Article 67 (legislation.gov.uk): legislation.gov.uk
- Regulation (EU) 2019/6, Article 108 (legislation.gov.uk): legislation.gov.uk
- UK Veterinary Medicines Regulations 2013, Part 3: legislation.gov.uk
- European Commission, Data Act explained: digital-strategy.ec.europa.eu
- Ag Data Transparent, Core Principles: agdatatransparent.com
- National Farmers’ Federation, Australian Farm Data Code: nff.org.au
- AEF, ISOBUS Conformance Test: aef-online.org
- PostGIS project: postgis.net
- PostgreSQL, About: postgresql.org
Discussion
Questions, corrections or field experience? Share them below. First-time comments are reviewed before they appear, and your email is never published.
No comments yet. Be the first to add a question or your experience.

 Andex
 AgroRangers
 FCF India
 Unifrutti Gulf
 Deluxe Conseil
 TVS Electronics
 BW Pipelines
 WICO
 Gen Chayat
 Chimera Innovation
 SkyHarvest
 Polaris Digitech
 Teledarbas
 Wild Oak Farm
 SFX

 Licence holder · Niger · Gold
 Client · Tanzania · Gold
 Client · Somalia · Gold
 Client & affiliate partner · Ghana · Gold










