

Reviewed August 2026 against USDA NASS, USDA ERS, and peer-reviewed IPM research (NCBI/NIH).
Try it: Run your own numbers →

Budget-friendly pest management and eco-friendly pest management are not two different goals — in practice they’re the same program. Integrated Pest Management (IPM) is a decision framework that uses monitoring, thresholds, and a mix of biological, cultural, mechanical, and chemical tools to cut input costs while reducing pesticide load. Across projects analyzed in peer-reviewed research, IPM adoption cut pesticide use to 30.7% of baseline levels while yields rose by a mean of 40.9%, and integrating wild pollinator conservation with IPM cut insecticide applications by up to 95% while maintaining or enhancing yields (NCBI/NIH). This guide breaks down what IPM actually costs, which strategies deliver the most savings per dollar, and how to build a program on your own farm — with a calculator at the end so you can run your own numbers.
Table of Contents
- What Is Integrated Pest Management?
- Why IPM Is Budget-Friendly Pest Management
- What Makes IPM Eco-Friendly Pest Management
- Core IPM Strategies and Methods
- Technology’s Role in Modern IPM
- Case Study: IPM in Almond Orchards
- Step-by-Step: Building an IPM Program
- Pollinator-Friendly IPM Practices
- IPM Cost-Savings Calculator
- FAQ
- Try it: Run your own numbers
What Is Integrated Pest Management?
Integrated pest management is a holistic, threshold-driven approach to pest control: instead of spraying on a calendar, farmers monitor pest populations, compare them against an economic threshold, and choose the lowest-impact tool that will bring the population back under that line. IPM in agriculture combines four elements — monitoring and identification, prevention through cultural practices, control using biological/physical/chemical tools in that order of preference, and evaluation of what worked. The USDA’s Office of Pest Management Policy coordinates the national IPM framework that most US extension programs still follow (USDA Office of Pest Management Policy).
IPM in agriculture is not one technique — it’s a sequencing rule. Cultural and biological controls come first because they’re usually cheaper and don’t create resistance. Chemical control stays on the list, but it’s the last resort, applied at the right time and dose rather than by habit. That sequencing is exactly what makes IPM strategies both budget-friendly and eco-friendly at once — the same threshold discipline that keeps unnecessary sprays off your invoice is what keeps them out of the watershed and away from pollinators.
Why IPM Is Budget-Friendly Pest Management
The budget case for IPM rests on avoided cost, not just lower chemical spend. When pesticide use in IPM systems runs at 30.7% of conventional-baseline levels and yields still rise by a mean of 40.9% across the projects studied, the math works in a farmer’s favor twice — once on the input line and once on the revenue line (NCBI/NIH). That’s the strongest quantified answer available right now to “does IPM actually save money,” and it’s the number worth anchoring a farm-level budget conversation on.
There’s a second budget signal in the certified-organic sector, which leans heavily on IPM-compatible, non-synthetic pest control. USDA NASS counted 17,445 certified organic farms in the United States in 2021, covering 4.9 million certified organic acres and generating $11.2 billion in certified organic product sales that year (USDA NASS). That’s not proof IPM alone drives that revenue — organic certification requires far more than pest management — but it shows a market segment built substantially on IPM-style, non-synthetic pest control that consumers are actively paying a premium for.
What the research brief does not have, and what no honest article should invent, is a dollar-per-acre figure for what budget-friendly IPM inputs cost against conventional pest control on a specific crop. USDA NASS’s Agricultural Chemical Use Program publishes crop-specific pesticide expenditure and rate data by state and crop year; if you want that comparison for your own crop and region, query it directly at the source (USDA NASS Agricultural Chemical Use Program). Similarly, there is no published national figure for pounds of active ingredient reduced through IPM adoption, or for US market spending on biological control agents and bioinsecticides — those are real gaps, not numbers to guess at.
Where the Savings Actually Show Up
- Fewer unnecessary applications: Threshold-based spraying means you only pay for control when the economic threshold is crossed, not on a fixed calendar.
- Lower resistance-management cost: Rotating modes of action and relying less on chemical control slows resistance development, which delays the point where you need a more expensive replacement product.
- Reduced crop loss from better timing: Monitoring catches outbreaks before they cross into yield-damaging territory, which is part of why IPM projects average a 40.9% yield increase over baseline.
- Market access: IPM-grown and certified-organic produce can access premium buyers — the $11.2 billion in 2021 US certified organic sales shows the scale of that market (USDA NASS).

What Makes IPM Eco-Friendly Pest Management
Eco-friendly pest management and IPM overlap almost completely on the ground, but they answer slightly different questions. “Eco-friendly” asks what happens to non-target organisms, soil, and water; IPM is the operational method that gets you there by minimizing chemical inputs and prioritizing biological and cultural controls. The clearest evidence for the eco-friendly case is the pollinator research already cited: combining IPM with wild pollinator conservation cut insecticide applications by up to 95% while yields were maintained or enhanced (NCBI/NIH). That’s a rare case where an environmental gain and a yield gain move in the same direction rather than trading off against each other.
Pollinators, including honeybees, native bees, and butterflies, pollinate a large share of US specialty crops — almonds, strawberries, and many tree fruits depend on managed or wild pollinator visits. Pollinator populations face pressure from pesticide exposure, habitat loss, and disease, which is why eco-friendly pest management treats pollinator protection as a core design constraint, not an afterthought. IPM’s contribution here is specific: targeted pesticide use, application timing outside peak foraging hours, and habitat conservation on field margins.
Balancing Pest Control and Pollinator Health
- Targeted Pesticide Use: Apply only when monitoring shows the economic threshold has been crossed, and choose formulations with lower bee toxicity ratings.
- Timing of Applications: Avoid spraying during peak pollinator foraging hours, typically mid-morning to late afternoon.
- Habitat Conservation: Maintain flowering field margins and unsprayed buffer strips as pollinator refuges.
- Diversification: Stagger flowering plant species so pollinators have a continuous food source through the season.
Farmonaut’s satellite-based crop monitoring gives farmers a way to act on that first principle — targeted use — by flagging exactly where and when stress or pest pressure is building, so pesticide decisions follow field data instead of a fixed schedule.
Core IPM Strategies and Methods
Integrated pest management methods fall into four operational categories, applied in a preferred order: monitoring and thresholds first, then cultural controls, then biological and mechanical controls, with chemical control reserved for when the other layers aren’t enough on their own.
1. Monitoring, Record-Keeping, and Threshold Levels
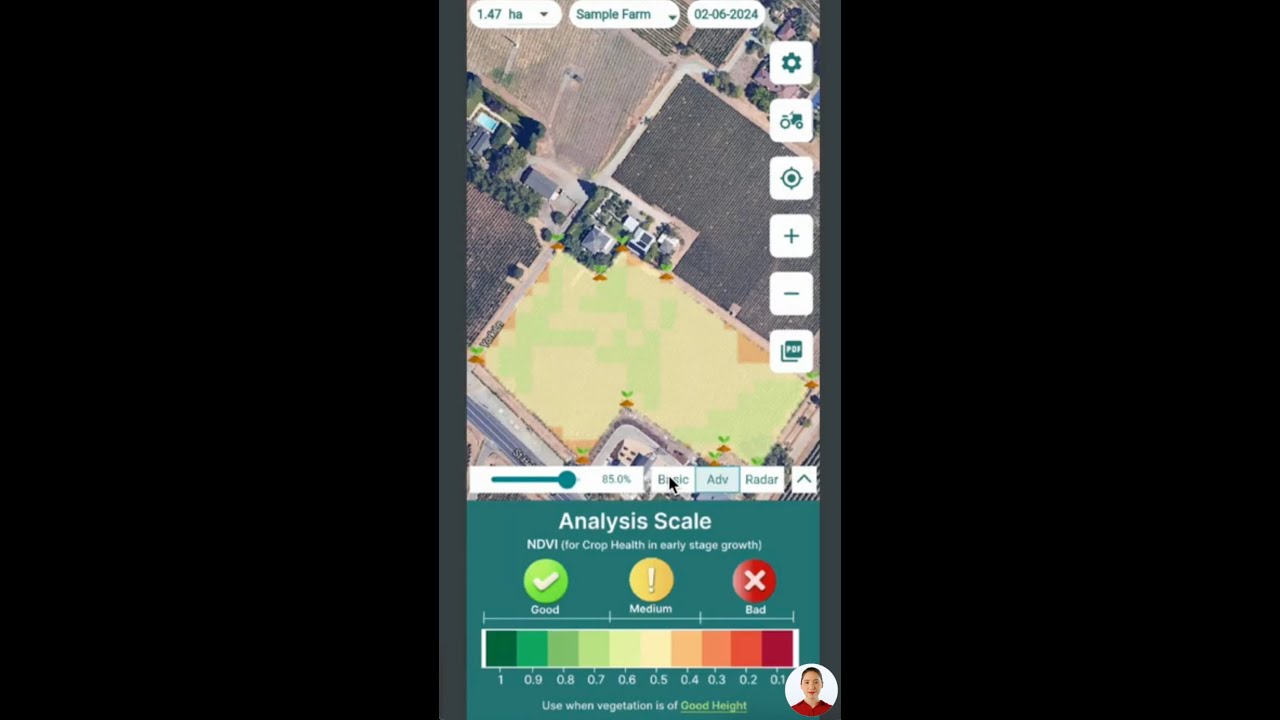
Regular field scouting and record-keeping let farmers identify pest species accurately, track population trends over the season, and catch disease symptoms early. The practical decision tool here is the economic threshold — the pest density at which the cost of damage exceeds the cost of control. Below that line, spraying is a pure cost with no return; above it, control pays for itself. Farmonaut’s satellite monitoring and Jeevn AI advisory system support this by surfacing crop-stress signals (via NDVI and related vegetation indices) that can indicate pest pressure building before it’s visible from the field edge.
2. Cultural Controls
- Crop Rotation: Alternating crops disrupts pest life cycles that depend on a consistent host year over year.
- Irrigation Management: Avoiding over-watering removes conditions that favor certain fungal pathogens and pests.
- Sanitation: Removing crop residue and controlling weeds eliminates overwintering sites for many pest species.
- Companion Planting: Interplanting species that repel pests or attract beneficial insects reduces pressure without any spray pass.
3. Mechanical and Physical Controls
- Traps: Pheromone and sticky traps both monitor and, at scale, suppress pest populations.
- Row Covers: Physical barriers protect crops during their most vulnerable growth stages.
- Mulching: Organic mulch suppresses weeds and creates habitat for ground-dwelling beneficial insects.
These methods carry a real cost-efficiency advantage in organic farming systems, where chemical options are restricted and mechanical controls do double duty as both prevention and evidence for certification records.
4. Biological Control
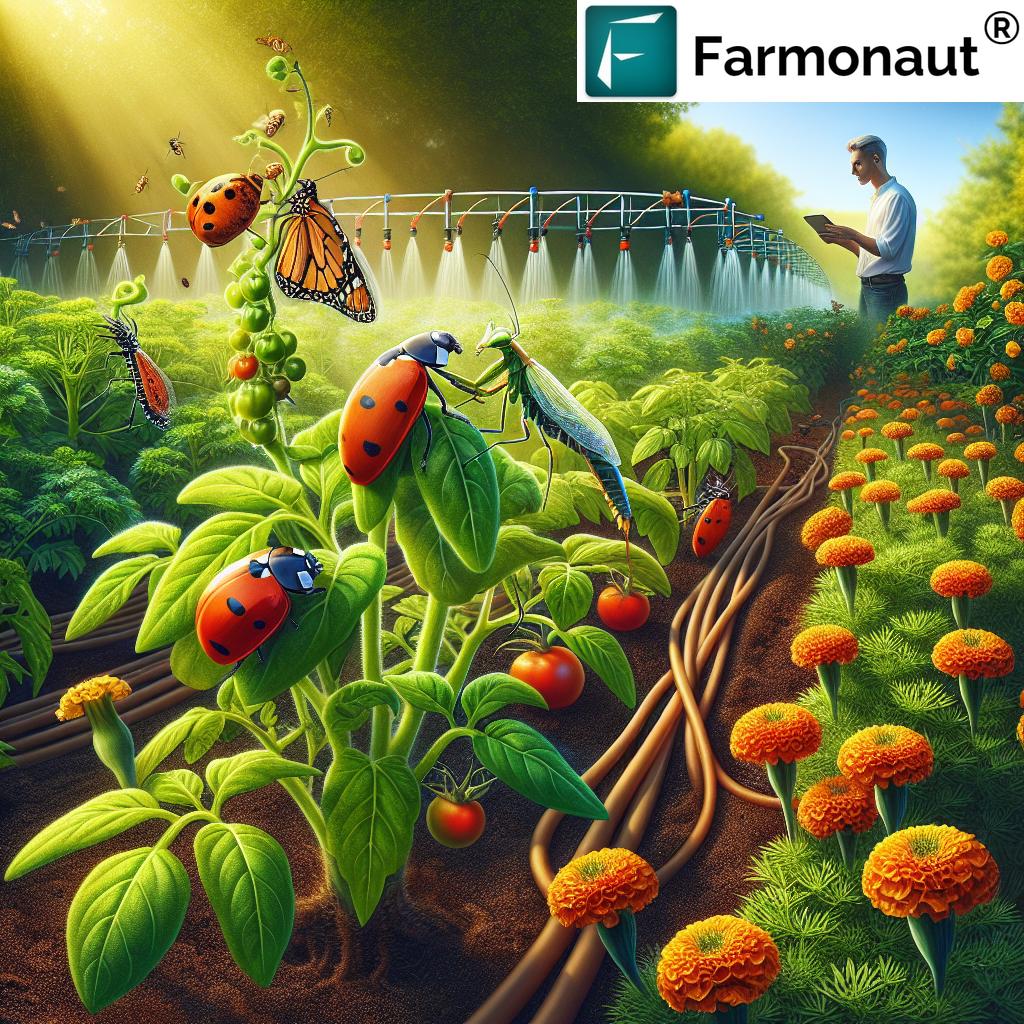
- Conservation of Natural Enemies: Habitat that supports predators and parasitoids of crop pests keeps pressure down without an input purchase.
- Augmentation: Releasing beneficial insects boosts natural populations when they’re too low to keep pace with pest pressure on their own.
- Classical Biological Control: Introducing a pest’s natural enemy from its native range is used against established invasive species, under regulatory oversight.
5. Responsible Chemical Control
IPM doesn’t eliminate chemical control — it constrains when and how it’s used. Best practice is to choose the least-toxic, most-targeted product available, apply it at the point in the pest’s life cycle where it’s most vulnerable, use precision application to limit drift, and rotate modes of action to slow resistance. This is the layer where the pesticide-use reduction shows up most directly: in the projects analyzed, IPM systems used pesticide at 30.7% of the baseline rate while still lifting yields (NCBI/NIH).
| IPM Strategy | Effectiveness (1-5) | Eco-Friendliness (1-5) | Pollinator Impact | Implementation Complexity | Cost Efficiency |
|---|---|---|---|---|---|
| Beneficial Insect Introduction | 4 | 5 | Positive | Medium | Medium |
| Pheromone Traps | 3 | 5 | Neutral | Low | High |
| Crop Rotation | 4 | 5 | Positive | Medium | Medium |
| Companion Planting | 3 | 5 | Positive | Low | High |
| Irrigation Management | 4 | 4 | Neutral | Medium | High |
| Weed Control | 4 | 3 | Neutral | Medium | Medium |
Technology’s Role in Modern IPM
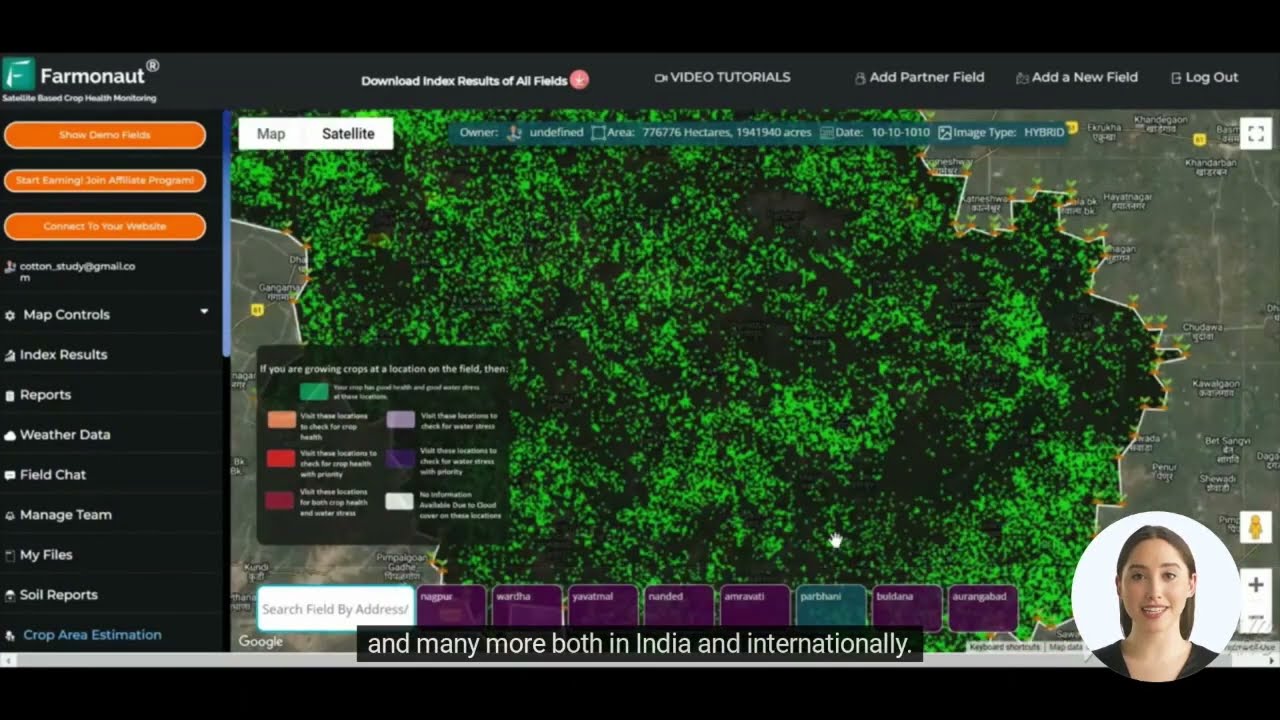
Satellite crop monitoring, AI advisory systems, and precision application equipment have changed what “monitoring” means in practice — from weekly manual scouting alone to continuous field-level data. Farmonaut’s satellite imagery tracks vegetation indices like NDVI across a field, flagging stressed zones that may indicate pest activity before visible damage spreads. Explore Farmonaut’s API for advanced satellite data access if you want to integrate that data into your own farm management system.
Farmonaut’s Jeevn AI system layers weather data and historical pest patterns on top of satellite imagery to generate management recommendations, and GPS/drone-guided precision application narrows the spray footprint to where it’s actually needed — both mechanisms that push a farm’s realized pesticide use closer to the 30.7% figure cited above rather than the untargeted baseline.

Case Study: IPM in Almond Orchards
Almond orchards illustrate the budget-and-eco-friendly overlap well because growers face real pest pressure — navel orangeworm and peach twig borer among the main targets — while depending on honeybee pollination for the crop itself. Any pest-control decision that harms pollinators directly threatens yield, which forces a genuinely integrated approach rather than a token one.
- Winter Sanitation: Removing mummy nuts from the orchard floor reduces the overwintering population before the season even starts.
- Pheromone Disruption: Mating disruption technology suppresses key pest populations without a residual chemical application.
- Beneficial Insect Habitat: Cover crops between rows support the natural enemies that keep secondary pests in check.
- Targeted Spraying: Satellite data identifies specific hotspots for precise application instead of blanket coverage across the block.
This sequencing — sanitation and disruption before any spray decision, and precision targeting when a spray is warranted — is a direct application of the threshold-and-sequencing model in the “core strategies” section above, applied to a crop where pollinator dependence raises the stakes of getting it wrong.
Step-by-Step: Building an IPM Program
This is the durable part of the guide — a checklist that holds regardless of what pesticide prices or pest pressure look like in a given season.
- Assess your farm: Document current pest management practices and where costs or crop losses are concentrated.
- Set clear goals: Define specific targets — a percentage reduction in pesticide spend, or a target beneficial-insect presence level.
- Develop a monitoring plan: Set a regular scouting schedule; layer in satellite monitoring for continuous field-level signal between scouting visits.
- Identify key pests and beneficials: Build a reference list specific to your crops and region — extension services maintain these for most major US crops.
- Implement cultural controls: Rotation, irrigation management, and sanitation come first because they’re typically the lowest-cost layer.
- Introduce biological controls: Habitat management or augmentative releases where natural enemy populations are insufficient on their own.
- Use mechanical and physical controls: Traps, barriers, and mulches where the crop and pest profile support them.
- Apply chemical controls judiciously: Choose the least-toxic option that clears the economic threshold, applied with precision equipment where available.
- Keep detailed records: Log every action, outcome, and cost — this is what lets you calculate your own savings figure next season.
- Evaluate and adjust: Review what worked at season’s end and revise thresholds and tactics accordingly.
Because this sequence doesn’t depend on any single year’s pest pressure or price level, it’s the part of an IPM program worth revisiting annually even when the underlying numbers shift.

The Benefits of IPM: Economic Summary
The benefits of IPM break into five categories that reinforce each other rather than trading off:
- Reduced input costs: Lower pesticide volume purchased and applied, in line with the 30.7%-of-baseline figure cited above.
- Improved crop quality: Fewer pest-related defects can support stronger market positioning.
- Access to premium markets: The certified-organic sector alone generated $11.2 billion in US sales in 2021, a market substantially reliant on non-synthetic pest management (USDA NASS).
- Long-term soil health: Cultural IPM practices that build soil health compound into future-season fertility and yield.
- Risk mitigation: Diversified tactics protect against the moment any single tool stops working — whether from resistance or a regulatory change.
The organic sector’s growth trend gives a sense of direction, if not a precise IPM-specific figure: certified organic cropland acres grew 79% from 2011 to 2021, and the number of certified organic farm operations grew 90% over the same period (USDA NASS, USDA ERS).
Pollinator-Friendly IPM Practices
Protecting pollinators is inseparable from eco-friendly pest management in any crop that depends on insect pollination. Specific practices that support pollinator health within an IPM framework:
- Diverse Planting Schemes: A succession of flowering plants blooming across the season keeps a continuous food source available.
- Buffer Zones: Pesticide-free strips around fields function as safe refuges.
- Timing of Applications: Spraying during low pollinator activity — early morning or late evening — cuts exposure without changing the product used.
- Selective Pesticides: Choosing lower-toxicity-to-bees formulations when chemical control is genuinely necessary.
- Reduced Tillage: Conservation tillage protects ground-nesting pollinator species from soil disturbance.
This is where the strongest quantified result in the research applies directly: IPM combined with wild pollinator conservation practices cut insecticide applications by up to 95% while maintaining or enhancing yields (NCBI/NIH). That’s not a tradeoff between environmental performance and output — in the studied projects, both moved in the farmer’s favor together.


Education, Outreach, and Where to Track New Data
IPM adoption at scale depends on ongoing extension work: farmer training workshops and field days, university extension research, digital pest-identification libraries, peer-to-peer grower networks, and consumer education that sustains demand for IPM-grown produce. None of that infrastructure is static — USDA NASS’s Quick Stats database is the direct way to track it yourself: search “organic” by state and crop to pull current certified organic acreage and farm counts, since the next full Census of Agriculture cycle updates that dataset (USDA NASS Organic Production Survey). If you need a national IPM-adoption percentage more current than what’s published in the sources above, or a state-specific pesticide-expenditure comparison, USDA NASS’s Agricultural Chemical Use Program is the correct source to query directly rather than relying on a secondhand figure (USDA NASS Agricultural Chemical Use Program).
IPM Cost-Savings Calculator
Use your own acreage and current pesticide spend to see what the research-brief pesticide-reduction rate (pesticide use at 30.7% of baseline under IPM) implies for your farm, alongside an estimated yield-value gain based on the 40.9% mean yield increase reported across IPM projects.
Run your own numbers
Assumptions: the default 30.7% pesticide-use rate and 40.9% yield-increase figure come from the peer-reviewed IPM project analysis cited above and are means across the projects studied, not a guarantee for any specific farm, crop, or region — replace them with your own historical data if you have it. The calculator excludes labor cost changes, monitoring equipment or subscription costs, and transition-year variability, and it does not model multi-year effects such as resistance management or soil health improvement.
Challenges and What Would Change This Picture
IPM adoption still faces real constraints: climate change is shifting pest ranges and pressure timing, invasive species keep entering systems without established natural enemies, and pest resistance to both chemical and some biological controls continues to evolve. None of that is static, which is why the checklist above — assess, monitor, sequence controls, record, evaluate — is built to be rerun every season rather than followed once. If a new nationally representative IPM-adoption percentage or a national pounds-of-active-ingredient reduction figure is published, USDA NASS’s Agricultural Chemical Use Program and the USDA Office of Pest Management Policy are the two sources positioned to carry it (USDA NASS Agricultural Chemical Use Program, USDA Office of Pest Management Policy).
Conclusion
Integrated pest management earns both labels — budget-friendly and eco-friendly — because the same threshold-driven, sequenced approach that avoids unnecessary spending is what avoids unnecessary chemical exposure to pollinators and ecosystems. The measured results are specific: pesticide use down to 30.7% of baseline, mean yield up 40.9% across the projects analyzed, and up to a 95% insecticide-application reduction where IPM pairs with pollinator conservation (NCBI/NIH). The certified-organic sector’s growth — 79% more cropland acres and 90% more farm operations between 2011 and 2021, reaching $11.2 billion in 2021 sales — shows a real market rewarding this approach (USDA NASS). Building your own program comes down to the ten-step sequence above, backed by field-level monitoring data, whether that’s manual scouting, satellite imagery, or both together as part of a broader agricultural system.
Further reading:
Frequently Asked Questions (FAQ)
- What is Integrated Pest Management (IPM)?
IPM is a holistic approach to pest control that sequences monitoring, cultural, biological, mechanical, and chemical methods — in that order of preference — to manage pest populations while minimizing cost and environmental impact. - What are the benefits of IPM?
In the peer-reviewed project analysis cited above, IPM systems used pesticide at 30.7% of baseline levels while mean yields rose 40.9% across projects, and pairing IPM with wild pollinator conservation cut insecticide applications by up to 95% while maintaining or enhancing yield (NCBI/NIH). - Is IPM more expensive than conventional pest control?
Initial monitoring and prevention investment can raise costs early on, but the reduced pesticide volume, lower resistance-management costs, and yield gains documented in IPM project data point toward net savings over a season, and sustainable soil practices compound those savings over multiple years. - What are the core integrated pest management methods?
Monitoring and threshold-setting, cultural controls (rotation, irrigation management, sanitation, companion planting), mechanical and physical controls (traps, row covers, mulching), biological control (natural enemy conservation, augmentation, classical biocontrol), and targeted chemical control as the last resort. - How does IPM benefit pollinators?
IPM reduces reliance on broad-spectrum pesticides, times any necessary applications outside peak pollinator activity, and maintains flowering habitat — practices that, combined with wild pollinator conservation, were linked to a 95% cut in insecticide applications in the research cited above. - Can IPM be used in organic farming?
Yes. IPM’s preventive, biological, and cultural emphasis aligns closely with organic certification standards, which is part of why the certified organic sector — 17,445 US farms and 4.9 million acres in 2021 — leans heavily on IPM-compatible practices (USDA NASS). - How does Farmonaut’s technology support IPM?
Farmonaut’s satellite crop monitoring, Jeevn AI advisory system, and precision-application data help farmers detect pest pressure early and target interventions, supporting the threshold-based, low-input approach at the center of IPM. - How do I start implementing IPM on my farm?
Follow the ten-step sequence in this guide: assess current practices, set goals, build a monitoring plan, identify key pests and beneficials, layer in cultural then biological then mechanical controls, apply chemical control only past threshold, keep records, and evaluate each season.

 Marei Nursery
 Sayaji Group
 eKGIS
eKGIS Mostas Tech
 Native Seeds
 Andex
Andex FCF India
 Unifrutti Gulf
 Deluxe Conseil
 TVS Electronics
 BW Pipelines
 WICO
WICO Chimera Innovation
 SkyHarvest
 Polaris Digitech
