

Farm planning · Step-by-step guide
Crop Planning and Management: 7 Steps and Budget Tool
Crop planning sets each field’s crop, sequence, inputs and break-even price before the season. Management keeps the crop on that plan. Corn yielded 28.1% more on average in more diverse rotations across 11 North American experiments (One Earth, 2020).
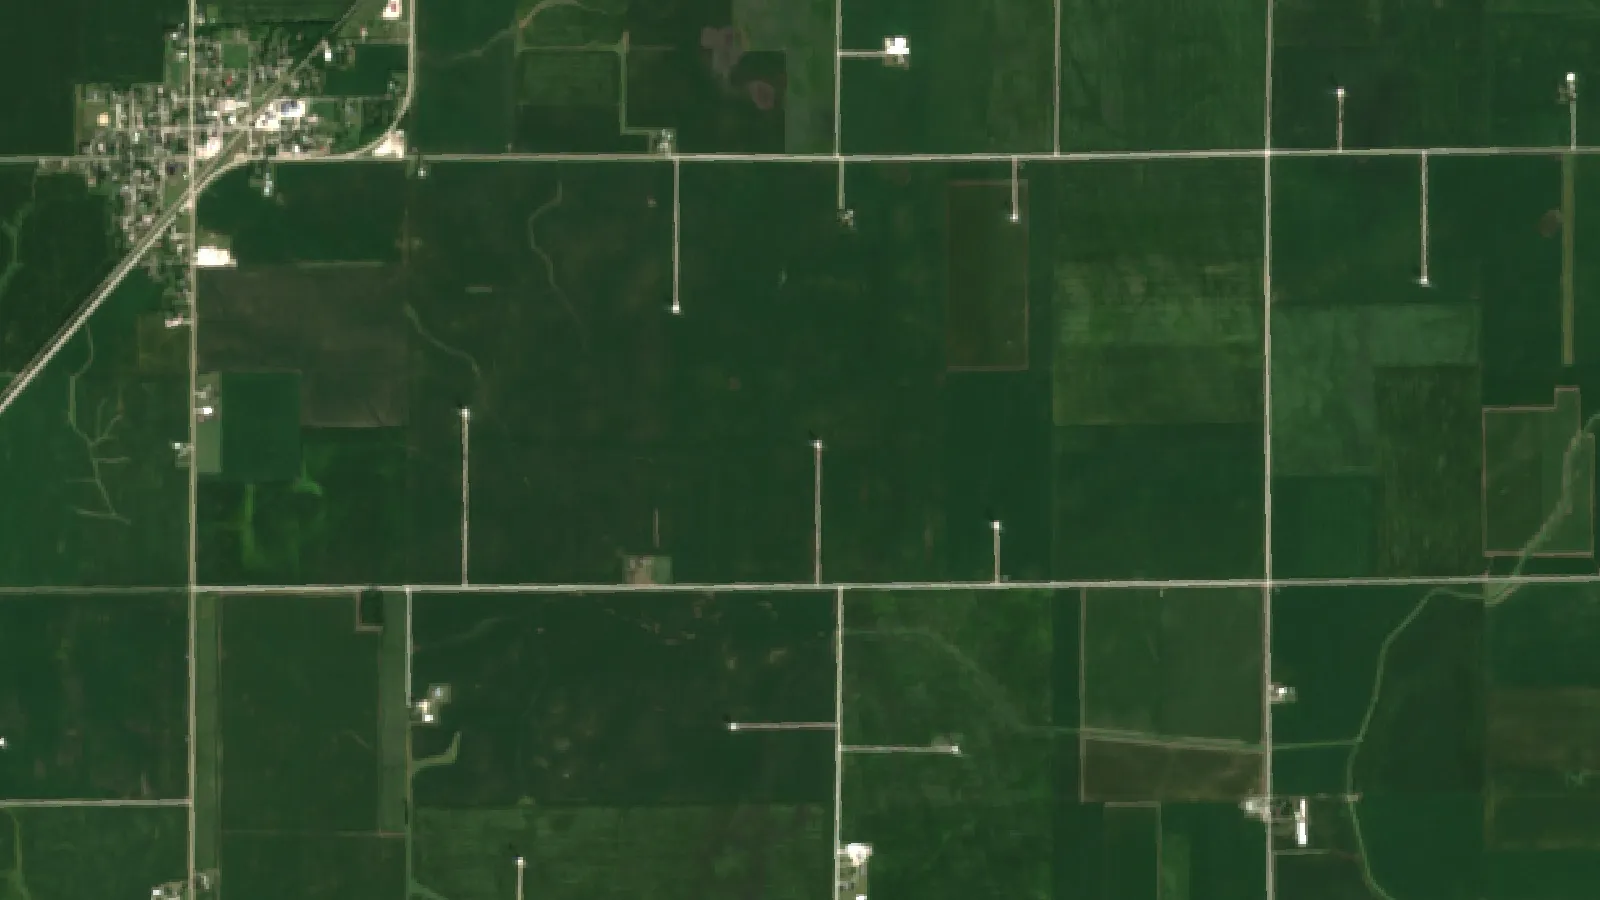
Key takeaways
- A cropping plan is one line per field: crop, yield goal, budget, key dates and a fallback.
- Corn in more diverse rotations yielded 28.1% more on average, and drought-year yields were 14.0% to 88.9% higher at six of nine US sites (One Earth, 2020).
- Cover crops were on 8.4% of US corn acres and 11.1% of soybean acres in the latest USDA surveys for those crops (2021 and 2023).
- University of Illinois 2027 budgets show corn break-evens near US$5 in northern and central Illinois; a US$0.50 price move shifts returns by over US$100 per acre (September 2026).
- USDA ERS: 70% of large-scale US crop farms used autosteering in 2023; small family farms had the lowest use of every technology.
In this article
- What crop planning and management means
- How to build a crop plan in seven steps
- Strategy 1: Choose crops and rotate them
- Strategy 2: Manage soil fertility field by field
- Strategy 3: Use integrated pest management
- Strategy 4: Use precision tools that match your size
- Strategy 5: Try intercropping where it fits
- Strategy 6: Plan for weather and price risk
- Strategy 7: Protect the land the plan depends on
- Crop budget calculator: compare two crops
- Comparing the seven strategies
- Crop planning and management tools
- A season calendar you can copy
- Common mistakes in a crop plan
Crop planning and management means deciding, before the season starts, what to grow on each field, in what order, with what inputs and at what break-even price, then checking the crop against that plan until harvest. One well-documented gain comes from rotation: across 11 North American experiments, corn in more diverse rotations yielded 28.1% more on average than in simplified rotations (One Earth, 2020).
This guide gives you a seven-step way to write a crop plan, seven strategies, with dated numbers where they exist, and a calculator that compares two crops on your own costs. Most numbers come from US sources because USDA survey data are detailed and public. The method works the same way on a farm in Canada, the UK, Europe, Australia or New Zealand; only the dates, programmes and rules change.
What crop planning and management means
The two words cover two stages. Crop planning happens before planting. You match crop choice, field order and input timing to your soil, climate and market. Crop management happens after planting. You scout, feed, protect and harvest the crop, and you change course when the season does not follow the plan.
A cropping plan is the written or digital record of those decisions, usually one line per field for the year ahead. A good one fits on a single sheet and answers six questions for each field:
- What crop and variety goes here, and what grew here in the last three years?
- What yield do I expect, based on this field’s own record?
- What will the crop cost per acre or hectare, including land?
- What price do I need to break even, and how much is already sold?
- When do planting, feeding, scouting and harvest need to happen?
- What is the fallback if planting is late or a pest arrives?
Farm planning is the wider job. It also covers labour, machinery, finance and land. This page stays with the crop side of that job.
How to build a crop plan in seven steps
A plan is easiest to build field by field, in the same order each year. This sequence works for a row-crop farm or a mixed vegetable operation.
- Map every field. Record area, soil type, drainage and the last three years of crops, yields and problems. This history drives the rotation.
- Take soil tests. Test pH, phosphorus, potassium and organic matter before you choose crops and rates. Soil health practices matter more once you know the starting point. Iowa State University suggests planning a test every two years for most cropping systems, and says three or four years may be acceptable when fields sit near optimum levels (PM 1688, 2013).
- Choose crops and varieties. Start from what you can sell, then check each field’s rotation. Avoid the same crop family where disease or pest pressure was high last year.
- Set yield goals and budgets. Use your own field averages, not your best years. Price seed, inputs, machinery hours and land per field, then work out the break-even price per bushel, tonne or box.
- Schedule the season. Set planting windows, feeding dates, scouting rounds and harvest order. In the US, add your county’s crop insurance sales-closing and acreage-reporting dates.
- Plan for risk. Decide in advance what you would replant or switch to if planting is late, and what your insurance covers.
- Record and review. Log what you applied, when and where. After harvest, compare yield maps or satellite crop-health maps with the plan. That record starts next year’s plan.
Paper and a spreadsheet are enough to start. Software earns its place when you manage many fields and want records, maps and schedules in one place.
Strategy 1: Choose crops and rotate them
Match each crop to local climate, soil test results and a realistic market before you commit the land. Then order those crops so that each one leaves the field in good shape for the next. Alternating corn, soybeans, small grains or forage legumes breaks pest and disease cycles that build up when one crop follows itself. It also means one low commodity price does not hit the whole farm.
The evidence is strong. A study in One Earth (2020) pooled 347 site-years of yield data from 11 long-term experiments in North America. Corn in more diverse rotations yielded 28.1% more on average than in simplified rotations, and 22.6% more in favourable conditions. In the worst drought years at nine US sites, diverse rotations out-yielded simple ones by 14.0% to 88.9% at six sites; Colorado, Minnesota and Maryland showed no gain.
USDA’s Agricultural Research Service reached a similar view in 2024 after comparing 20 long-term experiments that spanned up to six decades. Diverse rotations improved the results of the whole rotation under poor growing conditions, and which crops were in the rotation mattered more than how any one crop did. The same summary warns about the costs: more diverse rotations can make management harder and may need new equipment and new skills.
So before you add a crop, ask three things:
- Can I sell it? Find the buyer, the contract terms and the delivery point first.
- Can I grow it with what I own? Check the planter, header, storage and herbicide carryover on the labels.
- Does it pay over the full rotation? Judge the sequence over several years, because a lower-margin crop can lift the yield of the next one.
SARE’s book on crop rotation for organic farms includes instructions for making rotation planning maps, and those maps are just as useful on a conventional farm.
A simple way to plan the sequence
Write each field down the left of a sheet and the next four or five years across the top. Fill in what you know, then read each row. Look for the same family twice in a row, a legume before a heavy nitrogen user, and a gap in the calendar where a cover crop could fit. Then read each column. Add up the area per crop and ask whether that total fits your market, your machinery and your labour in the busiest week.
Chart
Corn yield gain from more diverse rotations
Percent above simplified rotations, 11 long-term North American experiments, 347 site-years
Strategy 2: Manage soil fertility field by field
Good fertility work holds yield over many seasons, not just one crop cycle. Organic matter and cover crops work alongside fertilizer rather than in place of it.
- Soil testing: regular tests target nutrients at the fields that respond, instead of a blanket rate.
- Organic matter: compost, manure or green manure add nutrients and feed soil life.
- Cover crops: they protect soil from erosion, suppress weeds and cycle nutrients between cash crops.
- Crop residue: leaving residue in place holds moisture and protects soil structure.
Cover crops and conservation rotations still cover a minority of corn and soybean acres. In USDA’s most recent field surveys for each crop (2019 to 2023), cover crops were on 8.4% of corn acres and 11.1% of soybean acres. Conservation crop rotations were on 23.9% of corn acres and 22.2% of soybean acres (USDA ERS, 2025 report). Staying with cover crops is also a challenge: only 46% of US operations with cover crop acres in the 2017 census reported them again in 2022, according to the same ERS report.
That drop-out rate is a planning lesson. Start cover crops on one or two fields where the following crop and the seeding date suit them. SARE’s Managing Cover Crops Profitably is a detailed reference. Add more area only when you have seen how the system works on your own ground.
In the UK, AHDB’s Nutrient Management Guide (RB209) gives fertilizer planning guidance for UK crops. Elsewhere, use your state, provincial or national extension guidance, because rates depend on local soil and crop trials. Follow local nutrient rules and any water-protection limits.
Chart
Cover crops and rotations by US crop
Percent of acreage, latest USDA ARMS field survey per crop, 2019 to 2023
Strategy 3: Use integrated pest management
Integrated pest management (IPM) combines cultural, biological, physical and chemical controls, and it uses chemicals only when monitoring shows they are needed. The US Environmental Protection Agency describes four steps:
- Set action thresholds. Decide the pest level at which control pays. One pest in the field does not always mean you need to act.
- Monitor and identify. Many insects and weeds do no economic harm, and some are helpful. Name the pest before you choose a control.
- Prevent. Use rotation, resistant varieties, clean seed and planting dates to stop problems before they establish.
- Control. Start with the less risky options. Use targeted sprays if monitoring and thresholds say you need them.
Put IPM in the plan itself. Add scouting dates to the calendar, write the threshold for each key pest next to the crop, and record what you found. Rotating modes of action also slows resistance. Always read the product label, follow local rules and get advice from a licensed adviser before any application.

▶ Can AI spot crop pests before they damage the harvest? A look at AI pest detection. · 6:32
Strategy 4: Use precision tools that match your size
Precision tools are now common on bigger crop farms, but adoption falls as farms get smaller. USDA ERS reported that 70% of large-scale crop farms and 52% of midsize farms used guidance autosteering in 2023, up from single digits in the early 2000s. It also found that 68% of large-scale crop farms used yield monitors, yield mapping or soil maps. Small family farms had the lowest use in every technology category.
Chart
Precision tool use on US crop farms, 2023
Percent of farms in each size group, the figures USDA ERS states in its summary
The right question is not which tool is newest. It is which decision you would change if you had better data. A rough order for most farms looks like this:
- Records first. A clean field history helps every other tool.
- Soil and yield maps. These show which parts of a field differ and whether the difference repeats from year to year.
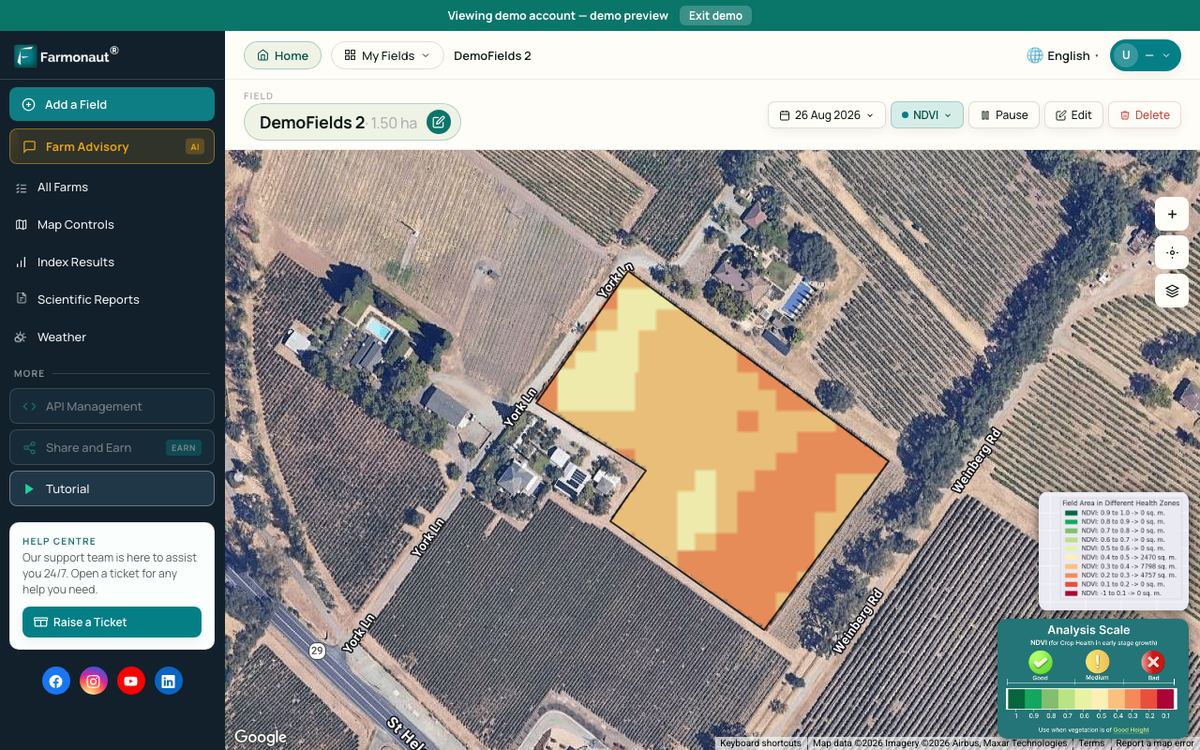
- Satellite crop-health maps. NDVI imagery shows where vegetation differs across a field, so you know where to scout first. It shows the change, not the cause, so someone still has to walk the spot. Farmonaut is one provider of these maps.
- Variable-rate equipment. It is most likely to pay where the field’s differences are large and stable enough to act on, so test it with a strip trial before you spend.
Be careful with vendor claims about software returns. Value depends on farm size, the number of fields and how consistently the records are kept. Run a one-season trial on part of the farm and compare what changed.
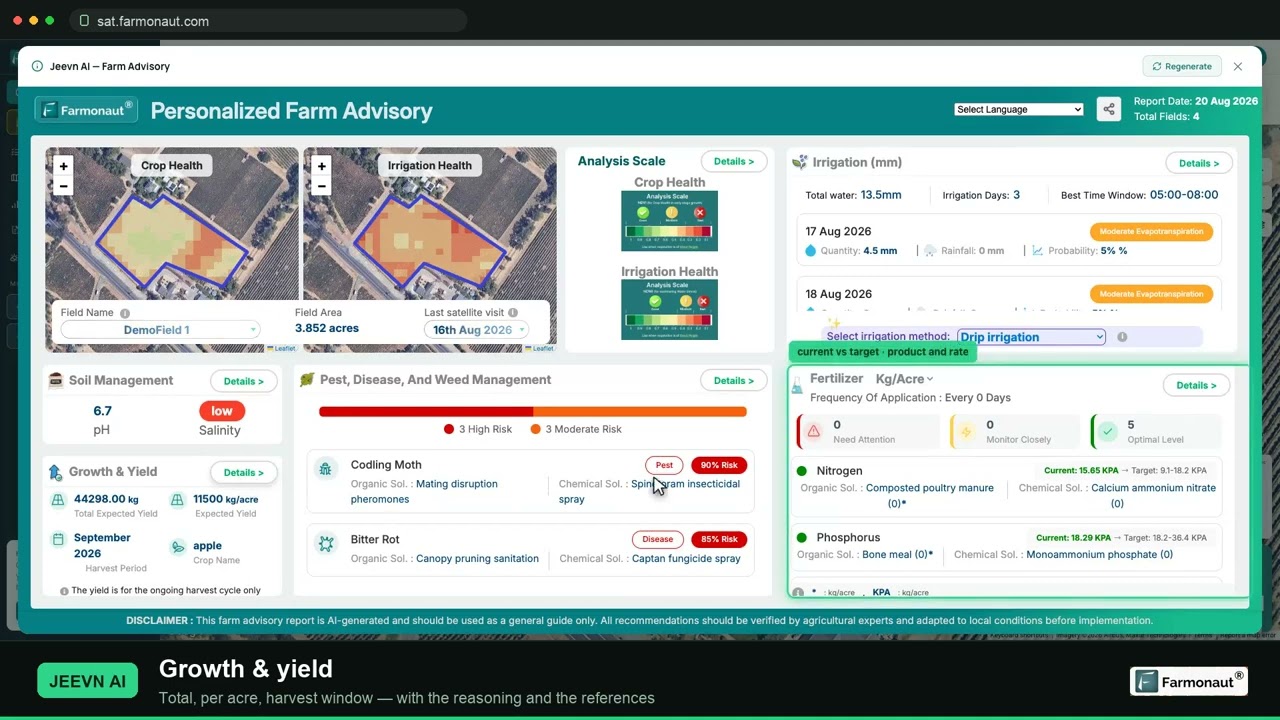
▶ A full walkthrough of satellite crop monitoring: reading NDVI and pulling a report for one field. · 19:36
Strategy 5: Try intercropping where it fits
Intercropping means growing two or more crops in the same field at the same time. It can suit diversified and vegetable operations and some forage and grain mixes, but harvest is harder on large row-crop farms.
- Nutrient use: pairing deep and shallow roots can capture nutrients across more of the soil profile.
- Pest pressure: some plant mixes can interrupt pest life cycles, though results vary by crop and site.
- Risk: crops that mature at different times spread weather and market risk within one field.
- Soil: mixed root systems can help soil structure over time.
Yield is an obvious concern. A global analysis in npj Sustainable Agriculture (2025) drew on 4,195 yield-ratio values from 334 studies across 60 countries. It found a mean partial land equivalent ratio of 0.79. In plain terms, each crop in the mix gave up less yield than its cut in planting density would suggest. The authors also say results depend strongly on the context, with planting density and crop traits among the factors they examined.
Harvest is the practical limit. Before you try a mix, check that you can separate and sell the grain, and start with a small area.
Strategy 6: Plan for weather and price risk
Build weather and price swings into the plan up front rather than reacting after the loss. Drought-year results are one argument for a diverse rotation, though Strategy 1 shows they vary by site, so you need other layers too.
- Varieties: choose them from regional performance trials for your local stress, such as drought, flooding or salinity.
- Planting windows: set an ideal date, a latest date and a switch date for each field.
- Water: mulch, drip irrigation and stored water help in dry seasons where they are practical and allowed.
- Insurance: check what your policy pays, and when, before you plant.
- Marketing: decide how much crop to price at each stage, using your break-even price as the guide.
Late planting is a typical switch decision. As an example of what research offers, Iowa State University found in 2019 that soybean growers in northern Iowa had no need to change maturity group if they could plant before June 1. Look for the same kind of guidance from your own extension service, and write the answer into the plan before spring.
Insurance is close to standard on US field crops. USDA ERS says roughly 89% of the acreage of eight major field crops was enrolled in the Federal Crop Insurance Program in 2024. Policies can pay on your own loss or on an area result, and they can protect yield or revenue. The Risk Management Agency also sets rules on prevented planting, so ask your agent how they apply to your crop and county. Outside the US, check your national or provincial scheme. Satellite records of a field can help document what happened during the season, but your insurer’s rules decide what counts as evidence. Get advice from a licensed agent before you choose cover.
Strategy 7: Protect the land the plan depends on
Long-term yield depends on soil, water and on-farm habitat. Practices that protect them belong in the plan because they cost money, take time and affect field layout.
- Lower input use: IPM, organic amendments and better placement can reduce fertilizer and pesticide use per acre.
- Water care: measure use per unit of yield, not just total use.
- Habitat: buffer strips, shelterbelts and uncultivated margins support on-farm wildlife and protect waterways.
- Agroforestry: trees and shrubs can act as windbreaks and add income, though they need long-term planning.
- Buyer records: some buyers ask for proof of practices or carbon data, so keep records from the start if you sell to them.
Soil work also overlaps with the tillage decision. From 2012 to 2022, US census data show no-till rose from 35% to 38% of reported acres, and reduced tillage rose from 28% to 35% (USDA ERS). Conservation programmes may share some of these costs. Check the current rules with your local office, because they change.
▶ A plain-English explainer of seven simple ways to protect soil and water. · 4:34
Crop budget calculator: compare two crops
A plan needs a number at the end. University of Illinois economists show why. Their first 2027 budgets, published in September 2026, assume US$5 per bushel for corn and US$12 for soybeans. Those are futures-based price projections, not guaranteed prices. On that basis, and with a projected ARC/PLC farm programme payment included, projected net returns after all costs, including cash rent, are US$28 to US$36 per acre for corn in northern and central Illinois and -US$61 in southern Illinois. Soybeans are projected at US$68 to US$86 and US$18 for the same regions.
The same budgets put break-even prices near US$5 per bushel for corn and US$11.10 to US$11.28 for soybeans in northern and central Illinois. The authors add that a US$0.50 move in corn prices shifts returns by more than US$100 per acre. That is why a plan must test price as well as yield. Enter your own numbers below. The labels show US dollars and bushels. If you use another currency or unit, keep it the same in every box.
Try the numbers for your own farm below.
Calculator
Which crop leaves more on your land?
Enter your own area, yields, prices and total costs for two crops.
- Crop A net return per unit area: $10
- Crop B net return per unit area: $10
- Crop A break-even price: 4.94 US$/bu
- Crop B break-even price: 11.33 US$/bu
Example values only, set near break-even; not a benchmark or a forecast. Prices are examples, use today’s price. Total cost should include seed, inputs, machinery, insurance, overhead and land. The calculator ignores rotation effects on the next crop, so also judge the sequence over several years. Get professional advice before major financial decisions.
Comparing the seven strategies
Use this table to decide where to start. The effort column is our own judgement, not a measured result, so adjust it to your farm.
| Strategy | What the evidence shows | Source | Effort |
|---|---|---|---|
| Rotation | Corn yield 28.1% higher on average in more diverse rotations | One Earth, 2020 | Medium |
| Soil fertility | Cover crops on 8.4% of corn acres and 11.1% of soybean acres | USDA ERS, 2021 and 2023 surveys | Medium |
| IPM | Four steps, with action thresholds before any control | US EPA | Medium |
| Precision tools | Autosteering on 70% of large-scale crop farms | USDA ERS, 2023 | Medium to high |
| Intercropping | Mean partial land equivalent ratio of 0.79 | npj Sustainable Agriculture, 2025 | Medium to high |
| Risk planning | About 89% of eight major field crops’ acres insured | USDA ERS, 2024 | Low to medium |
| Land protection | No-till on 38% of reported acres | USDA ERS, 2022 census | Varies |
Crop planning and management tools
You can do this work with a sheet, a spreadsheet or dedicated software. The choice depends on how many fields you run and who needs the data.
| Tool | Good for | Limit |
|---|---|---|
| Paper field sheet | A few fields and one decision-maker | Hard to search or share |
| Spreadsheet | Budgets, rotation grids, simple records | No maps; errors spread easily |
| Farm software | Many fields, staff, audit records | Setup time and subscription cost |
| Satellite monitoring | Finding where to scout across large areas | Cloud gaps; shows change, not cause |
When you compare software, ask five questions. Can it export your data? Does it work offline in the field? Can staff log records from a phone? Does it connect with your machinery files? What does it cost at your farm size? Farmonaut Satellite + AI Farm Monitoring System covers the satellite monitoring row.
Related pages on our site: AI trends in agriculture, large-scale farm administration, crop loans and insurance, carbon footprinting, product traceability, fleet management, satellite data API, API developer documentation and web app sign-in.
Chart
US average corn yield
Bushels per acre, all production, national averages
A season calendar you can copy
Dates shift by region and hemisphere, so treat this as an order of work rather than a fixed calendar.
| When | Main job | Output |
|---|---|---|
| After harvest | Review yields, costs and problems by field | Updated field history |
| Early winter | Soil test results, rotation grid, first crop mix | Draft cropping plan |
| Late winter | Budgets, input buying, insurance choices | Break-even price per crop |
| Before planting | Machinery checks, planting windows, switch dates | Season calendar |
| In season | Scouting, feeding, crop-health checks, marketing | Dated field log |
| Pre-harvest | Harvest order, storage, sales delivery | Harvest schedule |
Common mistakes in a crop plan
- Using best-year yields. A budget built on your top year hides losses. Use field averages.
- Leaving out land and machinery. A crop can look profitable on direct costs and still lose money once rent and depreciation are in.
- Judging a rotation one year at a time. The yield effect often appears in the following crop.
- Planning without a fallback. Decide your switch dates while you can still think calmly.
- Keeping no records. Without them, next year’s plan starts from memory.
FAQ
What is crop planning and management?
It is the process of deciding which crops to plant, when to plant and harvest them, how to sequence rotations and how to manage inputs and risk. The planning comes before the season; the management runs through it.
What is a cropping plan?
It is the written or digital version of those decisions, usually one line per field. It lists the crop, variety, yield goal, budget, key dates and fallback for each field.
How much can crop rotation add to yield?
In 11 North American experiments, corn in more diverse rotations yielded 28.1% more on average than in simplified rotations (One Earth, 2020). Your result depends on crops, soil and weather, so test it on your own fields.
How common is precision agriculture on US farms?
USDA ERS reports that 70% of large-scale crop farms and 52% of midsize farms used autosteering in 2023. It also reports that 68% of large-scale crop farms used yield monitors, yield maps or soil maps.
What return can I expect from farm management software?
No independent national figure is published. Returns depend on farm size, the number of fields and how consistently records are kept, so a one-season trial is the best test.
Where can I find current yield data for my plan?
In the US, the record 2025 national averages were 186.5 bushels per acre for corn and 53 for soybeans (farmdoc daily, May 2026). NASS Charts and Maps and NASS QuickStats have national and state detail. Use your own field records first, then these as a check.
Building a plan that holds up across seasons
Start small and keep it written down. Map your fields, test the soil, draw a rotation grid and work out one break-even price per crop. Those four jobs give you a base to work from before you buy any new tool. Then add scouting dates, switch dates and insurance deadlines.
Review the plan after each harvest against what actually happened. USDA and university budgets change every year, so check current figures against the season you are planning for, using the sources on this page, before you lock in a rotation or input plan.
Farmonaut crop monitoring
See your own fields from space
Draw your fields once and Farmonaut shows satellite crop-health maps for them through the season, on web, Android or iOS.



Keep reading


Sources
- Bowles et al., Long-term evidence shows that crop-rotation diversification increases agricultural resilience, One Earth (2020): lter.kbs.msu.edu
- USDA ARS, Diverse Crop Rotations Reduce Risk of Crop Loss Under Poor Growing Conditions (2024): ars.usda.gov
- Iowa State University Extension, PM 1688, nutrient and limestone recommendations (2013): agronext.iastate.edu
- SARE, Crop Rotation on Organic Farms: A Planning Manual: sare.org
- SARE, Cover Crops for Sustainable Crop Rotations: sare.org
- USDA ERS, ERR-353, soil health practice adoption report: ers.usda.gov
- AHDB, Nutrient Management Guide (RB209): ahdb.org.uk
- US EPA, Integrated Pest Management (IPM) Principles: epa.gov
- USDA ERS, Charts of Note: precision agriculture adoption (2024): ers.usda.gov
- Ecological drivers of intercropping performance for enhanced global crop production, npj Sustainable Agriculture (2025): nature.com
- Iowa State University, Late Soybean Planting Options (2019): crops.extension.iastate.edu
- USDA ERS, Risk Management: Crop Insurance at a Glance: ers.usda.gov
- USDA RMA, Prevented Planting: rma.usda.gov
- farmdoc daily, Illinois Crop Budgets for 2027 (September 2026): farmdocdaily.illinois.edu
- farmdoc daily, 2025 NASS County Corn, Soybean and Winter Wheat Yields (May 2026): farmdocdaily.illinois.edu
- USDA NASS, Crop Production 2024 Summary (January 2025): release.nass.usda.gov
- USDA NASS, Charts and Maps: Field Crops: nass.usda.gov
- USDA NASS, QuickStats: quickstats.nass.usda.gov
Discussion
Questions, corrections or field experience? Share them below. First-time comments are reviewed before they appear, and your email is never published.
No comments yet. Be the first to add a question or your experience.

 AgriBazaar
 Geno
 Hayleys Agriculture
 Linx Agritech
 Adinet
 Save Your Soils
 Grandstream Algérie
 XOS Realty
 Geospatial Lab Africa
 Agro La Gándara
 HIPSAC
 ZOL Zimbabwe
 Juligerm
 AdBio
 MISE Maroc
 NWNS
 Red August Group
 Farm Inc
 WeMe Global

 Licence holder · Niger · Gold










