Understanding NDWI: Exploring the Range and Values for Effective Water Resource Management
In the ever-evolving landscape of environmental monitoring and resource management, the Normalized Difference Water Index (NDWI) has emerged as a crucial tool for assessing water resources and vegetation moisture content. At Farmonaut, we recognize the importance of this index in precision agriculture and sustainable water management. In this comprehensive blog post, we’ll delve deep into the world of NDWI, exploring its range, values, and applications in various fields, particularly agriculture.
What is NDWI?
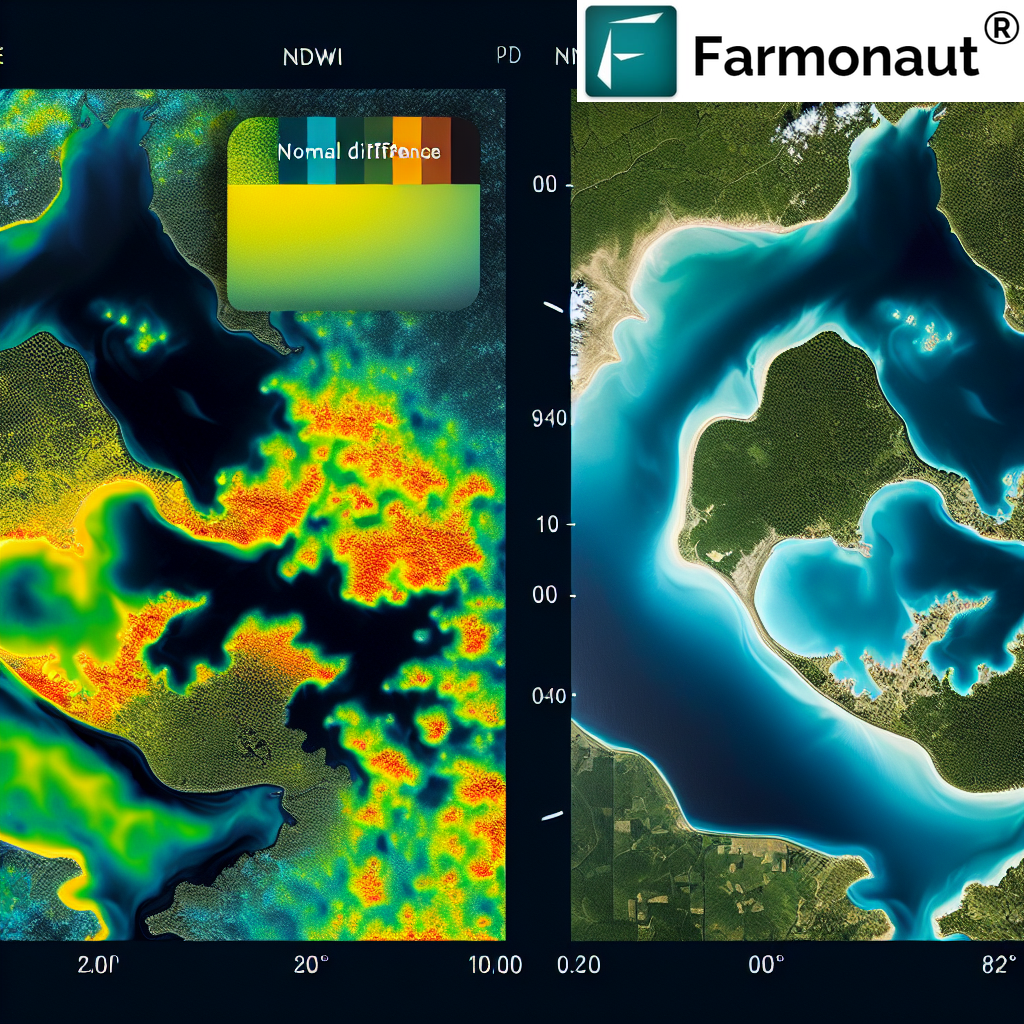
The Normalized Difference Water Index (NDWI) is a remote sensing-derived index that helps in delineating open water features and enhancing their presence in satellite imagery. It’s also used to measure vegetation liquid water content and assess plant and soil moisture conditions. NDWI is calculated using near-infrared (NIR) and short-wave infrared (SWIR) bands from satellite imagery.
The formula for NDWI is:
NDWI = (NIR – SWIR) / (NIR + SWIR)
Where:
- NIR = Near-Infrared band reflectance
- SWIR = Short-Wave Infrared band reflectance
Understanding the NDWI Range and Values
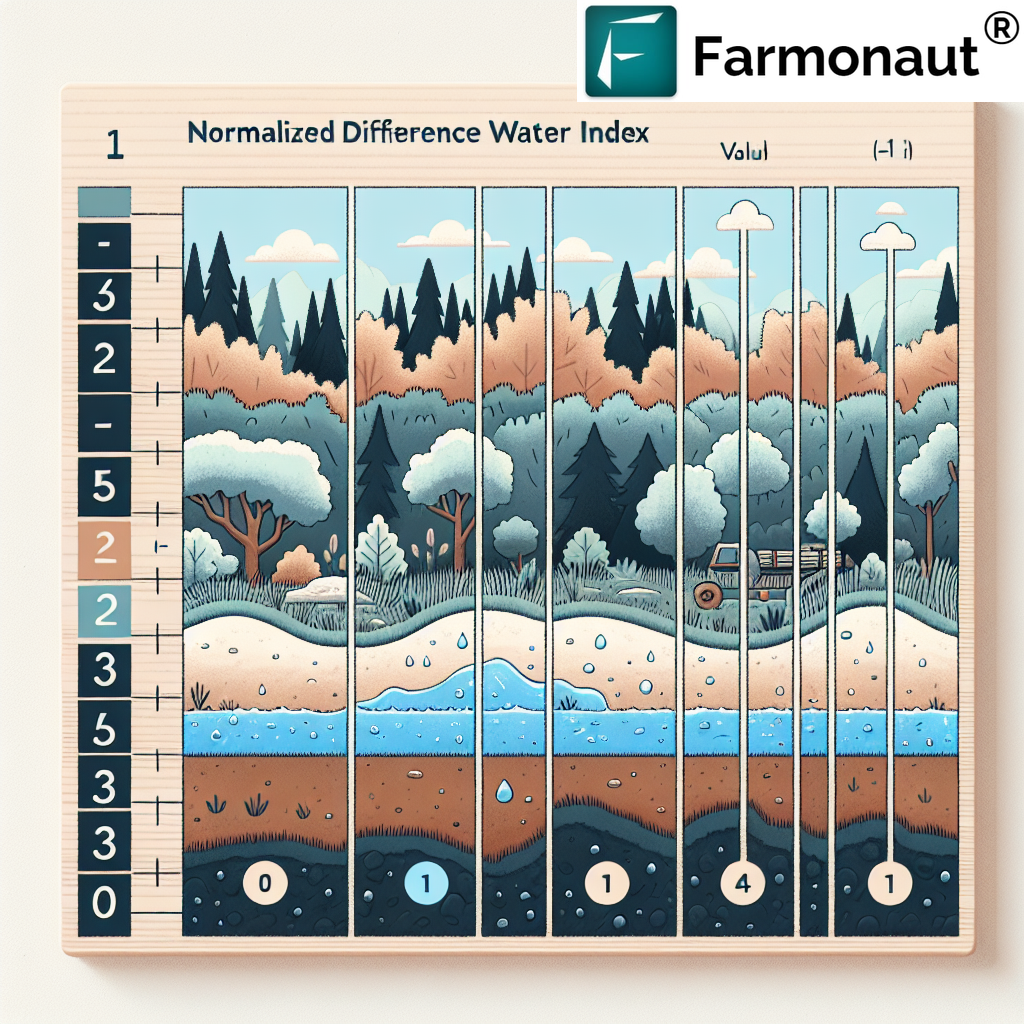
One of the most critical aspects of working with NDWI is understanding its range and what different values signify. The NDWI value range typically spans from -1 to +1. Let’s break down what these values mean:
- NDWI values range from -1 to 0: These values generally indicate non-water surfaces such as vegetation, bare soil, or built-up areas.
- NDWI values range from 0 to +1: These positive values typically represent water bodies or areas with high moisture content.
It’s important to note that the NDWI range can vary slightly depending on the specific algorithm used and the characteristics of the area being studied. However, the general interpretation remains consistent:
- Higher positive values indicate a greater presence of water or moisture
- Values close to zero or slightly negative suggest mixed pixels or transitional areas
- More negative values typically represent dry soil or vegetation with low water content
Interpreting NDWI Values in Different Contexts
The interpretation of NDWI values can vary depending on the specific application and the type of environment being studied. Here’s a more detailed breakdown:
1. Water Body Detection
For water body detection, which is one of the primary applications of NDWI:
- Values > 0.3: Usually indicate clear, open water bodies
- Values between 0 and 0.3: May represent shallow water, wetlands, or areas with high soil moisture
- Values < 0: Typically represent non-water features
2. Vegetation Moisture Content
When assessing vegetation moisture content:
- Higher positive values: Indicate healthier vegetation with higher water content
- Lower positive or negative values: Suggest vegetation under water stress or with lower moisture content
3. Soil Moisture
For soil moisture assessment:
- Higher positive values: Indicate higher soil moisture content
- Lower values: Suggest drier soil conditions
Applications of NDWI in Agriculture and Beyond
At Farmonaut, we leverage NDWI along with other remote sensing indices to provide comprehensive agricultural solutions. Here are some key applications of NDWI:
1. Precision Agriculture
NDWI helps farmers and agronomists in:
- Assessing crop health and water stress
- Optimizing irrigation schedules
- Identifying areas of potential water logging or drought stress
2. Water Resource Management
NDWI is crucial for:
- Monitoring changes in water bodies over time
- Assessing drought conditions
- Planning water conservation strategies
3. Flood Monitoring and Prediction
By analyzing NDWI time series, we can:
- Detect and map flood-affected areas
- Monitor flood progression
- Assess post-flood recovery
4. Ecosystem Studies
NDWI contributes to:
- Wetland mapping and monitoring
- Assessing the health of aquatic ecosystems
- Studying the impact of climate change on water resources
Farmonaut’s Approach to NDWI Analysis
At Farmonaut, we integrate NDWI analysis into our suite of satellite-based farm management solutions. Our approach includes:
- High-Resolution Satellite Imagery: We use multispectral satellite images to calculate NDWI with high accuracy.
- Advanced AI Algorithms: Our Jeevn AI Advisory System incorporates NDWI data to provide personalized farm management advice.
- Time Series Analysis: We track NDWI changes over time to identify trends and anomalies in water resource availability.
- Integration with Other Indices: We combine NDWI with other vegetation indices like NDVI for a comprehensive assessment of crop health and water stress.
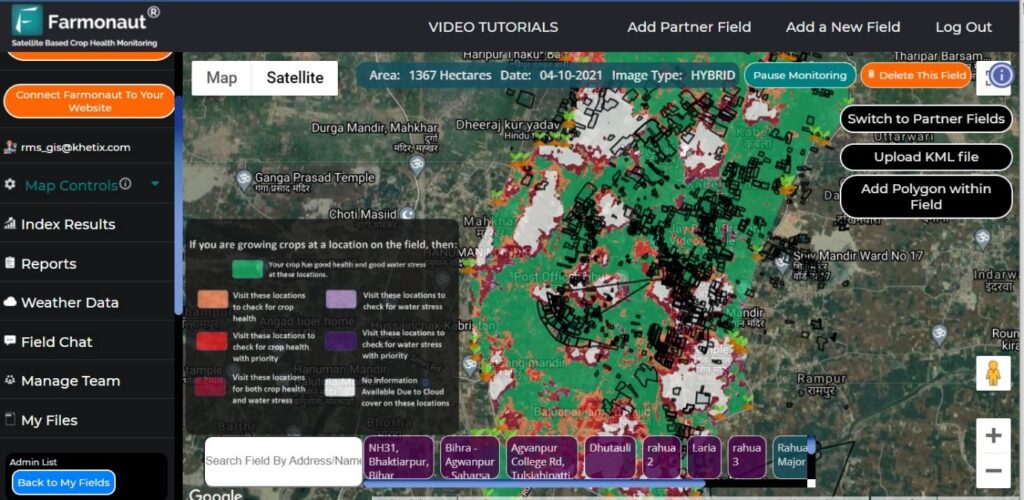
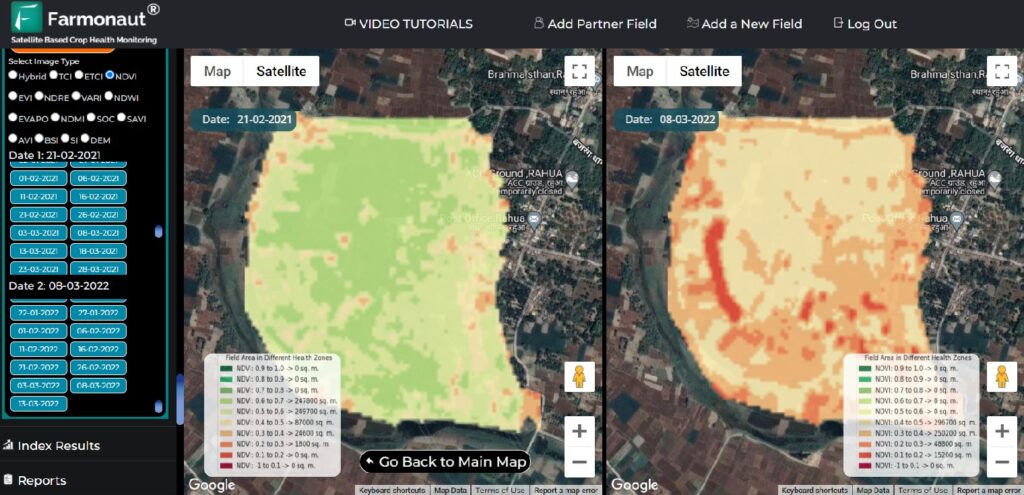
- User-Friendly Visualization: Our platform presents NDWI data in easy-to-understand maps and graphs, making it accessible to farmers and agronomists alike.
To experience how Farmonaut utilizes NDWI and other advanced technologies for precision agriculture, try our app today.
Comparison: Farmonaut Satellite System vs. Drone and IoT-based Farm Monitoring
| Feature | Farmonaut Satellite System | Drone-based Monitoring | IoT-based Monitoring |
|---|---|---|---|
| Coverage Area | Large scale (Thousands of hectares) | Medium scale (Hundreds of hectares) | Small scale (Tens of hectares) |
| Frequency of Data Collection | Daily to weekly | On-demand (weather dependent) | Continuous |
| Initial Setup Cost | Low | High | Medium to High |
| Operational Complexity | Low (Cloud-based) | High (Requires skilled operators) | Medium (Requires maintenance) |
| Data Processing | Automated with AI | Manual or semi-automated | Automated |
| Scalability | Highly scalable | Limited scalability | Moderately scalable |
| Weather Independence | Moderate (Affected by cloud cover) | Low (Highly weather-dependent) | High |
| Integration with Other Data Sources | High (Weather, soil, historical data) | Limited | Moderate |
Challenges in NDWI Interpretation and Analysis
While NDWI is a powerful tool, there are several challenges in its interpretation and analysis that we at Farmonaut have worked to address:
1. Atmospheric Interference
Atmospheric conditions can affect the accuracy of NDWI calculations. We use advanced atmospheric correction algorithms to minimize these effects.
2. Mixed Pixels
In areas with diverse land cover, pixels may contain a mix of water and non-water features, leading to ambiguous NDWI values. Our high-resolution imagery and sophisticated classification algorithms help mitigate this issue.
3. Seasonal Variations
NDWI values can vary significantly with seasons, especially in agricultural areas. We account for these variations through time series analysis and seasonal adjustment techniques.
4. Different Water Types
NDWI may respond differently to various types of water bodies (e.g., clear lakes vs. turbid rivers). Our system is calibrated to account for these differences in different geographical contexts.
Future Trends in NDWI Application
As we continue to innovate at Farmonaut, we’re excited about several emerging trends in NDWI application:
- Integration with Machine Learning: Advanced ML algorithms are being developed to improve NDWI interpretation and prediction capabilities.
- Fusion with Other Data Sources: Combining NDWI with data from ground sensors, weather stations, and other satellite indices for more comprehensive analysis.
- Higher Temporal Resolution: With the increasing number of satellites, we’re moving towards daily NDWI updates for more timely insights.
- Application in Climate Change Studies: NDWI is becoming a crucial tool in assessing the long-term impacts of climate change on water resources and ecosystems.
To stay updated on these advancements and how they can benefit your agricultural operations, consider subscribing to Farmonaut’s services:
Best Practices for Using NDWI in Agriculture
Based on our experience at Farmonaut, we recommend the following best practices for leveraging NDWI in agricultural applications:
- Regular Monitoring: Conduct frequent NDWI assessments to track changes in crop water content and soil moisture over time.
- Combine with Other Indices: Use NDWI in conjunction with indices like NDVI for a more comprehensive understanding of crop health.
- Ground Truthing: Validate satellite-derived NDWI values with on-ground measurements for improved accuracy.
- Consider Local Factors: Take into account local climate, soil types, and crop varieties when interpreting NDWI values.
- Use Time Series Analysis: Look at NDWI trends over time rather than relying on single-date assessments.
- Integrate with Farm Management: Incorporate NDWI insights into broader farm management practices, especially irrigation scheduling and water conservation efforts.
To implement these best practices effectively, consider using Farmonaut’s comprehensive farm management platform. Our mobile apps are available for both Android and iOS devices.
Case Studies: NDWI in Action
While we can’t share specific case studies, we can highlight general scenarios where NDWI has proven particularly valuable:
1. Drought Monitoring in Rainfed Agriculture
In regions relying on rainfall for agriculture, NDWI has been instrumental in early drought detection, allowing farmers to implement timely mitigation strategies.
2. Irrigation Optimization in Arid Regions
Farmers in water-scarce areas have used NDWI to fine-tune their irrigation schedules, resulting in significant water savings without compromising crop yields.
3. Flood Impact Assessment in Lowland Areas
NDWI analysis has helped in rapid assessment of flood-affected agricultural lands, facilitating quicker response and recovery planning.
4. Wetland Conservation Efforts
Conservation agencies have utilized NDWI for monitoring wetland health and extent, crucial for biodiversity preservation and ecosystem management.
Integrating NDWI with Farmonaut’s Other Services
At Farmonaut, we don’t just provide NDWI data in isolation. We integrate it with our suite of services to offer comprehensive agricultural solutions:
- Weather Forecasting: NDWI data is combined with our weather forecasts to provide more accurate predictions of crop water needs.
- Crop Health Monitoring: We use NDWI alongside other vegetation indices to give a holistic view of crop health.
- Yield Prediction: NDWI contributes to our AI-driven yield prediction models, helping farmers make informed decisions about harvesting and market planning.
- Pest and Disease Management: Water stress detected through NDWI can be an indicator of potential pest or disease issues, triggering alerts in our management system.
For developers interested in integrating these capabilities into their own applications, we offer robust APIs. Check out our API documentation for more information.
The Role of NDWI in Sustainable Agriculture
As we face global challenges like climate change and water scarcity, the role of NDWI in promoting sustainable agriculture becomes increasingly crucial:
- Water Conservation: By providing accurate insights into crop water needs, NDWI helps in implementing precision irrigation, reducing water waste.
- Climate Resilience: NDWI data aids in developing climate-resilient farming strategies by monitoring and responding to changing water availability patterns.
- Biodiversity Protection: In agricultural landscapes, maintaining proper water balance is crucial for local ecosystems. NDWI helps in managing this balance effectively.
- Resource Efficiency: By optimizing water use, NDWI contributes to overall resource efficiency in agriculture, reducing the environmental footprint of farming operations.
Future Developments in NDWI Technology
At Farmonaut, we’re constantly looking ahead to future developments in NDWI and related technologies:
- Hyperspectral NDWI: We’re exploring the use of hyperspectral imagery for more nuanced NDWI calculations, potentially offering insights into water quality in addition to quantity.
- AI-Driven Predictive NDWI: Developing models that can predict future NDWI values based on current trends and forecasted weather conditions.
- Integration with IoT: Combining satellite-derived NDWI with data from IoT sensors for even more precise water management.
- 3D NDWI Modeling: Incorporating topographical data to create 3D NDWI models, especially useful in areas with varied terrain.
FAQ Section
Q1: What is the typical NDWI range for healthy vegetation?
A1: Healthy vegetation typically shows NDWI values in the positive range, often between 0.2 to 0.4. However, this can vary depending on the plant species and environmental conditions.
Q2: How often should NDWI be measured for effective farm management?
A2: For most agricultural applications, weekly NDWI measurements are sufficient. However, during critical growth stages or in areas prone to rapid changes in water availability, more frequent measurements (e.g., every 3-5 days) may be beneficial.
Q3: Can NDWI be used to detect irrigation system leaks?
A3: Yes, NDWI can potentially detect irrigation leaks by identifying unusually high moisture levels in specific areas of a field. However, this requires high-resolution imagery and should be combined with on-ground verification.
Q4: How does cloud cover affect NDWI calculations?
A4: Cloud cover can significantly impact NDWI calculations as it obstructs the satellite’s view of the Earth’s surface. At Farmonaut, we use advanced cloud masking techniques and multiple satellite passes to minimize this issue.
Q5: Is NDWI effective for all crop types?
A5: While NDWI is generally effective for most crop types, its interpretation may vary. Some crops with unique canopy structures or water retention properties may require calibrated NDWI thresholds for accurate analysis.
Conclusion
The Normalized Difference Water Index (NDWI) has emerged as a powerful tool in modern agriculture and environmental management. Understanding the NDWI range and interpreting the NDWI values range correctly is crucial for leveraging this index effectively. At Farmonaut, we’re committed to harnessing the power of NDWI and other advanced technologies to drive sustainable and efficient agricultural practices.
By providing farmers, agronomists, and policymakers with accurate, timely, and actionable insights derived from NDWI and other remote sensing indices, we’re contributing to a more resilient and productive agricultural sector. As we continue to innovate and refine our technologies, we invite you to join us in this journey towards smarter, more sustainable farming.
To experience the benefits of our advanced satellite-based farm management solutions, including NDWI analysis, sign up for Farmonaut today. For developers looking to integrate our powerful APIs into their applications, check out our API services.
Together, we can leverage the power of NDWI and other cutting-edge technologies to build a more sustainable and productive future for agriculture.


