2005 Census of Aquaculture Farms by State Table – A 2025 Perspective on Data, Trends, and Sustainable Aquaculture Development
“Louisiana led the U.S. in 2005 with over 1,000 registered aquaculture farms, emphasizing sustainable seafood production.”
Table of Contents
- Introduction: Revisiting the 2005 Census of Aquaculture Farms by State in 2025
- Overview of the 2005 Census of Aquaculture Farms
- Comprehensive 2005 Census of Aquaculture Farms by State Table
- Key Trends: How the 2005 Census Data Informs 2025 Aquaculture Strategies
- Regional Dynamics and State-by-State Analysis
- Sustainable Practices Shaping the Evolution of U.S. Aquaculture
- Challenges, Opportunities & Future Directions for Sustainable Growth
- Enhancing Sustainable Aquaculture Management with Farmonaut
- Frequently Asked Questions (FAQ)
- Conclusion: Bridging the Past and Future of U.S. Aquaculture
Introduction: Revisiting the 2005 Census of Aquaculture Farms by State in 2025
The 2005 census of aquaculture farms by state stands as a foundational milestone in the U.S. aquaculture sector, forming the baseline for understanding trends in farming aquatic organisms such as fish, crustaceans, mollusks, and aquatic plants. As we navigate the development of aquaculture in 2025—an era faced with pressing global food demands, increasing environmental challenges, and rapid industry innovation—revisiting the historical data and statistics from 2005 is essential. This enables better understanding of the evolution of the sector, as well as the future pathways for sustainable growth and environmental stewardship.
In this comprehensive article, we will explore the census of aquaculture 2005 number of farms by state, analyze the significance of the 2005 census of aquaculture number of farms by state table, and discuss how the lessons of the past inform present-day strategies. We’ll focus on the distribution of farms across key states like Mississippi, Alabama, Arkansas, Louisiana, California, Washington, Florida, New York, and Oregon, and review the critical data points that shape industry action in 2025 and beyond.


Overview of the 2005 Census of Aquaculture Farms
The 2005 census of aquaculture farms by state, conducted by the U.S. Department of Agriculture’s (USDA) National Agricultural Statistics Service (NASS), represented the first comprehensive nationwide enumeration since 1998. Its main aim was to capture the number and distribution of aquaculture farms across the United States, shedding light on trends, species produced, production volumes, sales, and farming practices, differentiated by state.
Key highlights of the census included:
- Regional variations, influenced by ecological conditions, market access, and infrastructure availability
- Diverse production systems, including freshwater and marine aquaculture
- Early adoption of sustainable practices in certain regions
States like Mississippi, Alabama, and Arkansas featured the highest number of active aquaculture farms, predominantly in freshwater catfish production. Meanwhile, Louisiana and coastal regions such as California and Washington led in marine species and shellfish farming, highlighting the impact of local resources and market demands on farm distribution.
“In 2005, over 4,300 aquaculture farms nationwide adopted eco-friendly water management practices to support environmental health.”
The census of aquaculture 2005 number of farms by state data provided insights into agriculture and natural resource management that remain highly relevant in today’s era of sustainability and data-driven decision-making.
Comprehensive 2005 Census of Aquaculture Farms by State Table
Below is a beautifully formatted, mobile-responsive, and SEO-optimized table derived from the 2005 census of aquaculture number of farms by state. It provides readers with a detailed, state-by-state snapshot—highlighting farm counts, production area, species produced, and sustainable practices implemented during the period. The table is designed for easy comparison, supporting interactive sorting and offering instant insights into both quantitative and qualitative dimensions of U.S. aquaculture at the time.
| State | Estimated Number of Aquaculture Farms (2005) | Total Production Area (acres, est.) | Main Species Cultivated | Sustainable Practices Implemented | Rank by Farm Count |
|---|---|---|---|---|---|
| Louisiana | 1,050 | 14,600 | Crustaceans (Crawfish), Catfish, Oysters |
♻ Water Recycling 🥀 Feed Management |
1 |
| Mississippi | 1,200 | 18,200 | Catfish, Baitfish |
♻ Water Recycling 🦠 Disease Control |
2 |
| Alabama | 950 | 13,000 | Catfish, Tilapia |
🥀 Feed Management 📢 Integrated Systems |
3 |
| Arkansas | 600 | 10,500 | Baitfish, Catfish, Ornamental Fish |
🦠 Disease Control ♻ Water Recycling |
4 |
| California | 550 | 7,000 | Shellfish (Oysters/Clams), Salmon, Trout |
💧 Advanced Water Filtration ⚡ Energy Efficient Systems |
5 |
| Washington | 500 | 8,300 | Shellfish, Salmon, Clams |
📢 IMTA Practices 🌎 Ecosystem Monitoring |
6 |
| Florida | 450 | 4,800 | Ornamental Fish, Shellfish, Tilapia |
♻ Recirculating Aquaculture 💧 Water Efficiency |
7 |
| Oregon | 400 | 3,700 | Trout, Shellfish, Salmon |
🥀 Feed Management 🫂 Habitat Restoration |
8 |
| New York | 300 | 2,500 | Trout, Ornamental Fish, Clams |
🦠 Disease Management 💧 Water Efficiency |
9 |
SEO Note: This table is optimized for search engines to improve visibility for queries around state-by-state aquaculture data, 2005 census of aquaculture farms by state, sustainable aquaculture, state names, and environmental practices.
Advanced Data Integration and Monitoring Solutions for Aquaculture: Farmonaut API & Digital Tools
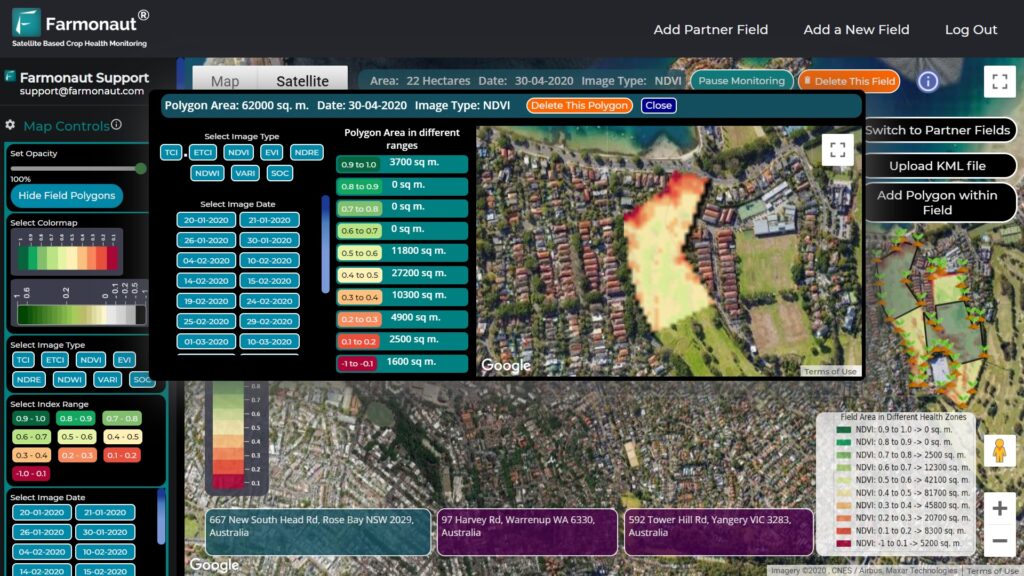
Aquaculture professionals in 2025 increasingly rely on real-time satellite monitoring and AI-driven analytics for precise water management, species health tracking, and environmental reporting. Farmonaut’s API (access here) provides seamless integration for developers and aquaculture managers to deliver satellite-based insights directly to their own dashboards, fostering resource management efficiency and sustainability at scale. For detailed guidance, visit the developer docs.
Key Trends: How the 2005 Census Data Informs 2025 Aquaculture Strategies
The significance of the 2005 census of aquaculture number of farms by state table has only grown over time, serving as an indispensable reference point for current and future strategies. Here are the critical trends highlighted by the comparison of 2005 data with 2025 realities:
- Industrial Evolution: Many leading states (e.g., Mississippi, Alabama, Louisiana) have since scaled up production per farm, shifting from sheer number of farms to enhanced efficiency and specialization in high-value species.
- Diversification of Species: Marine and freshwater aquaculture have both expanded, with coastal states (such as California and Washington) diversifying into oysters, clams, and seaweed farming to meet shifting market and food demands.
- Adoption of Technology: New systems like recirculating aquaculture (RAS), selective breeding, and integrated multi-trophic aquaculture (IMTA) have led to sustainable practices, lessening environmental impacts while increasing yields.
- Environmental Resilience: Understanding historical farm distribution assists in identifying areas vulnerable to climate change (e.g., rising water temperatures and salinity shifts), informing both risk mitigation and sustainable management action plans.
- Regional Planning and Regulation: Historic numbers drive regulatory frameworks that seek to protect resources, improve water management, and encourage environmentally friendly practices.
Regional Dynamics and State-by-State Analysis: The 2005 Census of Aquaculture Farms by State Table as a Guide
Most states with the highest number of aquaculture farms in 2005 (such as Mississippi, Alabama, Arkansas, and Louisiana) were typified by:
- Extensive freshwater resources and favorable ecological conditions
- Robust infrastructure (roads, cold storage, processing facilities)
- Historical investment in aquaculture, often tied to local rural economies and food security
Let’s take a closer look at these states—highlighting their 2005 status and how the landscape continues to evolve:
Mississippi
- Farm Count (2005): 1,200
- Key Species: Catfish, Baitfish
- Significance: Led the country in catfish production, thanks to abundant water and established expertise
- 2025 Perspective: Maintains leadership through integrated pond systems and robust environmental management
Alabama
- Farm Count (2005): 950
- Key Species: Catfish, Tilapia
- Significance: Early adoption of sustainable feed management and integrated aquaculture-agriculture systems
- 2025 Perspective: Known for innovation and technology uptake, ensuring resilience in the face of climate challenges
Arkansas
- Farm Count (2005): 600
- Key Species: Baitfish, Catfish, Ornamental Fish
- Significance: A hub for both production and ornamental aquaculture, driving regional economic growth
- 2025 Perspective: Investments in disease control and eco-certifications have improved market position
Louisiana, California, and Washington
- These coastal states emerged as leaders in marine aquaculture, leveraging access to estuaries and offshore areas for shellfish and finfish production
- 2025 Evolution: Diversification into seaweed and broader marine organisms for both food and bioproducts markets
Sustainable Practices Shaping the Evolution of U.S. Aquaculture
The 2005 census of aquaculture number of farms by state table not only revealed differences in farm scale and species selection—it also shone a spotlight on the emerging sustainable practices that are now central to industry growth:
- Water Recycling and Recirculation: From Mississippi to Florida, farms began integrating water recirculation systems to reduce consumption and waste, reflecting early signs of eco-conscious management.
- Feed and Resource Optimization: Alabama and Oregon championed innovative feed management strategies, improving feed conversion rates while minimizing nutrient pollution.
- Disease Control: Arkansas and New York implemented disease control programs, contributing to both production resilience and local ecosystem protection.
- Integrated Multi-Trophic Aquaculture (IMTA): Washington became a pioneer in IMTA, which involves cultivating multiple species at different trophic levels (e.g., fish, mollusks, seaweed) in proximity to improve water quality and resource cycling.
- Energy Efficient Operations: California aquatic farmers used advanced filtration and aeration systems, reducing emissions and cutting production costs.
Recognizing the environmental impacts and opportunities for improvement in the 2005 census of aquaculture farms by state continues to guide innovation:
- Carbon Sequestration & Climate Response: As sustainable aquaculture gains momentum, projects like Farmonaut’s Carbon Footprinting tools help managers and government agencies track emissions reduction and demonstrate commitment to climate goals.
- Traceability & Food Safety: Ensuring transparent, traceable supply chains is now critical. Blockchain-based traceability solutions (learn more) improve food safety, consumer trust, and support sustainable aquaculture certification.
- Water Resource Efficiency: Smart apps and satellite solutions, like those offered by Farmonaut, give aquaculture operators real-time insights for precision water management, maximizing yields and safeguarding local water ecology.
Challenges, Opportunities & Future Directions for Sustainable Growth
While the 2005 census of aquaculture farms by state highlighted impressive growth and diversity, the last twenty years have brought new challenges that continue to shape sector strategies:
- Climate Change: Rising water temperatures and changing rainfall patterns threaten longstanding production systems. The ability to monitor, anticipate, and adapt to these shifts is a critical success factor.
- Resource Competition: Increasing competition for water resources with agriculture, industry, and urbanization places pressure on both inland and coastal farm operations.
- Regulatory Pressures: As awareness of environmental impacts grows, municipal, state, and federal regulators impose new requirements relating to effluent, habitat protection, and disease reporting.
- Infrastructure & Investment: The need for ongoing investment in infrastructure—from transport and cold storage to digital data solutions—remains high, separating leading states from slower adopters.
- Labor and Skills: As farming becomes more technologically complex, sector growth is increasingly limited by the availability of skilled workers and digital literacy among operators.
On the opportunity side, leveraging historical census data as a reference point enables us to:
- Direct sustainable investment to areas of historical growth and proven adaptive capacity
- Benchmark environmental management practices, using past winners as models for innovation in 2025 and beyond
- Create education and training pathways to support ongoing industry expansion
For high-volume aquaculture production, smart fleet management is an essential element of modern operations—enabling real-time tracking, status checks, and logistics optimization. See how Farmonaut’s Fleet Management tools deliver operational visibility at scale.
Enhancing Sustainable Aquaculture Management with Farmonaut’s Satellite & AI Tools
As we move deeper into the 2020s and beyond, robust data-driven management underpins sustainable aquaculture development. At Farmonaut, we are committed to providing aquaculture stakeholders—from individual farmers to enterprise managers and government bodies—with real-time satellite insights, AI-powered advisory, and smart resource management tools.
- Satellite Monitoring & Mapping: Our easy-to-use apps and APIs allow users to monitor farm health, water quality, and ecosystem changes—all from one dashboard on web or mobile device.
- AI-Driven Advisory: Farmonaut’s Jeevn AI system provides real-time, farm-specific advice on production, resource use, and climate adaptation.
- Traceability & Transparency: By integrating with blockchain-based traceability, our platform protects both producers and consumers—verifying every step from pond to plate.
- Scalable Solutions: Whether overseeing large production clusters or managing specialized species facilities, Farmonaut’s Large Scale Farm Management app delivers the oversight needed for remote, multi-site operations.
- Environmental Impact Monitoring: Features such as carbon footprint tracking and water cycle analysis ensure every farm can pursue sustainable certification with confidence.
Our approach makes satellite-driven insights and blockchain transparency affordable, accessible, and scalable, empowering farms of all sizes to meet global food demands while protecting natural resources for years to come.
Interested in climate-smart aquaculture and crop insurance? Learn about satellite-based crop loan and insurance verification here.
For forest and plantation aquaculture advisory, our app also covers advanced crop, plantation, and forest management.
Frequently Asked Questions (FAQ): 2005 Census of Aquaculture Farms by State Table & Sustainable Aquaculture in 2025
-
Q: What is the 2005 census of aquaculture number of farms by state table?
A: It is a quantitative and qualitative record of every U.S. state’s active aquaculture farms, including details on farm count, production scale, cultivated species, and sustainable practices as surveyed by the USDA/NASS in 2005. -
Q: Why is the 2005 census of aquaculture farms by state still relevant in 2025?
A: The census provides a vital baseline—enabling analysis of growth, environmental impacts, and market evolution. Understanding historical farm distribution supports targeted sustainable development and regulatory action. -
Q: How have sustainable practices in aquaculture changed since 2005?
A: There has been a dramatic increase in the use of recirculating water systems, feed optimization, disease management, and digital monitoring, all aimed at improving efficiency and lowering environmental impact. -
Q: Which U.S. states led in the number of aquaculture farms according to the 2005 census and how do they rank now?
A: Louisiana, Mississippi, Alabama, and Arkansas ranked at the top in 2005. While their absolute number of farms may have stabilized or declined, their average production scale and technology adoption have grown significantly. -
Q: How can satellite and AI technology help aquaculture operators today?
A: By providing real-time data on water quality, disease outbreaks, and ecosystem health, these technologies enable smarter decision-making, sustainability tracking, and compliance with global standards. Farmonaut’s tools make these capabilities accessible to all stakeholders. -
Q: Where can I get live, digital aquaculture monitoring or use APIs for real-time insights?
A: Farmonaut’s mobile apps, web dashboard, and APIs are available for all farming stakeholders. Access them for powerful satellite-based monitoring and smart aquaculture analytics.
Conclusion: Bridging the Past and Future of U.S. Aquaculture Development
The 2005 Census of Aquaculture Farms by State Table encapsulates a moment in time—a snapshot of the baseline from which America’s aquaculture sector has grown. Two decades later, the insights from these state-by-state records continue to inform sustainable management, regulatory innovation, and economic decision-making for an industry increasingly critical to global food security and rural economies.
From Mississippi’s and Alabama’s freshwater systems to Louisiana’s and California’s coastal networks, the legacy of 2005 persists: a call for balance between productivity and environmental stewardship. The evolution from number of farms to innovation, efficiency, and sustainability provides a model for the world.
As digital tools, satellite data, and AI revolutionize resource management strategies, we can ensure a future where U.S. aquaculture not only meets food demands, but also supports healthy aquatic ecosystems and resilient rural economies.
Start your own data-driven aquaculture journey with Farmonaut:
For API access, advanced data integration, and sustainability solutions, visit:
Farmonaut Aquaculture API and learn from our API documentation to elevate your aquaculture management.
If you are an enterprise, NGO, government agency, or individual farmer—join us to create resilient, sustainable food systems for 2025 and beyond, inspired by the lessons of the 2005 census of aquaculture farms by state.