

Reviewed August 2026 against USDA Farm Service Agency, farmdoc daily (University of Illinois), and Purdue Center for Commercial Agriculture.
Try it: Run your own numbers →
An Illinois farmer shopping for an operating loan right now is looking at a fixed rate near 7.1% from Chicago Federal Reserve District lenders (the district that covers Illinois), versus 5.25% on a USDA Farm Service Agency Direct Operating Loan — a spread wide enough to change which lender you call first. Ag real estate loans run about a point lower on both sides: 6.7% commercial fixed versus 6.00% FSA Direct. This article breaks down where those numbers come from, what’s driving loan demand across Central and Southeast Illinois, and how to pick between a bank, a Farm Credit association, and USDA’s programs.
Central Illinois Agriculture: Why Loan Demand Is Rising
Central Illinois sits inside the Federal Reserve Bank of Chicago’s Seventh District, and that district’s own farmer surveys are the best regional read available on Illinois credit conditions. In the first quarter of 2026, the Chicago District’s loan demand index hit 141 — a reading well above 100 means more responding bankers reported rising demand than falling demand — while the repayment problems index reached 63, per farmdoc daily, University of Illinois. Both numbers point the same direction: farmers are borrowing more, and a growing share are finding repayment harder.
The cost side explains why. Total farm production expenses rose 25% from 2016 to 2025, and interest expense alone climbed 53% over the same nine years, according to USDA data cited in farmdoc daily’s analysis of rising loan levels. Higher input costs mean bigger loan requests; higher rates mean each dollar borrowed costs more to carry. That combination — farmdoc calls it “double trouble” — is the single biggest driver behind the demand spike showing up in Central Illinois lending offices.
Nationally, USDA projects total farm debt at $624.7 billion for 2026, with $404.3 billion of that in agricultural real estate debt. The Federal Reserve Bank of Chicago also reported that 5.6% of US farm loans were classified as having “major” or “severe” repayment problems in 2025 — a figure worth watching, since it’s the clearest signal of how much stress is building under the demand growth.

Current Ag Loan Rates: FSA vs. Commercial Lenders
Two rate tracks matter to anyone borrowing against Illinois farmland or a crop budget: the government-backed USDA Farm Service Agency (FSA) Direct loan rates, and the commercial rates reported for the Chicago Federal Reserve District, which includes Illinois.
As of August 2026, USDA’s FSA Direct Farm Operating Loan rate is 5.25%, and the FSA Direct Farm Ownership Loan rate is 6.00%, per the USDA Farm Service Agency’s August 2026 rate announcement. These are Direct loan rates — FSA also guarantees loans made by commercial lenders, which carry the lender’s own rate rather than the Direct rate.
On the commercial side, farmdoc daily’s Q1 2026 survey of the Chicago District put the average fixed operating loan rate at 7.1% and the average fixed real estate loan rate at 6.7%. Purdue’s Center for Commercial Agriculture recorded a close figure for the same district one quarter earlier — 6.80% average farm real estate loan rate in Q3 2025 — from its 2026 Agricultural Credit Outlook. The consistency between the two independent sources (within 0.1 point) is a useful cross-check on the number.
These rates move monthly for FSA (USDA republishes them at the start of each month at its news and events page) and quarterly for the Chicago District commercial survey, published on farmdoc daily. Whatever number you read here will be out of date within weeks — check those two sources directly before you lock in a rate quote from a lender, and use the gap between FSA and commercial rates as your first negotiating data point.
Agriculture Lenders in Central Illinois: Who’s Actually Lending
Three categories of lender operate in Central Illinois, and each shows up differently depending on what you’re financing:
- Farm Credit System associations — cooperative lenders chartered specifically for agriculture, typically the largest single source of farm real estate loans in the Midwest.
- Community and regional banks — often the first call for operating loans because of existing deposit relationships and local underwriting.
- USDA Farm Service Agency — Direct loans funded by USDA itself, plus Guaranteed loans where FSA backs a portion of a loan made by a bank or Farm Credit lender.
USDA does not publish a state-level breakdown of commercial bank versus Farm Credit System loan volume for Illinois, and this is a genuine gap in public data rather than an oversight on our part — if you need that split for a specific analysis, the closest available substitute is asking individual lenders for their Illinois agricultural portfolio size directly, since neither USDA NASS nor FSA reports it by lender type at the county or district level. What FSA does publish is eligibility rules, loan limits, and county office contacts at fsa.usda.gov — the starting point for any FSA Direct or Guaranteed application in Illinois.
Farm-level production and cash receipt data for Illinois — useful for benchmarking your own operation against the county average — is published by USDA NASS Illinois. NASS updates this on a rolling basis; check the page directly for the current release rather than relying on any figure quoted secondhand.

Agriculture Real Estate Loans in Central Illinois
Land purchase, expansion, and refinancing loans in Central Illinois are priced around the 6.7% fixed rate reported by farmdoc daily for the Chicago District in Q1 2026, or 6.00% if you qualify for an FSA Direct Farm Ownership loan. The $404.3 billion national agricultural real estate debt projection for 2026 reflects continued borrowing against land value even as rates sit well above where they were a decade earlier.
Real estate loans carry longer amortization than operating loans — commonly 15 to 30 years — because the collateral (the land itself) holds value over a much longer horizon than a single crop cycle. Underwriting on these loans weighs:
- Farm income history and debt-to-asset ratio
- Appraised land value, which moves with regional cash rent and commodity price trends
- Production track record on the specific parcels being financed
- Documentation of field-level activity — increasingly requested in digital form rather than paper records
Government-backed options remain part of this mix. FSA Direct Farm Ownership loans at 6.00% are typically reserved for borrowers who can’t get reasonable terms elsewhere, including beginning farmers — check current eligibility caps directly with your local FSA office since loan limits are set at the federal level and revised periodically.
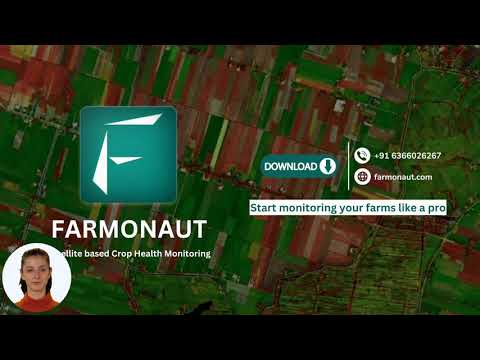
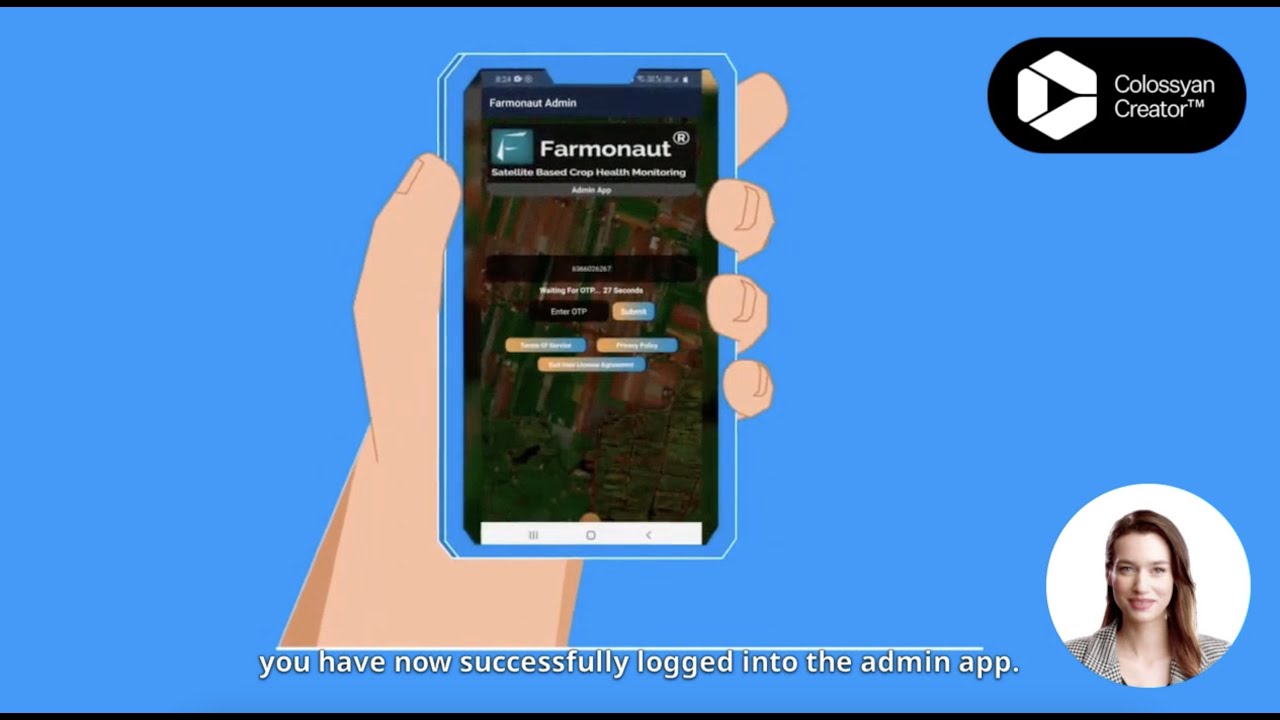
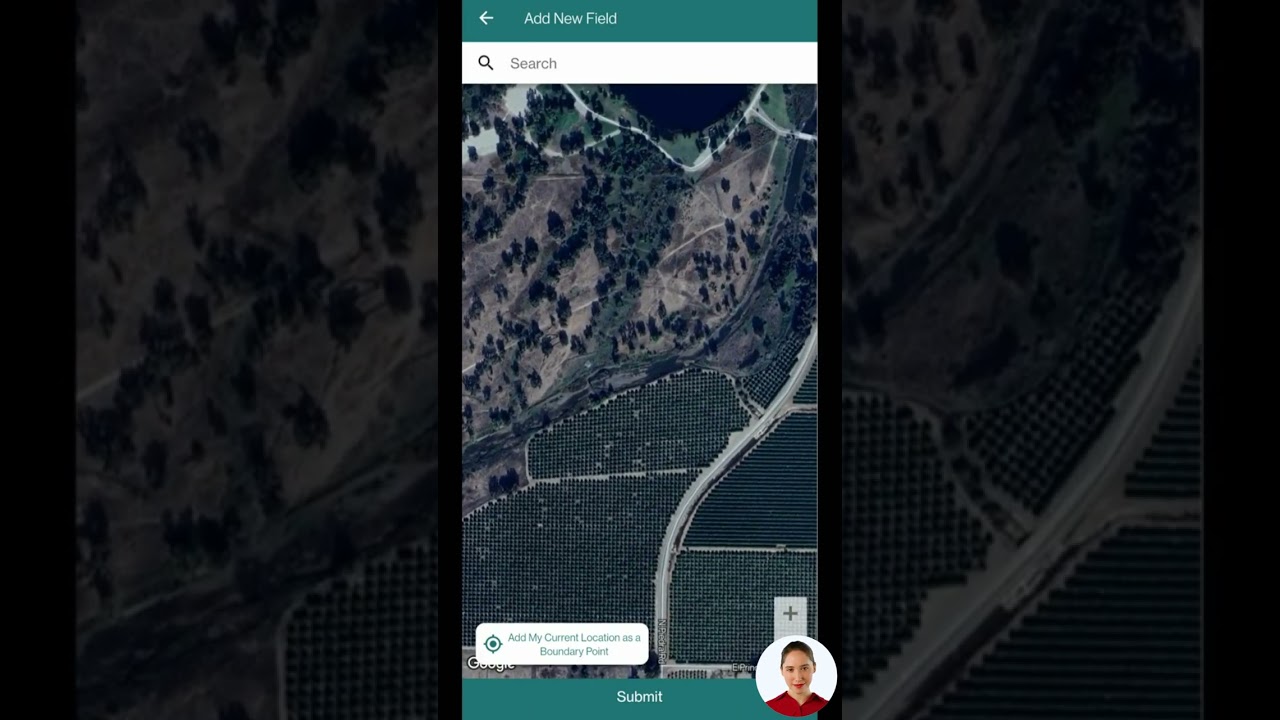
Digital farm records now play into how quickly a real estate loan clears underwriting. Lenders that accept satellite-verified field history alongside traditional appraisals can move faster on due diligence. Farmonaut’s Large Scale Farm Management Platform gives borrowers a satellite-based record of field activity across an entire operation — useful when a lender asks for documentation beyond the appraisal itself.


Operating Loans in Central Illinois
Operating loans cover the annual cash needs of a farm — seed, fertilizer, fuel, labor, repairs — and are structured to repay after harvest or sale rather than on a fixed monthly schedule. In Central Illinois, the commercial fixed rate on these loans averaged 7.1% in Q1 2026 per farmdoc daily; the FSA Direct Operating loan rate is 5.25% as of August 2026.
The gap between those two rates — roughly 1.85 percentage points — is the reason it’s worth checking FSA eligibility before defaulting to a commercial operating loan, particularly for beginning farmers or operations that don’t yet have the credit history a bank wants to see. FSA Guaranteed Operating Loans, where a bank or Farm Credit lender makes the loan and FSA guarantees a portion, sit in between: the borrower gets the commercial lender’s underwriting and rate, but the federal guarantee can open terms that wouldn’t otherwise be available.
USDA does not publish a Central Illinois-specific breakdown of average operating loan size or maturity by loan type — FSA reports aggregate national and state loan volumes, not a regional split for Illinois. If you need a figure specific to your county, your local FSA office or a Farm Credit loan officer can provide portfolio averages for your area directly; that’s a more precise number than any statewide estimate.
Repayment terms structured around actual cash inflows — repay when the crop sells, not on a calendar schedule — remain the norm for operating credit in this region, and that structure is what makes the loan demand index of 141 and repayment problems index of 63 worth tracking together: rising demand with rising repayment stress is a combination that shows up in a lender’s underwriting decisions well before it shows up in a farm’s balance sheet.
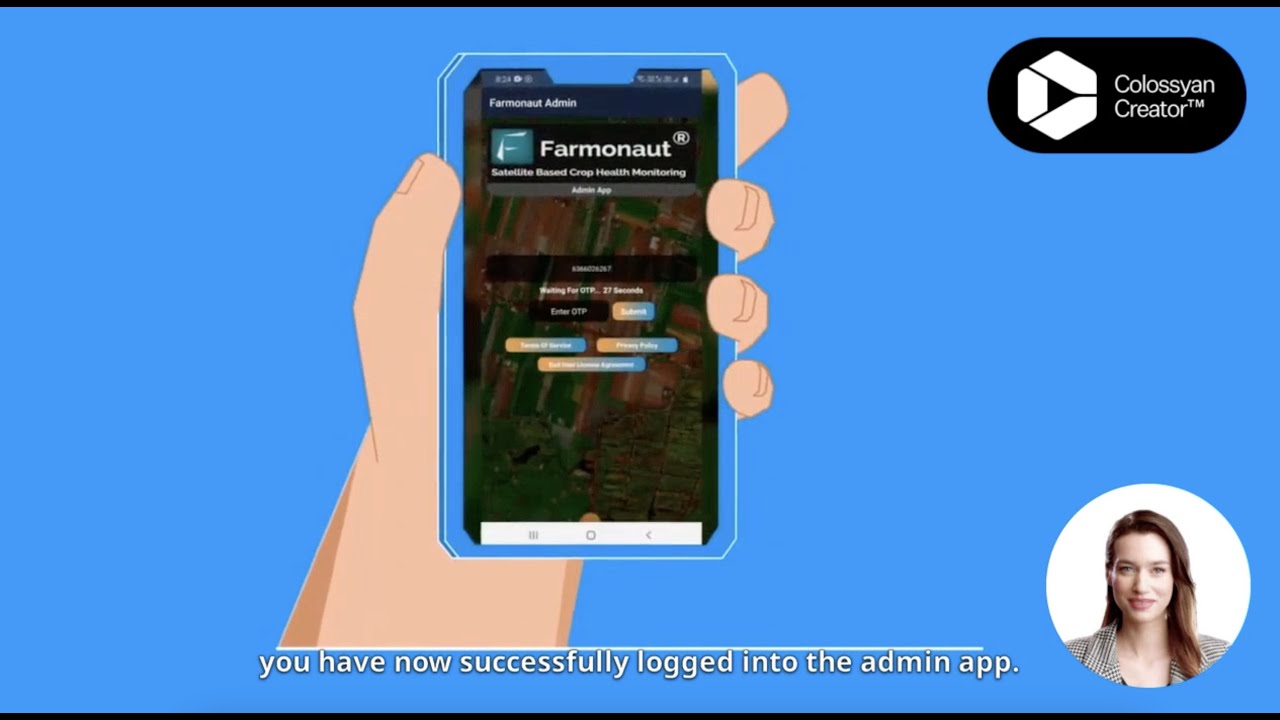
To document input use and equipment costs for an operating loan application, Farmonaut Fleet Management Tools track fuel consumption and equipment utilization with satellite and AI-based analytics — records a lender can review alongside your cash-flow projection.
Farm Loans and Ag Operating Loans in Southeast Illinois
Southeast Illinois farmers work with the same two rate tracks as the rest of the state — FSA Direct programs at 5.25% (operating) and 6.00% (ownership), and Chicago District commercial averages at 7.1% and 6.7% respectively — because both FSA’s rate-setting and the Chicago Federal Reserve District’s survey apply statewide rather than by sub-region. NASS does not publish a Southeast Illinois-specific farm count, average acreage, or lending-volume breakdown separate from county-level production data, so there is no distinct “Southeast Illinois rate” to report; the district-level Chicago Fed figures are the most granular public data available for this area.
What differs by region is the mix of crops and operations behind loan applications, and that’s a conversation to have directly with a local lender or your county FSA office, since it shapes both loan sizing and collateral evaluation more than the headline rate does. For farm loans and ag operating loans in Southeast Illinois specifically, the practical next step is the same as anywhere in the state: compare the FSA Direct rate against your local commercial quote, check whether you qualify for a Guaranteed loan, and get a written rate quote from at least one Farm Credit association and one community bank before committing.
Lenders assessing repayment ability increasingly ask for documentation beyond tax returns and a business plan — field-level records of planting, input application, and yield history. Farmonaut’s Crop Loan and Insurance Solutions generate satellite-based field reports that can support that documentation for operating loan applications in Southeast Illinois or elsewhere in the state.

Choosing the Right Lender: A Checklist That Doesn’t Expire
Rates and demand indexes shift every quarter, but the process for picking a lender doesn’t. Work through these steps regardless of what the current numbers say:
1. Identify the loan purpose first
Land acquisition and refinancing call for a lender experienced in local appraisals and long amortization; day-to-day operating expenses call for a lender comfortable with seasonal, harvest-timed repayment. Don’t apply for a blended product until you know which category dominates your need.
2. Pull the current rate from the primary source, not a secondhand quote
Check USDA FSA’s news page for the current month’s Direct loan rates and farmdoc daily’s quarterly Chicago District survey for the commercial benchmark. A lender’s initial quote should be compared against both before you negotiate.
3. Compare at least three lender types
A Farm Credit association, a community bank, and an FSA Direct or Guaranteed program each underwrite differently. Getting quotes from all three, even if you expect to choose one, tells you where your specific operation is priced competitively.
4. Check the repayment-problems context, not just the rate
A 5.6% national rate of farm loans with major or severe repayment problems in 2025, and a Chicago District repayment problems index of 63 in Q1 2026, both signal that lenders are underwriting more cautiously than the demand numbers alone would suggest. Expect more documentation requests, not fewer.
5. Verify your own numbers before the lender does
Field-level yield history, input records, and land condition data strengthen an application regardless of which lender you choose — and unlike a rate quote, this is documentation you control and can assemble before you ever walk into a loan office.
Comparison Table: Loan Types, Rates, and Terms
| Loan Type | Rate | Source / Period | Typical Term | Best Fit |
|---|---|---|---|---|
| FSA Direct Farm Operating Loan | 5.25% | USDA FSA, August 2026 | 1–7 years | Borrowers who can’t get reasonable commercial terms, incl. beginning farmers |
| FSA Direct Farm Ownership Loan | 6.00% | USDA FSA, August 2026 | Up to 40 years | Land purchase/refinance for eligible borrowers |
| Chicago District Commercial Operating Loan | 7.1% fixed | farmdoc daily, Q1 2026 | 1–3 years | Established operations with existing lender relationships |
| Chicago District Commercial Real Estate Loan | 6.7% fixed | farmdoc daily, Q1 2026 | 15–30 years | Land acquisition, expansion, refinancing |
| Chicago District Real Estate Loan (Purdue survey) | 6.80% average | Purdue Center for Commercial Agriculture, Q3 2025 | 15–30 years | Cross-check against the farmdoc daily figure above |
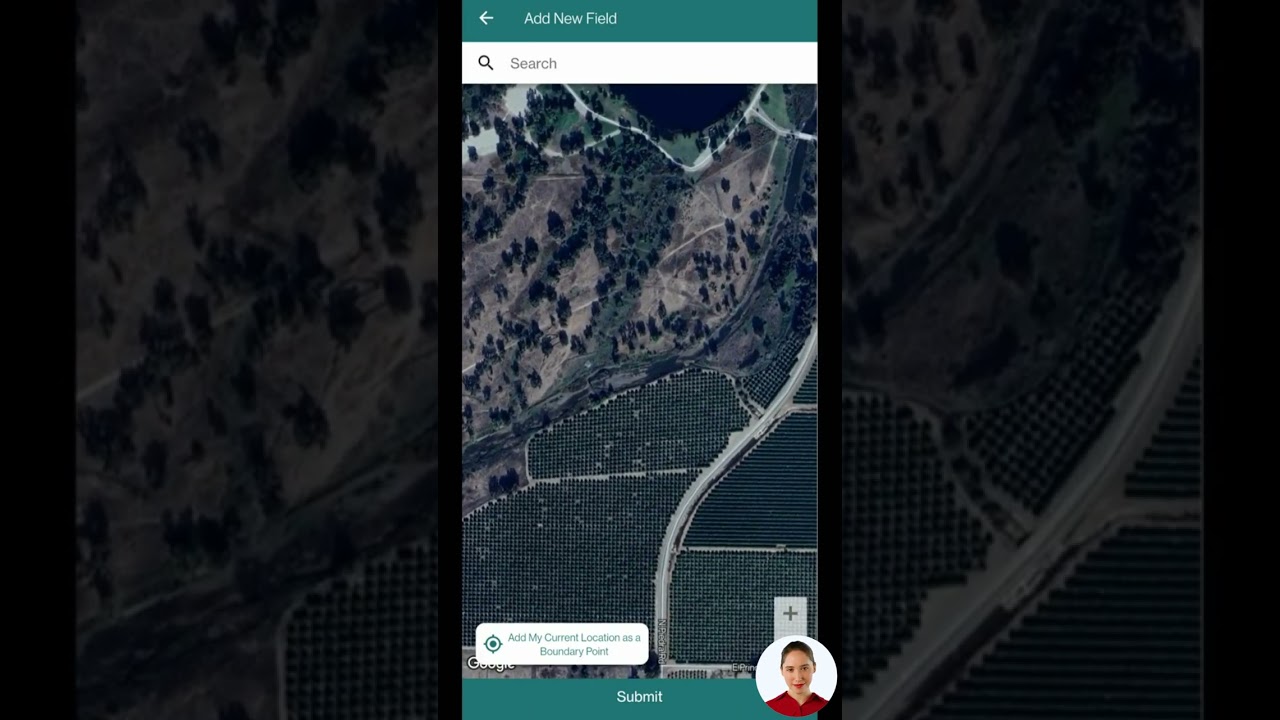
For loan applications requiring digital compliance records, the Farmonaut API Portal and API Developer Docs let you integrate satellite monitoring and weather data directly into your documentation.
Operating Loan Cash-Flow Calculator
Use the current FSA and commercial rates above to compare what an operating loan actually costs you at harvest, based on your own loan amount and expected sale date.
Run your own numbers
Assumes simple interest accrued monthly on the full loan amount for the period entered, with a single repayment at the end of the term. Does not account for partial draws, fees, compounding, or FSA/lender-specific amortization schedules — use it to compare scenarios, not as a binding cost estimate. Confirm actual terms with your lender.
How Satellite Data Strengthens a Loan Application
Lenders underwriting against the repayment stress signaled by a 5.6% major/severe repayment problem rate look for documentation that reduces their own risk assessment burden. Satellite-based field monitoring gives borrowers a way to supply that documentation without waiting on a manual site visit:
- Field-level crop health and input application history, verifiable independent of the borrower’s own records
- Carbon and resource-use tracking, increasingly requested by lenders offering sustainability-linked rate terms
- Supply chain traceability, which some lenders now treat as a trust marker alongside traditional collateral
- Real-time compliance data that can be shared directly through an API rather than assembled manually each renewal cycle
Farmonaut also supports blockchain-based product traceability in agriculture, which some lenders and buyers use as an added verification layer for farm-to-market supply chains.
For farmers in Central Texas or other regions working on water conservation and soil health practices tied to sustainability-linked loan terms, and for Illinois farmers documenting carbon output for the same purpose, Farmonaut Carbon Footprinting Tools track and report emissions data that lenders increasingly ask for during underwriting.
Explore our mobile apps and web platform:



Tools and App Links for Loan Documentation
A digital record built before you apply saves time during underwriting, whatever lender you choose:
-
Farmonaut App (Web & Mobile):
Satellite crop health, field mapping, and yield analytics for loan and insurance recordkeeping. -
Farmonaut Crop Plantation & Forest Advisory:
AI advisory for planting, irrigation, and farm management decisions a lender may want documented. -
Crop Loan and Insurance Dashboards:
Field reports generated for loan and insurance processing, backed by satellite imagery. -
Farmonaut Carbon Footprinting Solutions:
Tracks carbon output and resource use for lenders offering sustainability-linked rate incentives. -
Product Traceability:
Supply chain verification from field to market, useful when contracting with lenders or buyers. -
Fleet & Equipment Management Tools:
Fuel and equipment usage records that support operating loan cash-flow documentation.
For lenders or tech-savvy borrowers building risk models, the Farmonaut APIs and Developer Documentation integrate real-time farm and weather data directly into a lending workflow.
FAQ: Illinois Agriculture Loans
What is the current FSA operating loan rate for Illinois farmers?
The USDA FSA Direct Farm Operating Loan rate was 5.25% as of the August 2026 announcement. FSA republishes rates monthly at fsa.usda.gov/news-events/news — check there for the current figure.
How do commercial ag loan rates in Central Illinois compare to USDA rates?
In Q1 2026, the Chicago Federal Reserve District (which includes Illinois) averaged 7.1% fixed on operating loans and 6.7% fixed on real estate loans, both roughly 1.7 to 1.9 percentage points above the equivalent FSA Direct rates, per farmdoc daily.
Are ag operating loans in Southeast Illinois priced differently from Central Illinois?
No separate rate exists for Southeast Illinois specifically — FSA sets Direct loan rates statewide, and the Chicago Federal Reserve District survey reports at the district level, not by Illinois sub-region. Both apply the same way across Central and Southeast Illinois.
What’s driving higher ag loan demand in Illinois?
Total farm production expenses rose 25% between 2016 and 2025, with interest expense up 53% over the same period, per USDA data reported by farmdoc daily. The Chicago District’s Q1 2026 loan demand index of 141 reflects that cost pressure.
How many Illinois farm loans are behind on repayment?
The Federal Reserve Bank of Chicago classified 5.6% of US farm loans as having “major” or “severe” repayment problems in 2025, and the Chicago District’s repayment problems index stood at 63 in Q1 2026.
Should I apply for an FSA Direct loan or a commercial ag loan?
FSA Direct loans (5.25% operating, 6.00% ownership as of August 2026) generally suit borrowers who can’t secure reasonable commercial terms, including beginning farmers. FSA Guaranteed loans combine a commercial lender’s underwriting with a federal guarantee. Compare a written quote from a Farm Credit association or bank against the current FSA rate before deciding.
Where can I find county-level Illinois farm production data to support a loan application?
USDA NASS Illinois publishes farm production and cash receipt data by county, useful for benchmarking your operation during underwriting.
Can satellite data or digital records improve my loan terms?
Some lenders offer rate incentives for documented sustainable or carbon-conscious practices. Platforms like Farmonaut provide field-level satellite records that support that documentation, though the incentive itself is set by the individual lender, not by any third-party tool.




Further reading:
Conclusion: Next Steps for Illinois Borrowers
The numbers to act on right now: FSA Direct rates at 5.25% (operating) and 6.00% (ownership), Chicago District commercial rates at 7.1% and 6.7%, a loan demand index of 141, and a repayment problems index of 63 — all specific to Q1 2026 or August 2026 and all due for a refresh on the schedule described above: FSA monthly, the Chicago Fed survey quarterly. Bookmark the USDA FSA news page and farmdoc daily rather than this article’s numbers alone, since both update on a fixed calendar and neither requires waiting for a rewrite here.
Beyond rate-shopping, the durable process is the same regardless of which quarter you’re reading this in: identify your loan purpose, pull rates from the primary source, quote at least three lender types, weigh repayment-stress context alongside the headline rate, and build your own documentation before a lender asks for it. For more on how private lenders and credit options fit into that picture, see our companion piece on agriculture lending, credit, and private money lenders.
Whether you’re financing land, covering operating costs in Central Illinois, or securing a farm loan in Southeast Illinois, the strongest position is the same: current rate data from FSA and the Chicago District survey, a documented production history, and a clear answer to what the loan is actually for.

 Atur Kuliner
 GlobalQuant
 MDCV UK
 Zerella Group
 Etech Consulting Madagascar
 Vestlandsforsking
 Agritein
 Delicio
 WB Dev
 Sama Premium
 Prochecker
 Tres Valles
 LACOS Geoinformation
 Magrifly
 LatConnect 60
 Blickwinkel
 Agricultural Credit Policy Council
 Marei Nursery
 eKGIS
eKGIS Mostas Tech
