
Crops · South Carolina data guide
South Carolina Crops: Ranked by Value, Acres and Yield
Corn led South Carolina crops in 2025 at about $240 million, ahead of peaches at $131 million and soybeans at $118 million (USDA NASS). Here are acres, yields, prices, three-year changes and a margin calculator for your own fields.
Key takeaways
- 2025 value by crop: corn $240.0M, peaches $131.3M, soybeans $117.8M, cotton lint $87.3M, peanuts $77.0M, hay $71.9M (USDA NASS).
- Corn yield swung from 150 bu/acre in 2023 to 101 in 2024 and 138 in 2025.
- Peanut harvested area rose from 74,000 to 87,000 acres between 2023 and 2025, while cotton fell from 207,000 to 167,000.
- Clemson Extension ranks the state second in fresh peach production, behind California.
- NASS counts 22,500 farms on 4.6 million acres, an average of 204 acres.
In this article
- South Carolina crops ranked by value
- What crops grow in South Carolina beyond the top nine
- How the row crops moved over three years
- Acres: which crops gained ground
- Peaches, watermelons and other specialty crops
- Livestock and poultry next to the crops
- Farm size and the wider farm economy
- Test a South Carolina crop margin on your own numbers
- Main risks for South Carolina crops
- How to choose what to plant
- Watching crop health across large fields
- How we checked these numbers
- FAQ
Corn was the most valuable of the South Carolina crops in 2025, worth about $240 million, followed by peaches at $131 million and soybeans at $118 million, according to the USDA NASS 2025 State Agriculture Overview for South Carolina. Cotton, peanuts, hay, watermelons and wheat fill out the list of crops with published state values.
This page ranks those crops by value, then shows acres, yields and prices side by side. It also shows how each one moved from 2023 to 2025, and gives you a calculator to test margins on your own fields. Every figure comes from a named US government, Clemson or South Carolina state source.
South Carolina crops ranked by value
The table uses the NASS state overview, which holds the 2025 survey numbers. Value of production is the quantity sold or produced times price. It is not profit, and it is not the same as farm cash receipts. Prices are marketing-year averages, not today’s prices.
| Crop | Value, US$ million | Harvested acres | Yield per acre | Average price |
|---|---|---|---|---|
| 1. Corn for grain | 240.0 | 370,000 | 138 bu | $4.70/bu |
| 2. Peaches | 131.3 | 15,100 | 5.2 tons | $2,030/ton |
| 3. Soybeans | 117.8 | 350,000 | 31 bu | $10.80/bu |
| 4. Upland cotton lint | 87.3 | 167,000 | 992 lb | $0.633/lb |
| 5. Peanuts | 77.0 | 87,000 | 3,550 lb | $0.234/lb |
| 6. Hay | 71.9 | 250,000 | 2.5 tons | $115/ton |
| 7. Cottonseed | 19.5 | Same as cotton | Not given | $209/ton |
| 8. Watermelons | 18.5 | 3,500 | 380 cwt | $15.60/cwt |
| 9. Winter wheat | 18.0 | 60,000 | 60 bu | $5.00/bu |
Lint and seed together put cotton at about $106.8 million, still below soybeans. Add every line in the table and the total is about $782 million.
Three things stand out. Corn wins on total value with the largest area and about twice the value per acre of soybeans. Peaches take second place on a small area, because each acre grosses far more. Hay covers a lot of ground but sits sixth in value.
Chart
Value of production by crop
US$ million, 2025, crops with a published state value; cotton is lint only
What crops grow in South Carolina beyond the top nine
The list above covers only the crops NASS publishes for the state each year. Other crops are grown, but the 2025 tables do not rank them. The NASS Crop Production 2025 Summary does have a South Carolina tobacco row: 5,900 harvested acres in 2023, then no figures, because those estimates were discontinued in 2024. USDA’s February 2026 crop value report puts that 2023 crop at about $24.0 million. The summary gives no South Carolina figure for sweet potatoes. So neither crop can be placed in a 2025 ranking. Clemson Extension still names tobacco among the commodities its agronomy agents support, alongside soybeans and corn.
NASS also lists floriculture items in the state overview, such as bedding plants, cut flowers and potted plants, without values in the 2025 view. Berries and vegetables other than watermelons have no line in the 2025 overview.
How the row crops moved over three years
One year can mislead. The NASS Crop Values 2025 Summary gives three years of value for each major crop, and the swings are large. Corn fell to $141.7 million in 2024 and came back to $240.0 million in 2025. Soybeans lost value in both years. Cotton lint fell from $155.9 million to $87.3 million over the same period. Peanuts stayed between about $75 million and $81 million.
Chart
Value of four row crops
US$ million, 2023 to 2025; cotton is upland lint
Price, yield and area all drive those changes. Soybeans show price and yield falling together. NASS puts the soybean price at $13.00 per bushel in 2023 and $10.80 in 2025. Yield fell too, from 39 to 31 bushels per acre. Corn shows the yield effect most clearly. The price moved from $5.45 in 2023 to $4.60 in 2024 and $4.70 in 2025. In 2024 yield dropped to 101 bushels and harvested area to 305,000 acres, and yield then reached 138 in 2025.
Chart
State average corn yield
Bushels per harvested acre
Acres: which crops gained ground
Farmers changed their mix in these years. Compare the harvested area in the January 2026 crop summary with the later state overview. Corn rose from 350,000 harvested acres in 2023 to 370,000 in 2025. Peanuts rose from 74,000 to 87,000 acres. Cotton fell from 207,000 to 167,000 acres, and soybeans from 385,000 to 350,000. Wheat dropped from 95,000 to 60,000 acres.
Chart
Harvested area, 2023 and 2025
Thousand acres
The figures do not explain why each grower switched, so read them as a record of what happened. They do show that peanuts gained area while cotton lost it. If cotton is still part of your rotation, our guides on cotton soil types and cotton harvest dates by state go deeper. For a national view of corn, see corn yield per acre by state.

▶ Our video on cotton production challenges and ways to deal with them. · 7:38
Peaches, watermelons and other specialty crops
Peaches
Clemson Extension says the state ranks second in fresh peach production behind California and grows more than 50 varieties. NASS reports 78,500 tons of peaches in 2025 from 15,100 acres. Of that, 64,760 tons were utilized, for a value of $131.3 million.
The fruit line can jump from year to year. The Crop Values summary shows fruits and nuts at $62.9 million in 2023 and $174.5 million in 2024, so one year of peach value says little about the next. Growers can find Clemson’s commercial peach resources, including skin disorders and pests.
Watermelons
The NASS Vegetables 2025 Summary and the state overview show 3,500 harvested acres, a yield of 380 cwt per acre and 1.33 million cwt of production in 2025. The value was $18.5 million at $15.60 per cwt. Yield climbed from 280 cwt in 2023 to 340 cwt in 2024 and 380 cwt in 2025.
Disease is a main concern. The 2026 Clemson watermelon fungicide guide names four foliar diseases that reduce yields in the state. It advises two years of non-cucurbit crops between watermelon and cantaloupe to help control gummy stem blight and anthracnose. Check the product label and local rules before any spray.
Blueberries and vegetables
Blueberries and organic vegetables are not in the NASS state overview for 2025, so we give no acres or values for them here. If you are planning a small acreage, your county Extension office is the best first call for local market and variety advice.
Livestock and poultry next to the crops
NASS counts about 237 million broilers produced in 2025 and 280,000 head of cattle and calves on 1 January 2026. It also counts 32,000 meat and other goats and 2,900 milk goats. Broilers are a head count, so they cannot sit directly in a dollar ranking with the crops above.
Hay covered 250,000 acres in 2025, almost as much as cotton and peanuts combined.
Farm size and the wider farm economy
NASS counts 22,500 farm operations on 4.6 million acres, an average of 204 acres, in the 2025 overview. The South Carolina Department of Agriculture describes agriculture and forestry together as the state’s No. 1 industry, with nearly 260,000 jobs and $51.8 billion in annual economic impact. That is an economic impact figure, so it is much larger than the crop values in our table.
Forestry
Timber has its own figure. The South Carolina Forestry Commission reports a $23.2 billion impact on the state’s economy from a study it publishes. It ranks forestry first in employment and second in labor income and value added among the state sectors in that study. Land managers can read our guide to sustainable forest management techniques.
Test a South Carolina crop margin on your own numbers
Average state value tells you little about your own farm. What matters is the yield you can expect, the price you can lock in, and your cost per acre. Use the calculator below with your own numbers. The default yield and price are close to the 2025 state corn figures. The cost is only an example, set so the result sits near break-even.
Your extension budget or your own records will give a better cost number. Get professional advice before making a major financing or lease decision.
Try the numbers for your own farm below.
Calculator
What margin could this crop leave on your acres?
Enter your own acres, yield, price and cost.
- Income per acre (US$): $658
- Margin per acre (US$): $8
- Break-even yield per acre: 138.3 units
Example values only, not a benchmark or a forecast. The yield and price are near the USDA NASS 2025 state corn figures (138 bu/acre, $4.70/bu, a marketing-year average). The cost is a made-up example set near break-even. All values are inputs and you can change them for any crop. Excludes payments and insurance.
Main risks for South Carolina crops
Yield swings and drought
The 2024 corn yield of 101 bushels, against 150 in 2023, shows how far a state average can move in one year. Soybeans fell from 39 to 31 bushels over the same three years. Water supply is a live issue. On 5 November 2026 the Drought.gov page for South Carolina showed about 1.8 million residents in areas of drought, and it reported September as the state’s 27th driest on record since 1895.
Price pressure
Upland cotton lint value fell by 44% between 2023 and 2025, on less area and a lower price. Check current prices before you commit acres, since the table above shows marketing-year averages for 2025 and not today’s bids.
Soil and fertility
Clemson’s home and garden soil testing fact sheet advises taking 8 to 10 or more core samples for each composite sample. Keep areas that were fertilized or limed differently as separate samples. Samples go through your county Extension office for a small fee. Results include fertilizer and lime recommendations. Follow local rules and the product label when you apply any input.
Disease and pests
Specialty crops need close disease and pest control. Peach and watermelon growers should use the current Clemson guides each season, because recommended products change. Crop rotation is one tool the watermelon guide names directly.
Getting help after a loss
The USDA Farm Service Agency’s South Carolina office lists loans, conservation, disaster recovery and income support programs. Contact your county office for current rules and deadlines, because they can change from year to year.
How to choose what to plant
- Start with your market. Peaches and watermelons gross more per acre in the 2025 figures, but they need buyers, labor and packing plans. Grain and cotton sell through established channels.
- Look at your soil and water. Test soil first. Check whether you can irrigate in a dry year.
- Use a three-year view. Do not plan on one good price. Run your margin at the low and the high prices of the past three years.
- Plan your rotation. Row crops can follow each other in a sequence that spreads price risk. Keep the two-year gap between cucurbits if melons are in your plan.
- Budget your equipment. A new crop can need new tools. Our list of common farm tools and their uses is a simple starting checklist for a small farm.
- Watch your fields during the season. A regular scouting routine helps you find weak areas before harvest.

▶ A walk-through of the Farmonaut web app for monitoring crops by satellite. · 8:43
Watching crop health across large fields
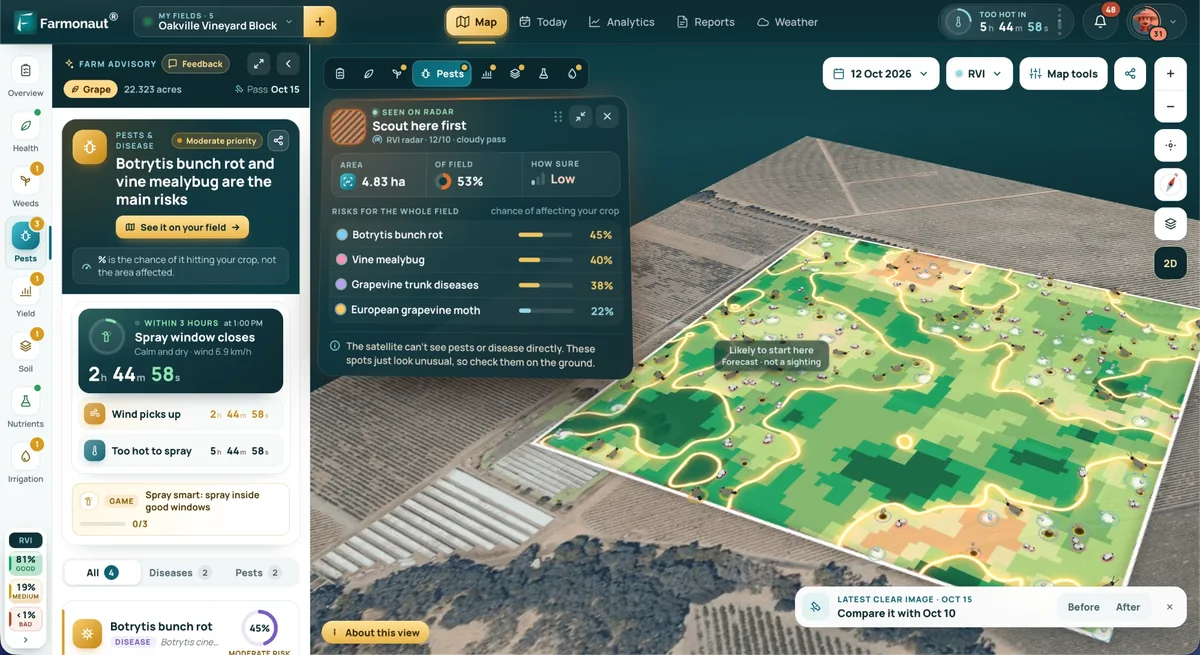
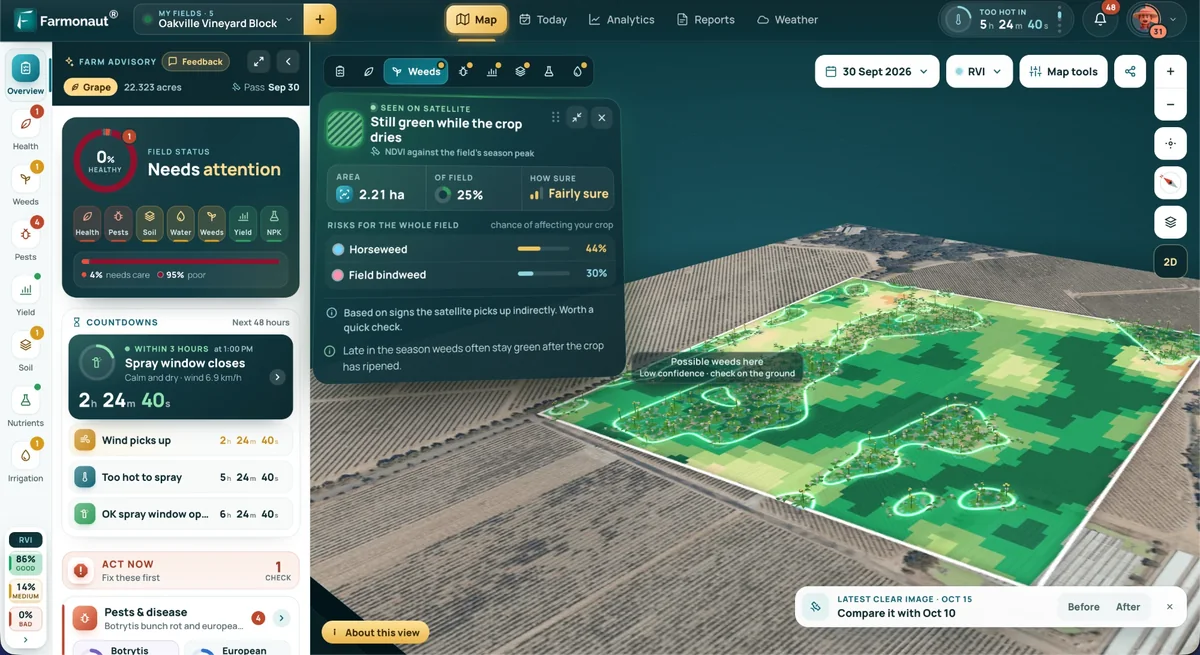
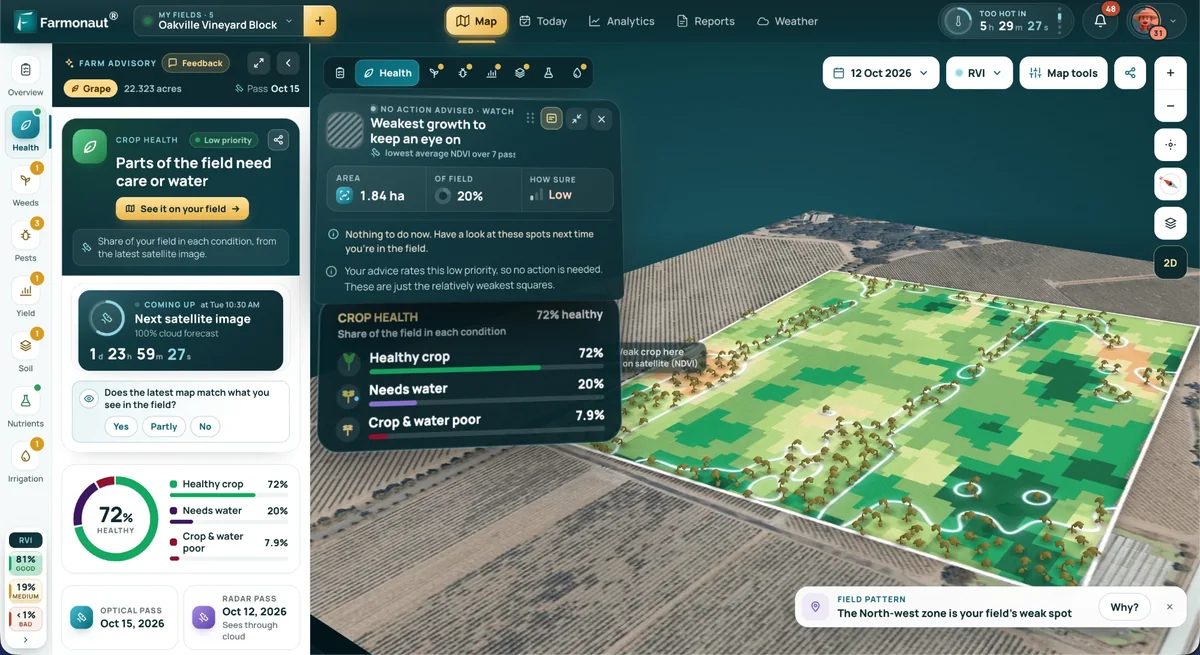
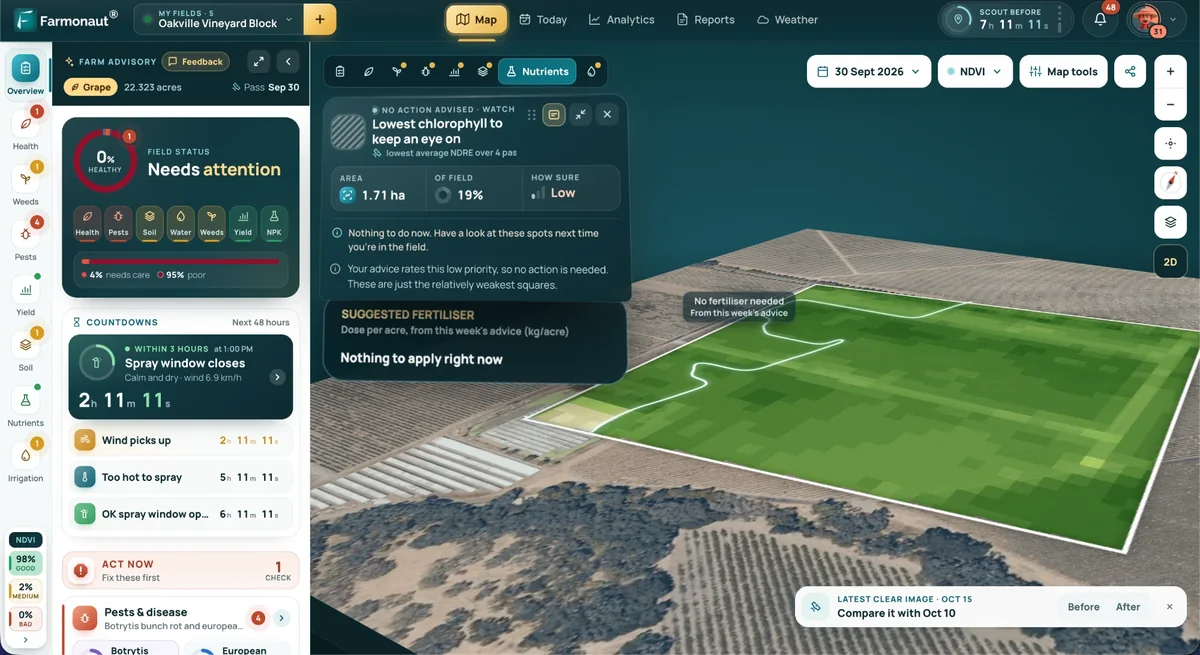
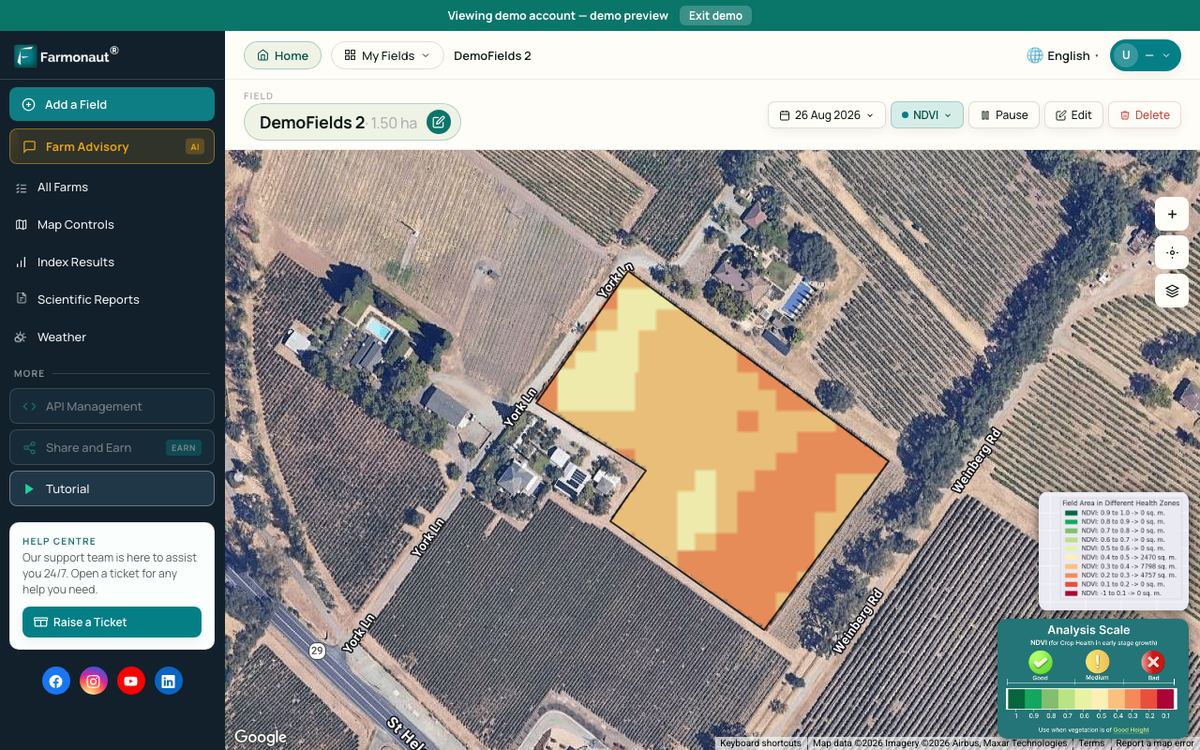
Walking every acre each week is hard on a 200-acre farm and harder on a larger one. Satellite vegetation maps can show which parts of a field are changing, so you know where to scout first. They show a change in plant vigor. They do not name the cause, so someone still needs to walk the spot. The Farmonaut Satellite + AI Farm Monitoring System is one tool that provides this kind of map, through a web or mobile app.
Related pages on our site: farm vehicle management, crop traceability, farm carbon tracking, crop loan and insurance checks, satellite and weather API docs, API access and web app.
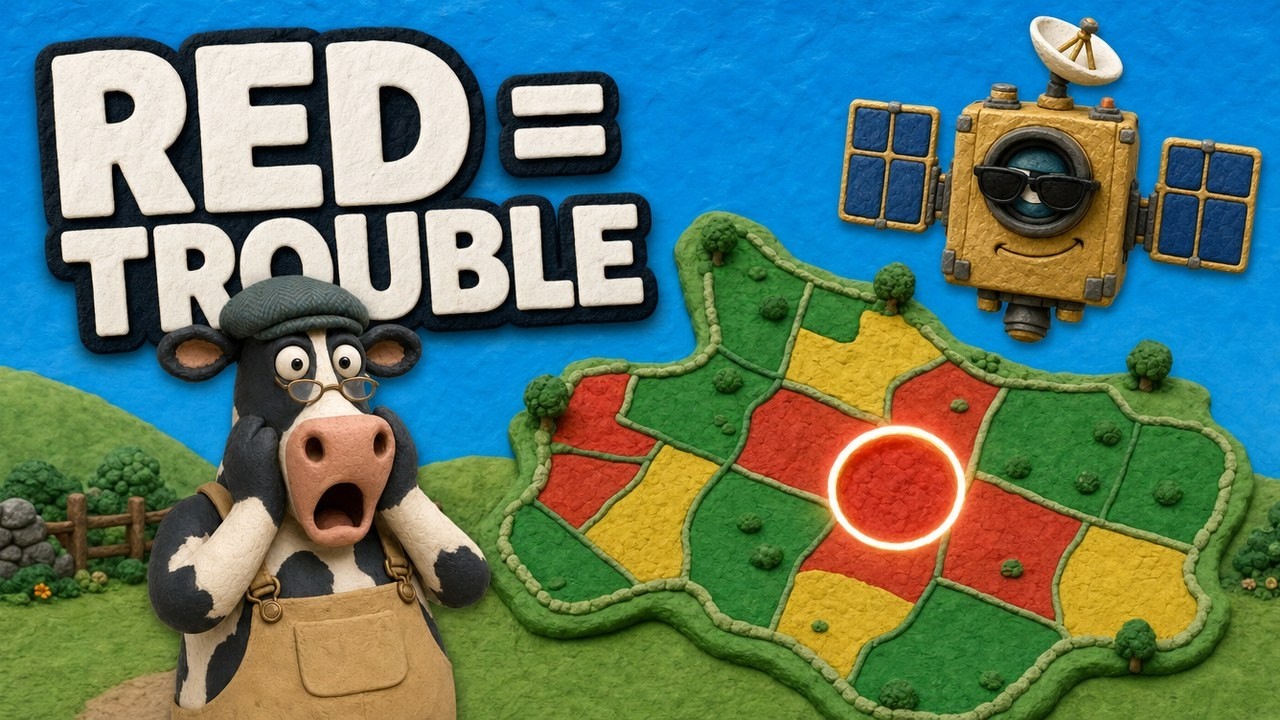
▶ How satellite NDVI maps show crop stress, explained with memes. · 4:09
How we checked these numbers
We took 2025 values, acres, yields and prices from the NASS state overview, as shown on 5 November 2026. NASS revises its estimates, so a few 2025 lines differ from the January 2026 summary. Peanut production, for example, is 313.2 million pounds in January and 308.85 million in the later overview. Where they differ we use the later figure for acres, yield and price. The overview’s dollar values still match the February 2026 Crop Values summary, so for soybeans, cotton lint and peanuts the table’s lines will not multiply exactly to the value. The February prices behind those values were $10.70/bu, $0.535/lb and $0.246/lb. The 2023 and 2024 figures come from the Crop Values and Crop Production summaries. We ranked only crops with a published 2025 dollar value, and the total is our own addition.
FAQ
What are the main crops in South Carolina?
By 2025 value, the leaders are corn, peaches, soybeans, cotton, peanuts and hay, with watermelons and wheat next (USDA NASS). Corn for grain was worth about $240 million.
What is South Carolina’s largest crop by area?
Corn for grain, at 370,000 harvested acres in 2025. Soybeans were close behind at 350,000 acres, and hay covered 250,000.
Is South Carolina a big peach state?
Yes. Clemson Extension ranks it second in fresh peach production, behind California. NASS shows $131.3 million of peach value in 2025 from 15,100 acres.
Does South Carolina still grow tobacco and sweet potatoes?
Clemson Extension still lists tobacco among the crops its agents support. NASS last reported South Carolina tobacco for 2023, at 5,900 acres and about $24.0 million, before those estimates were discontinued in 2024. Its 2025 crop summary gives no South Carolina figure for sweet potatoes. So neither has a 2025 value here.
How many farms are in South Carolina?
NASS counts 22,500 farm operations on 4.6 million acres in its 2025 overview, or 204 acres on average. The state agriculture department says more than 22,600.
How can I estimate profit for a crop here?
Multiply your expected yield by a current price, then subtract your cost per acre. The calculator on this page does that and also gives your break-even yield. Use your own costs, not the example.
Farmonaut crop monitoring
See your own fields from space
Check satellite vegetation maps of your fields and decide where to scout first.



Keep reading
Sources
- USDA NASS, 2025 State Agriculture Overview for South Carolina: nass.usda.gov
- USDA NASS, Crop Values 2025 Summary (February 2026): nass.usda.gov
- USDA NASS, Crop Production 2025 Summary (January 2026): nass.usda.gov
- USDA NASS, Vegetables 2025 Summary: nass.usda.gov
- Clemson Extension, Peaches: clemson.edu
- Clemson Extension, Commercial Peach Growers: clemson.edu
- Clemson Land-Grant Press, 2026 Watermelon Fungicide Guide: lgpress.clemson.edu
- Clemson HGIC, Soil Testing: hgic.clemson.edu
- Clemson Extension, Agronomy: clemson.edu
- South Carolina Department of Agriculture: agriculture.sc.gov
- South Carolina Forestry Commission: scfc.gov
- NIDIS Drought.gov, South Carolina: drought.gov
- USDA Farm Service Agency, South Carolina: fsa.usda.gov
Discussion
Questions, corrections or field experience? Share them below. First-time comments are reviewed before they appear, and your email is never published.
No comments yet. Be the first to add a question or your experience.

 AdBio
 MISE Maroc
 Drift-Sense
 NWNS
 Hydenmet
 Red August Group
 Farm Inc
 WeMe Global
 Agrotoken
 Blue BearX
 Insignito
 Croptimum
 DnCubed
 Field Capacity
 Indosistim Teknologi
 Liquify Digital
 CU Foods
 BeyondTech Global

 Licence holder · Niger · Gold
 Licence holder · Nigeria · Gold + lithium
 Client · Somalia · Gold