

Reviewed August 2026 against USDA NASS Crop Production reports, the American Farm Bureau Federation’s Market Intel analysis of USDA farmland data, and Land Boss’s regional Tennessee land-market breakdown.
Try it: Run your own numbers →
Tennessee farmland is not sold at one statewide price — it trades in three distinct zones, and the gap between them runs into the thousands of dollars per acre. West Tennessee row-crop ground in the Mississippi Delta commands the highest prices because of soil quality and irrigation access; Middle Tennessee hay and pasture land sits in the middle, pushed up by urban expansion near Nashville; East Tennessee’s smaller foothill parcels are the most accessible entry point for buyers with limited capital. National context matters here too: US cropland values rose 21.8% between 2022 and 2026, according to USDA NASS data analyzed by the American Farm Bureau Federation, so anyone comparing a Tennessee asking price to “what land used to cost” is comparing against a market that has already moved substantially.
This page covers what a buyer or seller actually needs: county-level price ranges, how Tennessee compares to national farm real estate benchmarks, what drives the difference between regions, and the parts of due diligence that a Google AI summary can’t hand you — actual soil, water, and yield-history data for a specific tract.
Table of Contents
- Tennessee Farmland: Where It Trades and Why
- National Farm Real Estate Benchmarks: Where Tennessee Fits
- Tennessee’s Three Farmland Regions
- Farmland for Sale in Tennessee: What Moves the Price
- County-by-County Price Comparison
- Farmland Purchase Cash-Flow Calculator
- Why Buyers Choose Tennessee Over Neighboring States
- Extension Services & Technology Support
- Current Trends Reshaping Tennessee Farmland Demand
- Buyer’s Due-Diligence Checklist
- Verifying a Tract Before You Buy: Satellite Tools
- What Would Change This Outlook
- Frequently Asked Questions
Tennessee Farmland: Where It Trades and Why
Tennessee farmland spans a wide price range because the state’s three agricultural regions have almost nothing in common except a border. West Tennessee’s Mississippi Delta counties sit on some of the most productive row-crop soil in the country, and land there prices closer to Midwest corn-belt ground than to the rest of the state. Middle Tennessee is a mixed hay-and-pasture economy under pressure from Nashville’s growth. East Tennessee is smaller parcels, rolling terrain, and a rising share of organic and nursery operations. Someone searching for “farmland in Tennessee for sale” or looking to “buy farmland in Tennessee” needs to know which of these three markets they’re actually shopping in before a per-acre number means anything.
Agriculture remains one of Tennessee’s largest industries by employment and land use, and the state’s diversified output — cotton, soybeans, corn, hay, cattle, poultry, and a growing specialty-crop sector — is part of what keeps demand for farmland broad-based rather than tied to a single commodity cycle.
National Farm Real Estate Benchmarks: Where Tennessee Fits
Before pricing a Tennessee tract, it helps to know the national backdrop. USDA NASS data, summarized by the American Farm Bureau Federation’s Market Intel team, shows US cropland values climbed 21.8% between 2022 and 2026 — a sharp move even by farmland’s historically steady standards (American Farm Bureau Federation, Market Intel). The same analysis puts the average US cropland cash rental rate at $161 per acre for 2025. Cash rent is worth knowing even for buyers who don’t plan to lease out land, because it’s the number appraisers and lenders use to sanity-check whether a purchase price can be supported by farm income alone.
For state-specific and county-specific benchmarks — the actual figures a Tennessee buyer needs rather than the national average — USDA NASS publishes its Quick Stats database, which is queryable by state, county, and year and is updated each February with the prior year’s farm real estate and cropland values. That is the authoritative source for a current Tennessee-specific average, and it’s the tool to use rather than relying on a number printed in an article that ages by the month: USDA NASS Quick Stats.
On the production side, 2025 was a strong year nationally: US corn production reached 17.0 billion bushels at a record average yield of 186.5 bushels per acre, and soybean production hit 4.26 billion bushels at a record average yield of 53.0 bushels per acre, per USDA NASS’s Crop Production Annual report (USDA NASS Crop Production Annual, 2025). Those are national totals, not Tennessee-specific figures — Tennessee’s own corn, soybean, wheat, and hay yields for 2025 are not broken out in the source used for this article, so a buyer who needs the state-level number should pull it directly from the same Quick Stats database linked above, filtered to Tennessee.

Tennessee’s Three Farmland Regions
Land Boss’s regional breakdown of the Tennessee land market groups the state into the same three zones that appraisers and local brokers use, and each has a different buyer profile (Land Boss, Tennessee Land Market).
West Tennessee — Mississippi Delta
This is the state’s highest-value row-crop ground: deep, fertile alluvial soils suited to cotton, corn, and soybeans, much of it under irrigation. Buyers here are typically established row-crop operators or institutional investors targeting scale, since tract sizes tend to run larger than in the rest of the state.
Middle Tennessee — Rolling Hills
Hay, pasture, and cattle operations dominate, with a growing pocket of specialty and nursery production. This is also the zone most exposed to Nashville’s metro growth — land near the urban edge is increasingly priced for its development option value as much as for its row-crop or pasture income, which pushes per-acre prices well above what farm income alone would justify.
Eastern Highland Rim & Appalachian Foothills
Smaller parcels, more topography, and the state’s strongest concentration of organic and nursery operations. This is generally the most accessible entry point for a buyer working with a smaller budget, though tract sizes and mechanization potential are more limited than in the west.
Primary Crops and Livestock by Category
- Row crops: Cotton, soybeans, corn, wheat — concentrated in West Tennessee
- Forage and pasture: Hay, cattle grazing — concentrated in Middle Tennessee
- Specialty: Hemp, organic vegetables, nursery stock — concentrated in East Tennessee
- Livestock: Cattle statewide, poultry concentrated in Middle Tennessee
- Try it: Run your own numbers

Farmland for Sale in Tennessee: What Moves the Price
Within any one of the three regions, the same handful of factors separate a premium tract from an average one:
- Soil quality and drainage class — the single biggest driver of row-crop value in West Tennessee specifically
- Irrigation access — irrigated Delta ground carries a substantial premium over dryland in the same county
- Water access more broadly — well capacity, pond access, and rainfall reliability for pasture and hay ground
- Proximity to grain elevators, processors, and interstate corridors — lower hauling cost translates directly into higher net farm income and therefore land value
- Existing infrastructure — barns, fencing, grain storage, poultry houses
- Zoning and greenbelt status — particularly relevant in Middle Tennessee counties near Nashville, where agricultural-use tax assessment can make a large difference in carrying cost
- Development pressure — the closer a tract sits to a growing metro edge, the more its price reflects future non-farm use rather than current farm income
A buyer comparing two similarly priced tracts should run the same math a lender would: does the land’s realistic farm income — using a regional cash rent comparable, since the national average sits at $161 per acre per USDA NASS data — support the purchase price at a reasonable capitalization rate, or is the buyer paying for appreciation and development potential instead? Both can be legitimate strategies, but they’re different bets and should be underwritten differently.

County-by-County Price Comparison
The table below groups representative Tennessee counties by region so a buyer can see how location alone changes the price conversation. These are directional figures for orienting a search, not an appraisal — for a specific tract, cross-check against USDA NASS Quick Stats and a local county appraisal.
| Region | Representative Counties | Dominant Land Use | Price Positioning vs. State | Typical Buyer Profile |
|---|---|---|---|---|
| West Tennessee (Delta) | Shelby, Obion, Madison | Row crops: cotton, soybeans, corn, wheat | Highest — irrigated tracts command the strongest per-acre premium in the state | Established row-crop operators, institutional buyers |
| Middle Tennessee | Davidson, Rutherford | Hay, pasture, cattle, specialty/nursery near urban edge | High near Nashville metro, moderate elsewhere — priced partly on development potential | Livestock operators, greenbelt/lifestyle buyers, developers |
| Southeast Tennessee | Hamilton | Nursery, organic vegetables, horticulture | Moderate to high — reflects strong regional organic/specialty demand | Specialty and organic producers |
| East Tennessee (Highland Rim/Foothills) | Greene | Corn, hay, dairy, small-acreage specialty | Most affordable — smaller parcels, less mechanization potential | Smaller-budget buyers, entry-level operators, dairy |
For an authoritative current dollar figure by county — including the state and national cropland and farm real estate averages this table intentionally leaves as directional — query USDA NASS Quick Stats directly at the link above, or use the American Farm Bureau’s Market Intel writeups as a starting benchmark before drilling into county-level detail.
Farmland Purchase Cash-Flow Calculator
Use this to check whether a specific asking price is supportable by farm income at a given cash rent and capitalization rate — enter your own tract size, price, and rent assumptions rather than relying on a statewide average.
Run your own numbers
Assumptions: this calculator uses the cash-rent-vs-price capitalization method lenders commonly reference, defaulted to the 2025 US average cash rental rate of $161/acre (USDA NASS via American Farm Bureau Federation). It excludes financing costs, appreciation, and any development or non-farm value — those depend on your specific tract and should be assessed separately.
Why Buyers Choose Tennessee Over Neighboring States
Tennessee farmland’s appeal comes down to a handful of concrete advantages rather than generic “great place to farm” marketing:
- Central transportation position. Interstates 24 and 40, plus the Mississippi River network through West Tennessee, put much of the state’s row-crop ground within efficient hauling distance of major grain markets and export terminals — a real cost advantage over more remote production regions.
- Price relative to national appreciation. With US cropland values up 21.8% since 2022 (USDA NASS via American Farm Bureau Federation), Tennessee’s price levels — particularly in East Tennessee and parts of Middle Tennessee — remain more accessible than corn-belt ground carrying similar national appreciation.
- Crop diversification. Cotton, soybeans, corn, wheat, hay, cattle, poultry, and specialty crops all coexist across the state’s three regions, which reduces the single-commodity price risk a buyer takes on in a more concentrated agricultural state.
- Extension infrastructure. The University of Tennessee Extension provides county-level agronomic and resource-management support that lowers the operational learning curve for buyers new to a region.

Extension Services & Technology Support
The University of Tennessee Extension operates in every county and is the primary public resource for:
- Precision agriculture and yield-optimization guidance
- Data-driven farm record keeping
- New crop variety trials and specialty-crop transition support
- Irrigation planning and water conservation
- Pest and disease management specific to Tennessee growing conditions
For a buyer new to a region, an initial call to the county extension office is one of the fastest ways to get an honest, non-commercial read on local yield expectations, water reliability, and pest pressure before making an offer.

For landowners seeking advanced monitoring and resource optimization at scale, explore our Large Scale Farm Management solution, which uses satellite insights and AI for field-level decision-making.
Current Trends Reshaping Tennessee Farmland Demand
- Specialty and organic crop expansion. Middle and East Tennessee are seeing rising interest in organic vegetables, hemp, and nursery production as buyers look for higher per-acre margins than commodity row crops can offer on smaller tracts.
- Carbon and sustainability compliance. Institutional and ESG-conscious buyers increasingly want carbon-footprint documentation on farmland they acquire (learn about carbon footprint monitoring here).
- Precision technology adoption. Satellite monitoring and AI-driven advisory tools are increasingly standard in due diligence, not just post-purchase management.

- Sustained national appreciation. With cropland values up 21.8% nationally since 2022 per USDA NASS, farmland has continued to draw capital as an inflation hedge — a dynamic that shows in Tennessee’s own price trajectory, though the state-specific figure should be confirmed against current USDA NASS Quick Stats data rather than a fixed number.
- Supply-chain traceability demand. Buyers of Tennessee specialty crops, particularly around Nashville, increasingly ask for verifiable supply-chain data (blockchain-based traceability solutions).
- Financing and insurance access. Satellite-verified crop data is increasingly used to support loan and insurance underwriting (satellite-verified crop loan eligibility).



Access satellite monitoring, operational analytics, and real-time field insights for Tennessee farmland with the Farmonaut Web App and Mobile Apps.
For logistics, route planning, and machinery tracking across larger Tennessee operations, our Fleet Management solution helps control costs and improve resource efficiency.

Buyer’s Due-Diligence Checklist
Whether shopping row-crop ground in the Delta or a small foothill tract in the east, the underwriting steps are the same:
- Define the investment objective first. Row-crop income, specialty-crop diversification, livestock, or land appreciation each call for a different region and a different underwriting approach.
- Pull soil, water, and yield-history data before the site visit. Satellite and AI-based analytics can surface multi-year vegetation health and water-access issues for a specific tract ahead of an in-person visit.
- Underwrite against a real cash-rent comparable, not a national average alone — use the calculator above with a regional rent figure from a local land agent or the county extension office, cross-checked against the $161/acre national average from USDA NASS.
- Account for full carrying cost — property tax, insurance, and infrastructure maintenance — against realistic crop or rental income, not gross revenue.
- Check zoning and greenbelt/agricultural-use assessment status, especially in Middle Tennessee counties near Nashville where development pressure affects both price and property tax treatment.
- Verify current-year USDA NASS figures directly rather than relying on a fixed number in any single article — Quick Stats is refreshed annually each February.
Tip: Harness Farmonaut’s Satellite API or explore our API Developer Docs to pull real-time field insights into an acquisition pipeline — useful for institutional buyers or family offices screening multiple Tennessee tracts at once.
Verifying a Tract Before You Buy: Satellite Tools
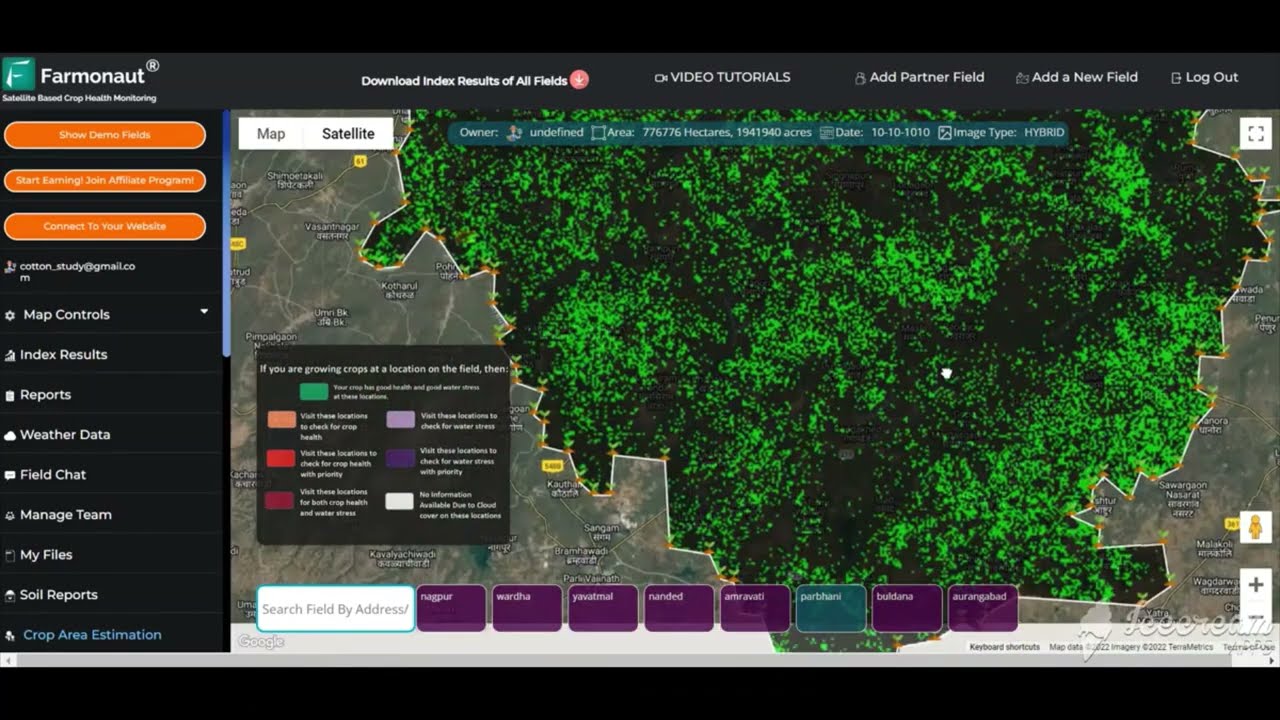
Land descriptions and even recent aerial photos can miss problems a multi-year satellite record will catch — a drainage issue that only shows in a wet spring, a pivot that hasn’t run in two seasons, a field boundary that doesn’t match the deed. Farmonaut’s satellite platform gives buyers and existing landowners a way to check these before committing capital.
Key Capabilities for Tennessee Landowners and Investors
- Satellite-based monitoring: Track crop health, soil conditions, and water usage across a property in near real time.
- AI advisory system: Localized recommendations for planting, fertilization, irrigation, and pest management.
- Blockchain traceability: Supply-chain transparency for specialty-crop producers selling into Nashville and regional markets (read more here).
- Fleet and resource tracking: Vehicle and equipment monitoring to control logistics costs (Fleet Management Features).
- Environmental impact tracking: Carbon footprint monitoring for ESG-oriented buyers and compliance needs (explore carbon monitoring).
What Would Change This Outlook
The current picture — Tennessee holding a wide internal price range across three distinct regions, with national cropland values up 21.8% since 2022 and average national cash rent at $161/acre — is a snapshot of a market that moves every year. A few things would shift it meaningfully: a sustained drop in national commodity prices would compress cash rents and, with them, land values, since the capitalization math in the calculator above works in both directions. Continued Nashville-area population growth would keep pushing Middle Tennessee land prices further above what farm income alone supports. And any material change in federal crop insurance or conservation program funding would affect the income buyers can underwrite against, particularly for smaller East Tennessee operations that rely more heavily on program support relative to gross revenue.
None of these are predictions — they’re the variables to watch. The reliable way to track them is the same USDA NASS Quick Stats query used throughout this article, checked against the current year rather than the figures cited here.
Frequently Asked Questions
What is the average price per acre for Tennessee farmland?
Tennessee farmland prices vary sharply by region: West Tennessee Delta row-crop ground commands the highest per-acre prices in the state, Middle Tennessee sits in a high-to-moderate range influenced by proximity to Nashville, and East Tennessee’s smaller foothill parcels are generally the most affordable. For a current statewide or county-level dollar figure, query USDA NASS Quick Stats directly, which is updated annually each February.
How does Tennessee farmland compare to the national average?
US cropland values rose 21.8% between 2022 and 2026, per USDA NASS data analyzed by the American Farm Bureau Federation. Tennessee’s East Tennessee and parts of Middle Tennessee tend to price below the highest-value US corn-belt ground, while West Tennessee’s irrigated Delta soils compete more directly with premium row-crop regions nationally.
What is a reasonable cash rent to assume when underwriting a Tennessee farmland purchase?
The US average cropland cash rental rate was $161 per acre in 2025, per USDA NASS. That is a national figure, not Tennessee-specific — use it as a starting point in the calculator above, then confirm a regional number with a local land agent or the University of Tennessee Extension office for the county in question.
Which regions of Tennessee are most affordable for smaller or first-time farmland buyers?
East Tennessee’s Highland Rim and Appalachian Foothills counties, such as Greene County, generally offer the most accessible entry point due to smaller parcel sizes and lower per-acre pricing than West or Middle Tennessee, though tract size and mechanization potential are more limited.
What crops dominate Tennessee’s farmland acreage?
Cotton, soybeans, corn, and wheat dominate West Tennessee’s row-crop acreage; hay and cattle pasture dominate Middle Tennessee; and organic vegetables, hemp, and nursery production are a growing share of East Tennessee’s specialty-crop acreage.
Can satellite technology help with due diligence before buying Tennessee farmland?
Yes. Multi-year satellite vegetation-health records can flag drainage, irrigation, and yield-consistency issues on a specific tract before a site visit, which reduces the risk of relying only on a seller’s description or a single recent aerial photo.
How do I get started with Farmonaut’s tools?
Access satellite monitoring, field analytics, and advisory services through the Farmonaut web and mobile apps, or build a custom due-diligence workflow via our API interface.
Tennessee’s Farmland Market: The Durable Read
Tennessee’s farmland market isn’t one number — it’s three regional markets with different soil, different buyers, and different price logic, sitting inside a national cropland market that has appreciated 21.8% since 2022. The way to evaluate any specific tract stays constant even as the dollar figures move: identify which of the three regions it’s in, underwrite the price against a real cash-rent comparable using a capitalization approach like the calculator above, confirm current USDA NASS figures rather than a fixed number from any one article, and verify the tract itself with multi-year data before relying on a listing description alone.
Begin your data-driven Tennessee farmland due diligence today:
For advanced analytics, field management, and satellite monitoring to support your farmland decisions, get started with Farmonaut today.

 Marei Nursery
 Sayaji Group
 eKGIS
eKGIS Mostas Tech
 Native Seeds
 Andex
Andex FCF India
 Unifrutti Gulf
 Deluxe Conseil
 TVS Electronics
 BW Pipelines
 WICO
WICO Chimera Innovation
 SkyHarvest
 Polaris Digitech
