

Responsible Dairy Farming: 5 Practices, Ranked by Data
Reviewed August 2026 against USDA NASS, EPA AgSTAR, and USDA Economic Research Service data.
Try it: Run your own numbers →
Responsible dairy farming means measurable practices, not marketing language: anaerobic digestion of manure, precision water and feed management, rotational grazing, and animal-health monitoring that together cut methane, water use, and runoff per unit of milk produced. In the United States, 221 anaerobic digesters were operating on dairy farms as of April 2021, cutting an estimated 4.29 million metric tons of CO2-equivalent emissions annually, according to EPA AgSTAR. That is the clearest, most-cited proof point that dairy sustainability practices produce numbers regulators and buyers can check — which is exactly what separates a sustainable dairy industry claim from a sustainable dairy industry fact.
This page ranks the five practices with the most impact per dollar invested, using the USDA and EPA figures below rather than round estimates. Where a number genuinely isn’t published — feed-conversion gains from breeding, for instance — we say so and point to where you can get it for your own herd.
Where Responsible Dairy Farming Stands
US dairies produced 226 billion pounds of milk in 2024, per USDA NASS, and that volume is exactly why manure and methane management dominate any serious sustainable dairy industry discussion — at that scale, a percentage-point improvement in emissions or water use moves a genuinely large absolute number. USDA NASS publishes milk production data on a running basis, so the 226-billion-pound figure for 2024 is the most recent full-year total available; check the USDA NASS milk survey page directly for the year you need, since NASS revises and updates this dataset on its own release schedule rather than annually in sync with any single article.
On manure specifically, USDA’s Economic Research Service (ARMS survey, 2017–2019) found 42% of US dairy operations had adopted some form of anaerobic manure management system — a floor, not a ceiling, since the survey window ends in 2019 and adoption has continued via digester construction tracked separately by EPA AgSTAR. The same ERS analysis found methane emissions from manure handling rose 54% between 1990 and 2008, which is the historical trend digesters and improved manure management are working against. Both figures come from the same source: USDA Economic Research Service, publication 44810.
What “Sustainable Dairy Farming” Actually Measures
Dairy farming sustainability breaks into three components that show up in every USDA and EPA dataset cited on this page:
- Emissions accounting — methane from enteric fermentation and manure storage, measured in metric tons of CO2-equivalent by EPA AgSTAR’s digester program.
- Resource efficiency — water, feed, and energy per unit of milk, tracked through USDA NASS production surveys and individual farm records.
- Manure system type — whether manure is stored in open lagoons (higher methane), applied directly, or routed through a digester that captures biogas, per USDA ERS’s ARMS survey categories.
Sustainable dairy industry claims that skip these three categories — vague statements about “eco-friendly practices” without a manure-system type, a herd size, or a state — are the reason this topic ranks well on search but converts poorly on trust. The rest of this page ties every practice back to one of the three.
Top 5 Dairy Sustainability Practices — Ranked by Verified Impact
| Practice | What It Does | Verified Figure | Source & Period | Adoption Barrier |
|---|---|---|---|---|
| Anaerobic digestion (manure-to-energy) | Captures methane from manure storage, converts to biogas for on-farm energy or pipeline injection | 221 digesters operating; 4.29 million metric tons CO2e reduced annually | EPA AgSTAR, April 2021 | Upfront capital cost; no standardized USDA payback figure published (see Gaps section) |
| Anaerobic manure management (broader category) | Includes digesters plus covered lagoons and other methane-capturing storage | 42% of US dairy operations had adopted some form | USDA ERS/ARMS, 2017–2019 | Survey is several years old; no more recent unified national rate published |
| Herd-scale precision monitoring | Sensor and satellite-based tracking of feed, water, and pasture condition | No unified USDA adoption-rate figure published | Method described in Gaps section below | Requires on-farm connectivity and per-animal or per-field sensors |
| Rotational grazing | Timed pasture rotation to protect soil carbon and forage quality | No current national adoption percentage published by USDA | Known trend; see Gaps section for how to check regionally | Land base and fencing infrastructure requirements |
| Wisconsin-scale regional benchmark | State-level herd count as a proxy for regional dairy density and manure-volume planning | 5,617 milking herds | USDA NASS, February 2024 | State-specific; not a national figure |
Two rows in this table say plainly that a national percentage doesn’t exist yet. That is deliberate — a sustainable dairy industry page that invents an adoption rate for rotational grazing is less useful to you than one that tells you exactly which extension office publishes the real number for your state.
1. Manure-to-Energy: Anaerobic Digestion
Anaerobic digestion is the single most-measured practice in US dairy sustainability, because EPA AgSTAR maintains an actual count of installed systems rather than a survey estimate. As of April 2021, 221 anaerobic digesters were operational on US dairy farms, and together they reduced methane emissions by an amount equivalent to 4.29 million metric tons of CO2 annually. That figure comes directly from EPA AgSTAR’s dairy digester program page, which tracks the national inventory and updates as new systems come online — check it directly for a current count, since digester construction has continued past the 2021 snapshot cited here.
How a Dairy Digester Changes the Manure-Handling Math
- Covered vs. open storage: A digester captures methane that would otherwise vent from open manure lagoons — the same methane pathway that USDA ERS found grew 54% between 1990 and 2008 as manure storage shifted toward liquid systems.
- On-farm energy generation: Captured biogas can run generators or boilers, offsetting purchased electricity — the mechanism behind EPA’s 4.29 million metric ton CO2e figure.
- Nutrient management side benefit: Digested manure (digestate) is easier to separate into solids and liquids for targeted field application, reducing nutrient runoff risk.
- Satellite verification of downstream field impact: Farmonaut’s satellite-powered insights can track vegetation and soil-moisture response on fields receiving digestate, giving an operational way to confirm nutrient application is working as intended.
What’s missing from the public record — and this matters if you’re evaluating whether to build one — is a standardized cost-benefit figure. Feasibility studies exist at the individual project level, but there is no single USDA-published average upfront investment or payback period for on-farm digesters that applies nationally; system cost varies too much with herd size, manure volume, and whether the biogas is used on-site or upgraded for pipeline injection. The calculator further down this page lets you run that math with your own herd size and local energy price instead of relying on a number that doesn’t exist yet at the national level.



Where to check for current incentives: state-level digester grants and cost-share programs change frequently. Contact your state agricultural extension office — Penn State, UW-Madison, or the University of Vermont are three that publish dairy-specific sustainability guidance — or check your state agriculture department’s website on a quarterly basis for new greenhouse-gas or digester funding announcements, since no single national database aggregates these on a fixed schedule.
2. Efficient Resource Management
Water, feed, and energy efficiency is the category most often cited in general terms and least often backed with a hard national baseline — which is worth being direct about. The research available for this article did not surface a standardized USDA figure for national average water consumption per gallon of milk produced; a percentage-improvement claim without a stated US baseline is not verifiable, so treat any such figure you encounter elsewhere with the same skepticism until it names its baseline year and measurement method.
What Can Be Measured on Your Own Operation Today
- Automated milking and feeding systems: Sensor-driven equipment adjusts feed and water delivery to match individual animal intake, which is measurable on-farm even without a national benchmark to compare against.
- Leak detection and metering: Installing water meters at key points (parlor, cooling, cleaning) gives you your own baseline — the only way to prove a reduction is to measure your starting point first.
- Satellite-based pasture and field monitoring: Farmonaut’s satellite-powered insights measure field moisture and pasture nutrition, which supports feed and irrigation decisions even where no industry-wide efficiency percentage exists yet.
- Milk production context: With US dairies producing 226 billion pounds of milk in 2024 (USDA NASS), any per-farm efficiency gain should be benchmarked against your own prior-year records rather than a national average, since NASS doesn’t publish a per-unit resource-intensity figure alongside its production totals.
The same caution applies to broader sustainable agriculture practices lists that cite universal percentage savings — cross-check any water or feed savings claim against your own metered data before using it in a sustainability report or buyer disclosure.
Did you know? Farmonaut’s environmental impact tracking, available in its main app suite, gives farms field-level data they can log over time to build their own resource-use baseline — which is the only kind of efficiency figure that holds up to an auditor’s question of “compared to what?”
3. Animal Welfare and Health Monitoring
Animal welfare connects to sustainability through a direct mechanism: a healthier herd needs fewer inputs per unit of milk. This section states the mechanism plainly rather than attaching an invented percentage to it, because no figure in the research brief quantifies feed or medical-cost savings from welfare improvements at a national level — that data, per current dairy-genetics research at institutions like the UW-Madison Dairy Innovation Hub, has not yet been published as a peer-reviewed national aggregate for 2024–2026.
What Is Actually Trackable On-Farm
- Housing and comfort: Clean, climate-adapted shelter is a documented driver of reduced stress-related illness; track your own veterinary-cost trend before and after a housing upgrade rather than citing an industry-wide figure.
- Early disease detection: Wearable sensors and AI-driven alerts reduce disease outbreaks and antibiotic use — the reduction is measurable per-herd through your own veterinary records.
- Balanced nutrition by production stage: Feed formulated to each animal’s stage avoids both under- and over-feeding, which shows up directly in your feed-cost ledger.
- Digital veterinary advisory: Tools available through the Farmonaut app suite support this kind of ongoing, farm-specific tracking rather than a one-time industry statistic.

4. Soil and Water Conservation
Rotational grazing, cover cropping, and buffer zones protect the water and soil resources that manure and runoff most directly threaten. Rotational grazing in particular is a documented trend in US dairy — extension programs from Wisconsin to Vermont actively promote it — but the research for this page did not surface a current USDA-published national adoption percentage for it. Rather than attach an estimate to that gap, the honest path is to check your state’s land-grant extension office (Penn State, UW-Madison, University of Vermont are three with active dairy-grazing programs) for regional adoption data, since grazing infrastructure and season length vary too much by climate for one national figure to mean much anyway.
Conservation Practices With Direct On-Farm Payoff
- Rotational grazing: Timed livestock movement prevents overgrazing and builds soil carbon over successive seasons — track pasture regrowth rate on your own fields as the practical measure.
- Cover cropping and green manure: Off-season planting reduces erosion and fixes nitrogen naturally, cutting fertilizer input costs.
- Precision irrigation: Drip and sensor-triggered systems reduce water applied per acre versus flood or unscheduled sprinkler irrigation — again, meter your own before-and-after rather than relying on an unsourced percentage.
- Buffer zones and riparian management: Vegetated strips along waterways filter runoff before it reaches streams, directly protecting the water-quality side of the manure-management equation covered above.
- Satellite-based field monitoring: The Farmonaut app tracks soil moisture and vegetation cover in real time, giving a way to time grazing rotations and irrigation without waiting on a manual field walk.

For farms that need to document carbon and emissions performance for a buyer, cooperative, or regulator, Farmonaut’s carbon footprinting solution provides satellite-measured tracking that can sit alongside the manure-management figures cited in this article, rather than replacing them.
5. Supporting Small and Mid-Size Dairy Operations
Herd density varies sharply by state, which changes how manure-management economics work at the operation level. Wisconsin alone counted 5,617 milking herds as of February 2024, per USDA NASS — a scale where cooperative digester or manure-hauling arrangements between neighboring smaller farms can make more financial sense than a single-farm system sized for a much larger herd. That NASS survey is updated on a running basis, so check it directly for the current herd count in your state rather than treating the February 2024 figure as fixed.
Practical Paths for Smaller Operations
- Digital advisory tools: Farmonaut’s data-driven advisory lowers the cost of field-specific monitoring that used to require dedicated agronomy staff.
- Satellite-verified financing: Farmonaut’s crop loan and insurance tools use satellite verification to support loan applications for infrastructure like manure storage upgrades, without requiring an in-person field survey for every application.
- Traceability for premium markets: Farmonaut’s blockchain traceability tools let smaller operations document sustainable practices for buyers or cooperatives that pay a premium for verified sourcing.
- Fleet and equipment management: Fleet management tools help smaller operations track machinery use and maintenance without a dedicated operations team.

Digester Payback Calculator
Since no national average payback period is published for dairy digesters, use your own herd size and local energy price to estimate the range — this tool scales EPA AgSTAR’s national emissions-reduction rate (4.29 million metric tons CO2e across 221 digesters) down to a per-cow estimate, then applies your inputs.
Run your own numbers
Assumptions: this estimates energy-value payback only — it excludes state or federal grants, carbon-credit revenue, nutrient-management labor savings, and financing costs, none of which have a standardized national figure published. Default values are placeholders for you to replace with a real quote and your own herd size; EPA AgSTAR (April 2021) is the source for the national digester count and emissions-reduction figures this tool is built around, not for the cost or energy-yield defaults, which you should replace with a vendor quote.
National Dairy Month and Regional Trends
National Dairy Month is observed each June in the United States, and industry groups and USDA-affiliated programs typically use the month to publicize dairy sustainability progress and farm-tour events; check USDA's own release calendar and your state dairy association for that period's specific programming rather than a fixed list, since participating organizations and events change from year to year.
Regional trends worth checking directly rather than assuming: dairy industry associations in states with concentrated dairy production — Wisconsin, New York, California, and provinces like New Brunswick in Canada — publish their own periodic reports on herd counts, manure-management adoption, and processing capacity. For New Brunswick specifically, Statistics Canada is the equivalent national authority to USDA NASS for Canadian dairy statistics, though the research available for this article did not include a specific New Brunswick figure to cite — check Statistics Canada's agriculture division directly for current provincial dairy data.
What Still Needs to Be Published
Being direct about data gaps is part of responsible reporting on this topic. Five figures that would strengthen any sustainable dairy industry analysis are not currently available as standardized national statistics:
- Rotational grazing adoption rate: The trend is well documented by extension services, but no recent USDA-published national percentage exists. Check your state land-grant extension office (Penn State, UW-Madison, University of Vermont) for regional data.
- Digester cost and payback: Feasibility studies exist per-project, but no standardized USDA average investment or payback figure has been published. Get a site-specific quote and use the calculator above with your own numbers.
- National water use per gallon of milk: Percentage-improvement claims circulate, but a solid US baseline in gallons-per-gallon lags behind international life-cycle-assessment standards. Meter your own operation for a defensible farm-specific figure.
- Sustainability certification rate: Data on what share of US dairy farms hold third-party sustainability or organic certification is fragmentary, with no unified USDA census. Check certifying bodies directly for their own farm counts.
- Feed-conversion efficiency gains from genetics: Research is ongoing at institutions including the UW-Madison Dairy Innovation Hub, but no peer-reviewed national aggregate for 2024–2026 has been published yet. Check that program directly for interim findings.
Any article that fills these five gaps with a specific percentage is citing something this research could not verify. Treat such numbers with caution until you can trace them to a named survey and year.

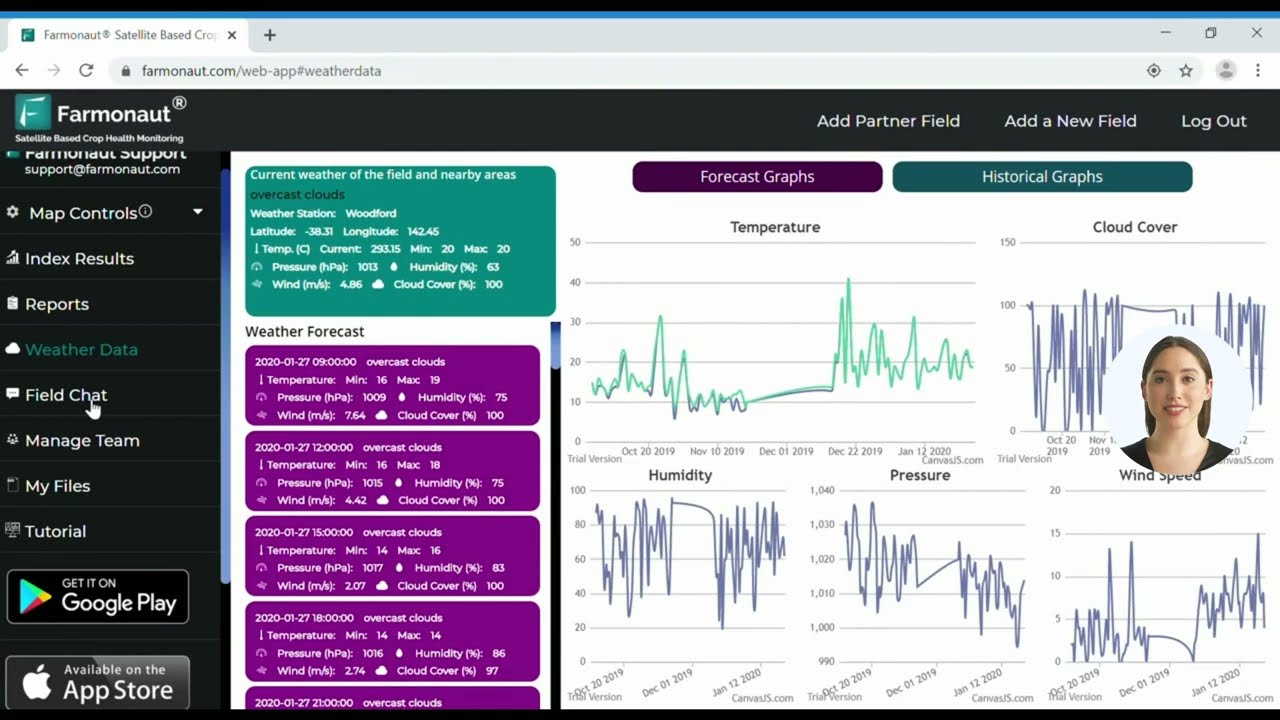
Technologies such as Farmonaut's satellite data APIs can help fill some of these gaps at the individual-farm level even where no national figure exists — a farm can measure its own water use, pasture regrowth, or field-level emissions proxy even while waiting for USDA or EPA to publish an updated national number.
How Farmonaut Fits Into Dairy Sustainability Tracking
Farmonaut's role in this picture is measurement, not manure-management itself: satellite imagery and AI analysis give a farm the field-level and operation-level data needed to document the practices covered above, at a cost accessible to operations smaller than the ones typically able to afford dedicated agronomy or sustainability staff. Specifically, the platform supports:
- Real-time satellite imagery and AI-powered analysis for field and crop monitoring relevant to pasture and feed-crop management.
- Farm-level emissions and environmental tracking that can sit alongside EPA and USDA figures cited in this article for a farm's own compliance or buyer reporting.
- Blockchain-based traceability for dairy supply chains that want to document sustainable sourcing for premium buyers.
- Fleet and machinery management to reduce operational costs tied to equipment use.
- Crop loans and insurance backed by satellite-verified field data rather than manual inspection alone.
For enterprise-scale operations managing multiple sites, the Farmonaut Large-Scale Farm Management tools extend this same measurement approach across a full operation. Developers building custom sustainability-tracking tools can start from Farmonaut's Developer Docs.
Frequently Asked Questions
What counts as responsible dairy farming?
Responsible dairy farming is measured through specific, checkable practices: manure management systems that capture or reduce methane (42% of US operations had adopted some form as of the 2017–2019 USDA ERS survey), operational anaerobic digesters (221 nationally as of April 2021, per EPA AgSTAR), and resource tracking that a farm can document with its own metered data. It is not a marketing label without a named practice, herd size, or data source behind it.
What is the most impactful sustainable dairy farming practice?
By verified emissions impact, anaerobic digestion is the most measured: EPA AgSTAR attributes a 4.29 million metric ton CO2-equivalent annual reduction to the 221 digesters operating on US dairy farms as of April 2021. Whether it's the most impactful practice for a specific farm depends on herd size and manure volume, which is why the calculator above uses your own numbers rather than a single national figure.
How many US dairy farms use anaerobic manure management?
42% of US dairy operations had adopted some form of anaerobic manure management system, based on USDA Economic Research Service's ARMS survey covering 2017–2019. That is the most recent published national rate; USDA ERS is the authority to check for an updated figure.
Is there a national dairy sustainability certification standard?
No single, unified USDA census tracks third-party sustainability or organic certification rates across US dairy farms — the data that exists is fragmentary and comes from individual certifying bodies rather than one government source. Check a specific certification program directly for its current farm count.
How can small and mid-size dairy farms adopt sustainable practices affordably?
Cooperative arrangements for manure handling, digital advisory tools, and satellite-verified financing lower the entry cost for smaller operations. Wisconsin's 5,617 milking herds as of February 2024 (USDA NASS) illustrate the scale at which shared infrastructure — rather than one system per farm — often makes more financial sense.
Farmonaut Subscription Options
Access subscription-based satellite monitoring and AI advisory tools sized to your operation, from a single field to a multi-site enterprise:
Further reading:
Conclusion: Measuring Responsible Dairy Farming Instead of Claiming It
The five practices ranked on this page — anaerobic digestion, resource efficiency, animal welfare monitoring, soil and water conservation, and support for smaller operations — hold up because each one traces to a named source: EPA AgSTAR's digester inventory, USDA ERS's manure-management survey, or USDA NASS's production and herd data. Where a figure doesn't exist yet, this page says so and names where to look, because that gap-naming is itself durable: USDA NASS, EPA AgSTAR, and USDA ERS all update their datasets on their own schedules, so the method for checking a current number outlasts any single figure printed here.
For dairy farms, cooperatives, and buyers evaluating a sustainable dairy industry claim, the practical test is simple: does the claim name a survey, a year, and a data source? If it doesn't, treat it the way this article treats its own gaps — as something to verify before repeating.
For ongoing monitoring, try Farmonaut's API services and developer docs to build sustainability tracking specific to your farm's manure management, resource use, and herd health data.
Discussion
Questions, corrections or field experience? Share them below. First-time comments are reviewed before they appear, and your email is never published.
No comments yet. Be the first to add a question or your experience.

 Croptimum
 Dalmia Bharat Sugar
 DnCubed
 Pistachio ST
 Field Capacity
 Indosistim Teknologi
 Liquify Digital
 CU Foods
 BeyondTech Global
 Rouge VC
 AgroGreen Dynamics
 AgroRisk
 Oath Inc
 Reddane Farming
 Esri North East Africa
 Cresol
 MDCV UK
 Etech Consulting Madagascar
 Vestlandsforsking

 Licence holder · Niger · Gold










