

Agriculture Technology Marketing Agency: 7 Proven Strategies
Reviewed August 2026 against USDA Economic Research Service and DEFRA (Agriculture in the United Kingdom).
Try it: Satellite monitoring ROI: what it returns on your acreage →
An agriculture technology marketing agency is a firm that combines agronomy-level sector knowledge with digital marketing execution—content, paid media, CRM, and field events—to get AgTech products past the trust barrier that stops most farmers from buying on a cold ad alone. If you searched “ag marketing agency,” “agtech marketing,” “agricultural marketing agency,” “acre agency agriculture marketing,” or “digital agency for agricultural technology,” the answer is the same: this is a specialist discipline, not a generalist skill, because farm buying cycles, subsidy timelines, and grower trust networks don’t behave like retail or SaaS.
The economics explain why specialization matters. US farmers keep just 11.8 cents of every dollar spent on domestically produced food, per USDA’s Economic Research Service (2024 data) — ERS Chart of Note. Margins that thin mean a farm operator has almost no room to gamble on unproven technology, and generic ad copy that doesn’t speak to that reality gets ignored. The rest of this piece covers what the specialist services actually look like, what adoption data exists for the US and UK, seven strategies for reaching that audience, and a calculator for estimating your own cost-per-qualified-lead.
- What Is an Agriculture Technology Marketing Agency?
- How Fast Is AgTech Actually Being Adopted? (US & UK Data)
- Key Services: What an Agtech Marketing Agency Actually Does
- 7 Strategies for Agriculture Technology Marketing
- Strategy Comparison Table
- Calculator: Cost Per Qualified Farm Lead
- How Farmonaut’s Own Satellite Platform Fits This Market
- How to Choose an Agriculture Marketing Agency: A Checklist
- Frequently Asked Questions
- Conclusion
- Try it: Satellite monitoring ROI: what it returns on your acreage
What Is an Agriculture Technology Marketing Agency?
A marketing agency specializing in agricultural technology promotes, explains, and drives adoption of precision-ag, drone, sensor, and farm-software products. The distinction from a generalist agency is not stylistic — it shows up in three concrete ways:
- Buying-cycle awareness: campaigns are timed to planting, input-purchase, and harvest windows, not to arbitrary quarterly calendars.
- Segment literacy: a large-scale grain operation and a mid-size fruit-and-vegetable farm buy technology for different reasons and at different price sensitivity — see the autosteer adoption gap below.
- Trust-building over lead-gen: AgTech sales cycles run longer than SaaS or retail because equipment and subscription costs compete against thin farm margins.
This is the same specialization covered in this agritech digital marketing agency breakdown and in our agricultural marketing growth guide — both worth reading alongside this one if you’re evaluating agencies rather than building an in-house team.

Who the End-Buyers Actually Are
US farm business net cash income averaged $112,900 in 2024, against a sector-wide net farm income forecast of $140.7 billion, per USDA ERS — Farm Business Income data. That average masks a wide split between:
- Large-scale commercial operations, where 70% already run guidance autosteering systems (USDA ERS, 2023).
- Midsize crop farms, where autosteer adoption sits at 52% — a 18-point gap that changes what a campaign needs to prove before a purchase.
- UK farms, where DEFRA’s Agriculture in the United Kingdom 2025 report recorded 0.9% total factor productivity growth and a 2.7% rise in crop output volume for 2024–2025 — DEFRA statistics.
How Fast Is AgTech Actually Being Adopted? (US & UK Data)
This is the number every agtech marketer needs and most guess at: only 27% of US farms used precision agriculture practices as of 2023, per USDA ERS. That means 73% of the addressable US market has not adopted — which is either the size of your opportunity or the size of the trust gap you have to close, depending on which side of the sale you’re on.
On the UK side, DEFRA doesn’t publish a directly comparable precision-ag adoption percentage in its 2025 report, but it does confirm the sector is growing output (crop output volume +2.7% in 2024–2025) faster than productivity (TFP +0.9%) — meaning UK farms are producing more largely through area and input growth, not efficiency gains yet, which is exactly the argument an agtech marketer should be making to DEFRA-adjacent buyers. For Australian equivalents, ABARES does not publish a directly comparable adoption percentage either; check the current release list at abares.gov.au yourself before quoting a figure, since none is confirmed in the sources reviewed for this piece.
On marketing-specific ROI: there is no government-published benchmark for email, paid search, or CRM ROI in farm-supply marketing from USDA, DEFRA, or ABARES — these agencies track production and income, not vendor marketing spend. Two figures do exist from peer-reviewed and industry research: farms with an active social media presence saw a 45% brand-awareness lift (American Farm Bureau Federation, 2024), and agriculture brands saw Instagram engagement rates grow 38% in 2024, per a peer-reviewed study in Frontiers in Sustainable Food Systems. Treat these as directional, not a substitute for tracking your own campaign data — the durable method is in the checklist under “How to Choose an Agriculture Marketing Agency” below.
Key Services: What an Agtech Marketing Agency Actually Does
Whether you’re searching “agritech marketing agency” or “farm marketing agency,” the service menu across specialist firms converges on six core lines:
- Market Research & Segmentation: identifying adoption barriers by farm size, crop type, and region — the 52%-vs-70% autosteer gap above is the kind of data point that should shape a campaign brief.
- Content Marketing & Thought Leadership: blogs, whitepapers, webinars, and video that translate technical capability into farm-economics language.
- Digital Advertising & Media Buying: targeted placement across Facebook, YouTube, and LinkedIn, including specialist media buying services for reaching niche agricultural audiences at scale.
- Field Demonstrations & Hybrid Events: demo days and trade shows, increasingly paired with livestream components for the audience that can’t travel.
- Influencer & Community Marketing: working through progressive farmers, extension officers, and cooperative leaders — the trust intermediaries who outperform any ad in a market where 27% adoption means most buyers are still watching their neighbors before they act.
- Data Analytics & CRM Integration: tracking engagement through the full farm buying cycle rather than a single-touch conversion.
Why Digital-First Still Needs a Local Layer
Rural connectivity gaps mean digital-only strategies underperform in some regions even where smartphone penetration looks strong on paper — video and mobile alerts still need a field-demo or cooperative-meeting layer behind them to convert skeptical buyers, which is why the strategy list below keeps both channels rather than picking one.

7 Strategies for Agriculture Technology Marketing
1. Precision Market Research & Hyper-Segmentation
Every effective agritech marketing program starts by mapping adoption readiness against real gaps — the 27% precision-ag adoption rate and the 52%/70% midsize-vs-large autosteer split are the exact kind of segmentation input that should set campaign priority, not a generic “farmers” persona. A midsize operation sitting below the 52% mark is a fundamentally different lead than a large operation already at 70% and shopping for the next upgrade.

2. Educational Content Marketing & Thought Leadership
With farm margins as thin as the 11.8-cents-per-dollar figure above, content that explains payback period and input savings in dollar terms outperforms feature lists. Effective agencies build blogs, whitepapers, and video around cost concerns, data-privacy questions, and complexity — the actual objections that stall a 27%-adoption market from becoming a 50%-adoption market.
3. Digital Advertising & Social Media Campaigns
This is where the two engagement figures matter directly: the 45% brand-awareness lift and 38% Instagram engagement growth cited above are the closest thing to a channel benchmark currently published for this sector. Retargeting and native-language video ads convert interest into trial, particularly across Facebook, YouTube, and LinkedIn.



Farmonaut’s satellite-powered platform is accessible via Android, iOS, and the web, making it a low-friction entry point for farms at any adoption stage. Try it via web or mobile.
4. Experiential Field Demonstrations & Hybrid Events
Demo days remain the highest-trust conversion channel precisely because 73% of US farms have not yet adopted precision agriculture — most buyers are still first-time evaluators, not repeat purchasers, and peer validation at a live demo closes that gap faster than any ad sequence.
5. Community & Influencer Marketing
Progressive farmers, extension officers, and cooperative leaders drive adoption in markets where trust in new technology is the primary barrier — not awareness. Agencies that identify and equip these intermediaries see the word-of-mouth effect compound faster than paid reach alone.
6. Data Analytics, CRM & Personalization
CRM systems track every farmer touchpoint from first click to purchase decision, timed against the planting and input-purchase windows that actually drive farm buying — not a generic sales calendar.
Developer note: agencies and AgTech vendors can integrate Farmonaut’s satellite and weather datasets directly into client tools via the Farmonaut API, with technical details in the API Developer Docs.
7. Integrated Compliance & Sustainability Communication
UK crop output volume grew 2.7% in 2024–2025 while productivity grew only 0.9% (DEFRA), meaning compliance and sustainability reporting requirements are tightening even as farms scale mostly through area rather than efficiency — a gap that carbon-tracking and traceability tools are built to close. Example: Farmonaut’s carbon footprint tracking solution provides real-time emissions data supporting climate-compliance reporting.

Strategy Comparison Table
The adoption and ROI figures in the columns below are directional estimates used for internal agency prioritization, not government-published benchmarks — no US, UK, or Australian statistics agency currently tracks marketing-channel ROI for farm-supply businesses (see the Gaps note above). Use this table to compare relative emphasis, and validate real ROI against your own campaign data using the calculator further down.
| Strategy | Primary Channel Focus | Farmer Trust Impact | Best Fit For |
|---|---|---|---|
| Precision Market Research & Segmentation | AI, Data Analytics | High | New-market entry, product-market fit |
| Educational Content Marketing | Content, SEO, Video | High | Long sales cycles, complex products |
| Digital Advertising & Social Campaigns | Social, Mobile, Video | Medium-High | Awareness and retargeting at scale |
| Field Demonstrations & Hybrid Events | IoT, Drones, Sensors | High | First-time buyers, skeptical segments |
| Community & Influencer Marketing | Local Influencers | High | Cooperative and extension-driven markets |
| Data Analytics, CRM & Personalization | CRM, AI, Automation | Medium-High | Repeat buyers, upsell/renewal |
| Compliance & Sustainability Communication | Carbon, Traceability | Medium | Regulated markets, export supply chains |
Calculator: Cost Per Qualified Farm Lead
Given how thin farm margins are — 11.8 cents per food dollar reaches the US farm, per USDA ERS — every agtech marketing dollar has to be justified against a real cost-per-lead, not a vanity impression count. Enter your own campaign numbers below to see what you’re actually paying per qualified farm lead and per adopted customer.
Satellite monitoring ROI: what it returns on your acreage
Change any figure. Nothing is pre-assumed about your farm.
Your inputs only — this tool contains no benchmark yield or price data. Use your own last-season figures, and treat any vendor’s yield-gain percentage as unproven until they show you two contrasting seasons.
Assumptions: this model treats engagement, qualification, and close rates as independent monthly percentages and does not account for multi-touch attribution, seasonal buying windows, or lead decay over time. It excludes offline channels like field demos and cooperative referrals, which typically carry different (often lower) acquisition costs than paid digital reach. Use it to compare your own channels against each other, not as an industry benchmark.
How Farmonaut’s Own Satellite Platform Fits This Market
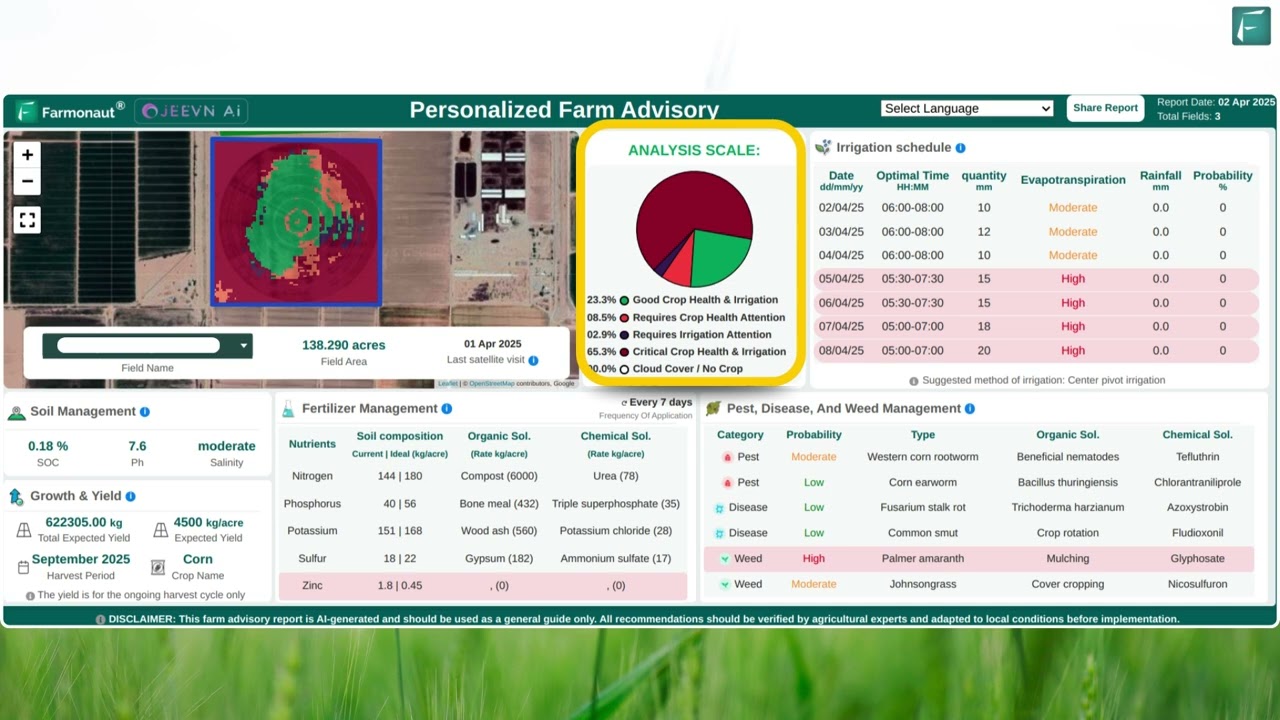
Farmonaut is itself an AgTech product operating in the market this article describes — satellite-based, AI-driven farm management sold into the same 27%-adoption landscape covered above. Its own product set illustrates the categories an agtech marketing agency has to position and explain:
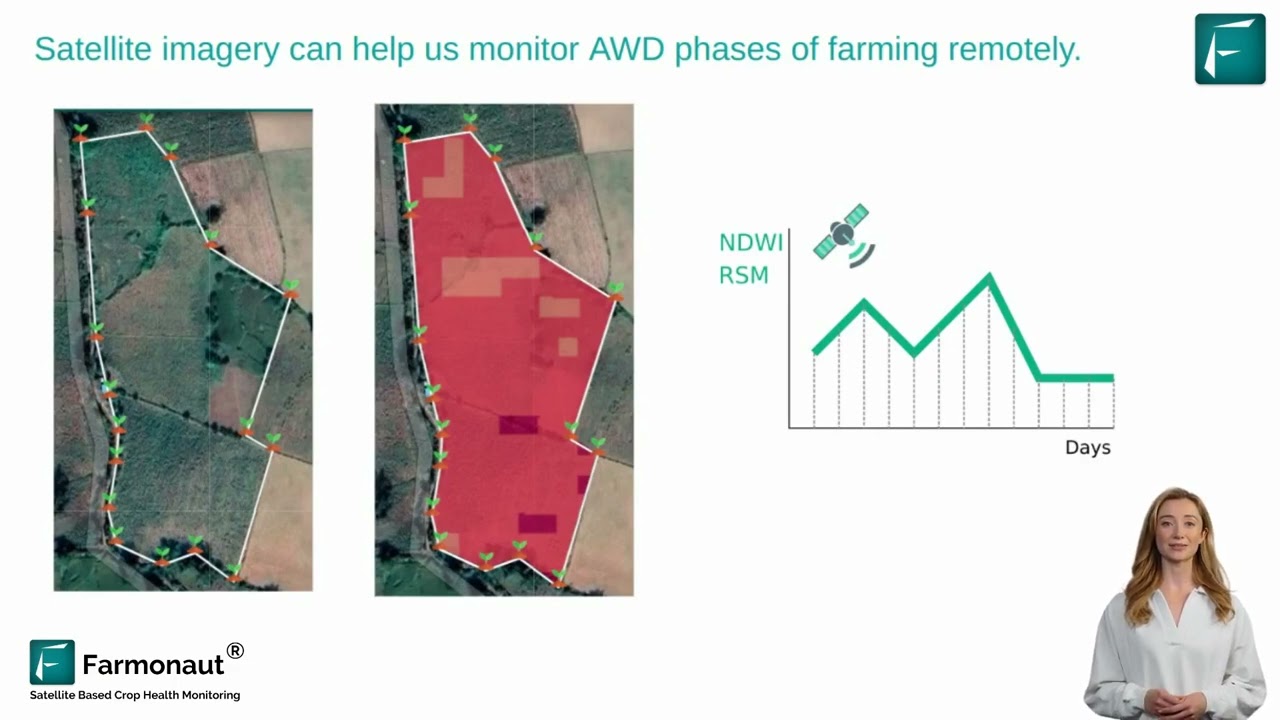
- Satellite-based Crop Health Monitoring: multispectral imagery and NDVI monitoring for irrigation, fertilizer, and pest management decisions.
- Jeevn AI Advisory System: personalized, farm-specific forecasts and recommendations.
- Product Traceability: farm-to-table tracking for supply-chain transparency. Explore the traceability product
- Fleet Management: logistics optimization for large-scale operations. Learn more
- Carbon Footprinting: real-time emissions tracking for compliance reporting. Carbon strategy details
- Crop Loan & Insurance Support: satellite-based verification for financial institutions. Risk solutions
- Large-Scale Farm Management for Agencies: tools for government and institutional plantation monitoring. See large-scale solutions

How to Choose an Agriculture Marketing Agency: A Checklist
Because government adoption and ROI figures for this sector update on their own schedules (USDA ERS revises farm income forecasts multiple times a year; DEFRA’s UK report is annual), the durable question is not “what’s the current number” but “does this agency know how to find it and act on it.” Use this checklist with any agriculture technology vendor you’re evaluating:
- Do they cite primary sources? An agency that references USDA ERS, DEFRA, or ABARES data directly — rather than secondary market-research estimates — is tracking the same figures you’d verify yourself.
- Can they segment by adoption stage, not just farm size? The 52%-vs-70% autosteer gap between midsize and large farms shows adoption stage matters more than acreage alone.
- Do they have a field-demo or community layer, not just digital? In a market where 73% of US farms haven’t adopted precision ag, pure-digital campaigns underperform against hybrid ones.
- Do they track cost-per-qualified-lead, not just impressions? Use the calculator above as a template for what you should be asking your agency to report monthly.
- Do they update messaging against current compliance and subsidy rules? Regional programmes change; an agency working from stale regulatory copy will misfire in export or compliance-driven segments.
Frequently Asked Questions
What distinguishes an agriculture technology marketing agency from a generalist digital agency?
Sector-specific expertise in farm buying cycles, adoption barriers, and trust-building channels like field demos and cooperative influence — none of which a generalist agency builds by default. The 27% US precision-ag adoption rate (USDA ERS, 2023) means most of the market still needs to be convinced, not just reached.
What types of clients benefit most from specialized agritech marketing agencies?
Technology startups, established agribusinesses, supply-chain companies, government programs, agricultural research organizations, and NGOs — anyone trying to move a farm audience past the trust barrier that keeps adoption below the 50% mark documented above.
How can farmers and cooperatives use Farmonaut’s solutions?
Real-time crop health monitoring, weather risk advisory, satellite-based pest alerts, and traceability tools, accessible via mobile, web, or API for smarter resource decisions and improved access to finance.
Is it possible for developers to build their own apps using Farmonaut’s data?
Yes — developers and agencies can access satellite and weather data via the API portal or the developer documentation.
Is there a published benchmark for agricultural marketing ROI by channel?
No — USDA, DEFRA, and ABARES publish farm income and productivity data, not marketing-channel ROI for farm-supply or ag-service businesses. Track your own cost-per-lead using a model like the calculator above, and treat industry figures such as the 45% brand-awareness lift (American Farm Bureau Federation, 2024) as directional context, not a guarantee for your campaign.
How do marketing strategies adapt to new government regulations and subsidies?
Specialist agencies monitor regulatory changes and update campaign messaging accordingly, integrating compliance and incentive information into outreach for new agricultural technology adoption. Check DEFRA’s annual UK report and USDA ERS’s Farm Business Income page directly for the current period’s figures before building campaign copy around them.
Conclusion
The demand for a specialized agriculture technology marketing agency tracks directly against the adoption gap in the data: 27% of US farms use precision agriculture, per USDA ERS 2023 figures, which means the majority of the addressable market is still deciding. Closing that gap takes the same six services and seven strategies covered here — segmentation grounded in real adoption data, education-first content, digital campaigns benchmarked against actual engagement figures, field demos for trust-building, community influence, CRM-driven personalization, and compliance communication tied to real regulatory cycles like DEFRA’s annual UK report.
- Precision market research keyed to documented adoption gaps (52% midsize vs. 70% large-farm autosteer) outperforms generic farmer personas.
- Content and community influence close the trust gap that thin farm margins (11.8 cents per food dollar) make unavoidable.
- CRM-driven, hybrid digital-and-field campaigns are measurable — track cost-per-qualified-lead, not impressions.
- Compliance and sustainability tools like Farmonaut’s carbon footprinting and fleet management are now part of the product story, not just the marketing story.
Whether you’re a technology vendor, an agribusiness, or a government program, the durable approach is the same: verify your figures against USDA ERS, DEFRA, or ABARES directly, segment by actual adoption stage, and measure cost-per-lead rather than reach alone.
Explore the Farmonaut platform, or use the checklist above to evaluate your next agriculture technology marketing agency.
Discussion
Questions, corrections or field experience? Share them below. First-time comments are reviewed before they appear, and your email is never published.
No comments yet. Be the first to add a question or your experience.

 KJBN Labs
 SFX
SFX BACF Africa
 Doodlakine
 Exurbia Geospatial
 FieldZero
 Indico Company
 Kubota
 FFBS
FFBS Jontra
 Tucor
Tucor
