

Soil testing · Practical guide
Agronomic Soil Testing: How to Sample, Test and Read Results
A good soil test starts with the sample. Take 10 to 20 cores per composite sample, to one depth, and retest every 2 to 4 years. No independent ranking of soil testers exists, so choose a lab that takes part in proficiency testing.
Key takeaways
- Sampling is the largest source of error in soil testing (Iowa State, 2003). Take 10 to 20 cores per composite sample, all to the same depth.
- Purdue Extension (2018) advises one composite per 20 acres for whole-field sampling, zones of 2 to 10 acres, and grid cells of 1 to 5 acres. Smaller areas cost more.
- Iowa State suggests retesting every 2 to 4 years or once per rotation, and Purdue every 4 years, or every 2 on sandy or highly managed soils (2003; 2018).
- Choose a lab in a proficiency program such as NAPT. In a CIAT test (CGIAR), low-cost NPK probes gave weak results for fertilizer decisions.
- Most agronomic crops do best at pH 6.0 to 6.5, alfalfa at 6.6 to 7.0 and potato near 5.2 (University of Maryland, 1997). Test before you lime.
In this article
- Summary: The Importance of Agronomic Soil Testing in Modern Agriculture – A Perspective
- Understanding Basic Soil Testing: The Foundation
- Agricultural Soil Testing: A Cornerstone of Productivity
- Core Steps in Agronomic Soil Testing – The Methodology
- Assessing Agriculture Land Soil Test Results: Actionable Insights for Management
- Choosing a Soil Testing Method: What Matters Most?
- Comparison Table: Agricultural Soil Testing Methods Compared
- Farmonaut & Digital Soil Health Monitoring: Enabling Smart, Sustainable Decisions
- Future Trends in Agronomic Soil Testing: Digital, Smart & Sustainable
- Soil Health & Sustainability Support Tools
- Farmonaut Subscriptions: Affordable Access to Digital Soil Data
- FAQ: Agronomic Soil Testing
- Conclusion: Shaping the Future of Agriculture with Superior Soil Testing
Summary: The Importance of Agronomic Soil Testing in Modern Agriculture – A Perspective
Agronomic soil testing has rapidly evolved as a cornerstone of modern, precision farming. In 2025, with the growing global demand for food and the urgent need to preserve our environmental resources, sustainable agricultural practices are pivotal. By enabling farmers and agronomists to optimize crop productivity, conserve inputs, and nurture long-term soil fertility, digital agricultural soil test methods have moved front and center in global food production strategies.
This article explores the fundamentals, advanced applications, and how to choose a testing method. We also highlight how digital innovation and platforms like Farmonaut are changing both large-scale and smallholder farming across the globe.
Understanding Basic Soil Testing: The Foundation
A basic soil test is the most fundamental analytical process for any agriculture land soil test. At its core, it involves analyzing a soil sample to determine:
- Nutrient content (macronutrients and micronutrients)
- pH level (acidity or alkalinity of the soil)
- Texture (percentage of sand, silt, and clay)
- Presence of contaminants (heavy metals, pesticides, etc.)
Agricultural basic soil tests typically measure the main macronutrients plants need, known as NPK – nitrogen (N), phosphorus (P), and potassium (K). Tests may also reveal secondary nutrients (such as calcium, magnesium, and sulfur) and vital micronutrients (like iron, zinc, copper, manganese, and boron) needed in smaller amounts but essential for growth.
This simple yet powerful process provides critical data for informed decisions on fertilization strategies, crop rotation, and land management. By testing different areas of a field, farmers and agronomists can spot variations, identify deficiencies, and develop precise, site-specific management strategies, a hallmark of good agronomic soil testing practice.
Three ways to sample a field
Soil sampling is the largest source of error in soil testing, so the plan matters as much as the lab (Iowa State Extension, 2003). Three plans are common. Whole-field sampling treats the field as one unit. Purdue Extension advises at least one composite sample per 20 acres, with 10 to 20 subsamples in each composite (2018). Zone sampling takes one composite from each area that behaves alike, such as one soil type or one yield-map pattern, and Purdue puts most zones at 2 to 10 acres. Grid sampling uses a regular pattern, usually 1 to 5 acres per cell, and cells of 2.5 acres or less work best. Purdue rates grid sampling above whole-field sampling but below zone sampling, because grid points ignore soil types and can over-sample one soil. Iowa State suggests no fewer than one sample per 2.5 acres on a grid, and warns that costs rise as cells get smaller.
The chart shows how many acres one composite sample covers. The calculator turns these rules into sample counts and costs for your field.
Chart
Acres covered by one composite sample
Acres per sample, by sampling plan
Try the numbers for your own farm below.
Calculator
How many samples will my field need, and what will they cost?
Enter your own field size, sampling density and fees.
- Whole field: samples: 8
- Whole field: cost per acre: $1.00 per acre
- Zone: samples: 16
- Zone: total cost: $320
- Zone: cost per acre: $2.00 per acre
- Grid: samples: 64
- Grid: cost per acre: $8.00 per acre
- Grid: cost per hectare: $19.77 per ha
- Grid: cores to collect: 640 cores
Example values only, not a benchmark. Sample density rules follow Purdue Extension AY-368 (2018): at least one composite per 20 acres for whole-field sampling, zones of 2 to 10 acres, grid cells of 1 to 5 acres. Lab fee and collection cost are your own inputs; 2026 university price pages showed about $10 to $66 per sample for basic nutrient tests; soil-health packages cost more. Zone maps and GPS work cost extra and are not included. Counts are rounded to whole samples, so round up when you plan. One hectare is 2.47105 acres.
Agricultural Soil Testing: A Cornerstone of Productivity
Agricultural soil testing moves beyond the basic to integrate advanced laboratory analysis and digital tools for a comprehensive view of soil fertility. This involves both:
- Conventional laboratory methods (wet chemistry, extraction, spectrometry etc.)
- On-site digital sensors and rapid NIRS (near-infrared spectroscopy) analysis
- DNA-based microbial assessments for mapping living soil biodiversity
Such agronomic soil testing enables:
- Identification of nutrient deficiencies and toxicity risks
- Assessment of soil structure, texture and compaction issues
- Highlighting threats such as salinization, contamination, and pH imbalance
With these insights, precision fertilization is achievable. This minimizes nutrient overuse, which is vital to reducing environmental impacts like runoff and groundwater contamination. By matching “what’s in the soil” with “what the crop needs,” input waste can be reduced, and sustainable soil health is supported.
Agricultural soil testing is especially pivotal today in both large-scale and smallholder operations, democratizing access to actionable data and practices for all farmers.
Looking for automated soil monitoring or need programmatic access?
Use the Farmonaut Satellite Data API for environmental monitoring, or consult our Developer API Docs for integration ideas.
Core Steps in Agronomic Soil Testing – The Methodology
-
Soil Sampling:
- Sample soil at multiple locations/depths for representative analysis (Iowa State uses a 6 inch or 15 cm sample for P, K and pH advice, and Purdue uses 0–8 inches or 20 cm for fertility tests; use the depth your lab and local extension service name).
- Clean equipment between samples to avoid cross-contamination.
-
Testing in a laboratory or with a calibrated field tool:
- Utilize portable digital soil testers, NIRS sensors, or laboratory services for comprehensive analysis.
- Test for pH, electrical conductivity, organic matter, N, P, K, micronutrients, soil moisture, microbial activity, and possible contaminants.
-
Data Analysis & Interpretation:
- Use digital platforms or agronomists’ recommendations to interpret results and diagnose core issues affecting crop yield and soil health.
-
Management Decision-Making:
- Create precise, field-specific fertilization, irrigation, crop rotation, or amendment plans based on findings.
- Deploy adjustment over time as further monitoring reveals changing conditions.
-
Integration with Digital Solutions:
- Automated data collection via IoT/probes, satellite insights (for cover/texture), and app-based records streamline the process.
Depth, cores and timing
Take every core in a field to the same depth, and use that depth each year. Iowa State bases advice on a 6 inch sample, and suggests the top 2 to 3 inches to track surface pH in no-till fields (2003). Purdue uses 0 to 8 inches for fertility tests and 0 to 4 inches for pH and lime advice under conservation tillage (2018). Arizona Extension lists 12 inches for vegetables and 24 inches for crops such as corn and wheat, because depth follows root depth (2025). Iowa State asks for at least 10 to 12 cores per sample, 15 to 20 for a better average of the area, and at least 20 where fertilizer was banded. Skip end rows, wet spots, eroded patches and ground within 100 feet (30 m) of a road. Sample before fertilizer or lime goes on, in the same season each year, and send samples to the same lab so changes in results reflect the soil and not the method (Purdue, 2018).
Chart
Sample depth depends on the purpose
Inches of soil per core, by guidance source
Assessing Agriculture Land Soil Test Results: Actionable Insights for Management
Interpreting a modern agriculture land soil test result involves several critical parameters, each influencing plant health and yield in unique ways. Here are some fundamental points:
-
pH Level:
Affects nutrient availability (e.g., low pH can “lock out” phosphorus); most agronomic crops do best at pH 6.0–6.5, though some crops differ. Amend with lime or sulfur-based on soil test. -
Nitrogen (N):
Key for leafy, vegetative growth. Deficiency limits yield, while an excess can cause environmental runoff. -
Phosphorus (P):
Vital for root and fruit development. Deficiency is common in acidic soils. -
Potassium (K):
Regulates water use and improves disease resistance. -
Secondary Nutrients:
(Calcium, magnesium, sulfur) – shape soil structure and support core plant physiology. -
Micronutrients:
(Boron, zinc, copper, others) – low levels can dramatically affect certain crops. -
Soil Texture:
(Sand, silt, clay proportion)% – guides irrigation and drainage; affects how quickly nutrients leach or get retained. -
Organic Matter and Microbial Activity:
Supports sustainable soil health and resilience under intensive agriculture.
Modern digital soil test apps and platforms provide field-specific, real-time interpretations and action plans, helping even smallholders with AI-powered insights for yield optimization and cost-reduction. For instance, our Farmonaut platform uses satellite, AI, and mobile data so users can visually track changes, receive recommendations, and support better fertilizer, irrigation, and crop selection decisions.
Soil pH and lime
University of Maryland Extension says most agronomic crops grow best at pH 6.0 to 6.5, alfalfa at 6.6 to 7.0, and potato near 5.2 (1997). A 2022 Maryland Extension article adds that phosphate is most available between pH 5.5 and 6.5, and that above and below this range it binds to calcium or to aluminum and iron. Soils can be over-limed as easily as under-limed, and both lower yields. Test first, then lime at the rate your lab advises.
Chart
Target soil pH used for lime advice
Target pH in Maryland lime tables, by crop group
Choosing a Soil Testing Method: What Matters Most?
The demand for rapid, accurate soil testing has driven an innovation surge in both portable sensors and automated laboratory integrations. The soil testing options that work well share several critical features:
- On-site Analysis: Hand-held NIRS and sensor-based devices give quick readings without a lab queue. Check them against laboratory results first, because accuracy depends on calibration and soil moisture.
- Comprehensive Parameters: Ability to measure basic NPK, micronutrients, pH, moisture, organic matter, CEC, salinity, heavy metals, and biological activity.
- Speed and Convenience: Handheld testers can give a reading in minutes, and timing varies by device.
- Integration: Sync data with farm management apps, IoT networks, or API for continuous monitoring and advanced analysis.
- Cost-Effectiveness: Reduce costs by minimizing unnecessary fertilizer application and repeated sampling.
The integration of the Internet of Things (IoT) facilitates dynamic soil health monitoring and triggers early warnings for stress or nutrient deficiency. This approach enables sustainable management, improved yield, and cost efficiency across the board.
Explore Farmonaut Fleet Management solutions to supercharge resource scheduling, track devices, and optimize logistics across your entire agricultural operation.
No independent ranking of soil testers
We found no independent ranking of soil testers, so this guide does not name a best one. Two checks help instead. First, ask whether the lab takes part in proficiency testing. The Soil Science Society of America has run the North American Proficiency Testing (NAPT) program since 1998, with quarterly sample exchanges (SSSA). The USDA NRCS nutrient management standard asks for soil tests from labs that meet NAPT or an approved state program (Standard 590, January 2011 version). FAO runs a similar network, GLOSOLAN, for labs worldwide. Second, check any handheld tool against lab results. In a CIAT test for CGIAR of three low-cost NPK probes on 63 soils, adjusted R-squared for phosphorus and nitrogen generally ran from 0.05 to 0.48, and readings changed with soil moisture. The authors do not recommend the probes for fertilizer decisions. A 2022 study in Sensors found that organic carbon predicted from portable spectrometers was as repeatable as the lab method on 75 finely ground samples, once the models were calibrated to lab data.
Comparison Table: Agricultural Soil Testing Methods Compared
| Testing Method / Device | Technology Used | Main Parameters Analyzed | Accuracy note | Time Required | Cost Estimate (USD) | Suitability |
|---|---|---|---|---|---|---|
| Traditional Laboratory Wet Chemistry | Manual (lab-based, reagents) | pH, N, P, K, micronutrients, organic matter | Reference method; labs check quality through proficiency testing | Days to weeks, by lab (4–5 weeks at one university lab) | From about $10 (Utah State) to $66–73 (Oregon State) per sample for basic nutrient packages; soil-health packages cost more (2026 lab fee pages) | All scales, research |
| Portable NIRS Analyzer (2025) | Digital (Near-infrared Spectroscopy) | pH, NPK, moisture, organic matter, CEC, micronutrients | Depends on calibration to lab data; best shown for organic carbon | Minutes per reading | Device price varies by maker | Farms, extension, consultants |
| IoT Smart Soil Sensor Network | Sensor array + mobile/web dashboard | Moisture, pH, EC, temperature, NPK (in some models) | Shows trends only; low-cost NPK probes scored poorly in a CIAT test | Real-time | Varies by sensor and network size | Large farms, research, continuous monitoring |
| Satellite-Based Soil Analysis (e.g., Farmonaut) | Remote sensing (multispectral satellite, AI) | Soil moisture, texture, organic carbon, health indices | Indirect estimate; not a replacement for a lab test | Minutes (cloud delivery) | Plans from $4.99/month (Farmonaut pricing page, 2026) | Large farms, region-scale, governments |
| DNA-Based Microbial Assessment | Sequencing analysis (lab) | Microbial diversity, pathogen/beneficials | Not rated here; not a routine fertilizer test | 48–72 hours | Varies by lab | Research, advanced soil health |
| Colorimetric Test Strips (DIY) | Manual (chemical reaction) | pH, N, P, K (basic) | Not rated here; use only as a rough check | Minutes | Low cost per strip | Home gardens, hobbyists |
Figures without a published source were replaced with short notes. Prices come from lab and plan pages read in 2026 – consult device specifications or platforms like Farmonaut for updated features.
What lab tests cost
The table had no published source for its cost and accuracy ranges, so we replaced them with notes and the fees below. Fees depend on the package. In 2026 Utah State charged $10 for Olsen phosphorus plus potassium (price list), the La Crosse County office of University of Wisconsin Extension listed $11 for a routine field-crop test plus $3 shipping, and the Oregon State Soil Health Lab listed $66 per sample for a basic nutrient package of 1 to 15 samples, plus $7 for preparation. Oregon State quotes 4 to 5 weeks for typical grower submissions, so book early. Compare what each package includes before you compare prices.
Chart
Lab fees per sample vary by package
US dollars per sample, selected university labs; prep and shipping fees extra
Farmonaut & Digital Soil Health Monitoring: Enabling Smart, Sustainable Decisions
We at Farmonaut are dedicated to making satellite and AI-driven soil insights affordable and accessible for farms of every scale, governments, and businesses worldwide. Our platform harnesses multispectral satellite imagery, AI models, and cloud-powered dashboards to monitor crop vigor, soil moisture, and key soil parameters across vast and varied agricultural landscapes.
- Real-Time Monitoring: Track soil texture, organic carbon, and vegetation health for any geo-location, directly in our Web, Android, and iOS Apps.
- AI-Based Recommendations: Our Farmonaut Satellite + AI advisory gives tailored, site-specific crop and resource strategies, maximizing productivity and reducing waste.
- Environmental Impact: Carbon footprinting and soil quality indicators help users adopt sustainable practices; consult our carbon footprinting tool.
- Blockchain Traceability Integration: Our system enables digital tracking of soil and yield data for end-to-end transparency;see traceability product details.
- Fleet & Resource Management: Monitor and optimize machinery, vehicles, and assets for reduced costs and higher efficiency (Fleet Management details).
Access all core features via web or mobile:
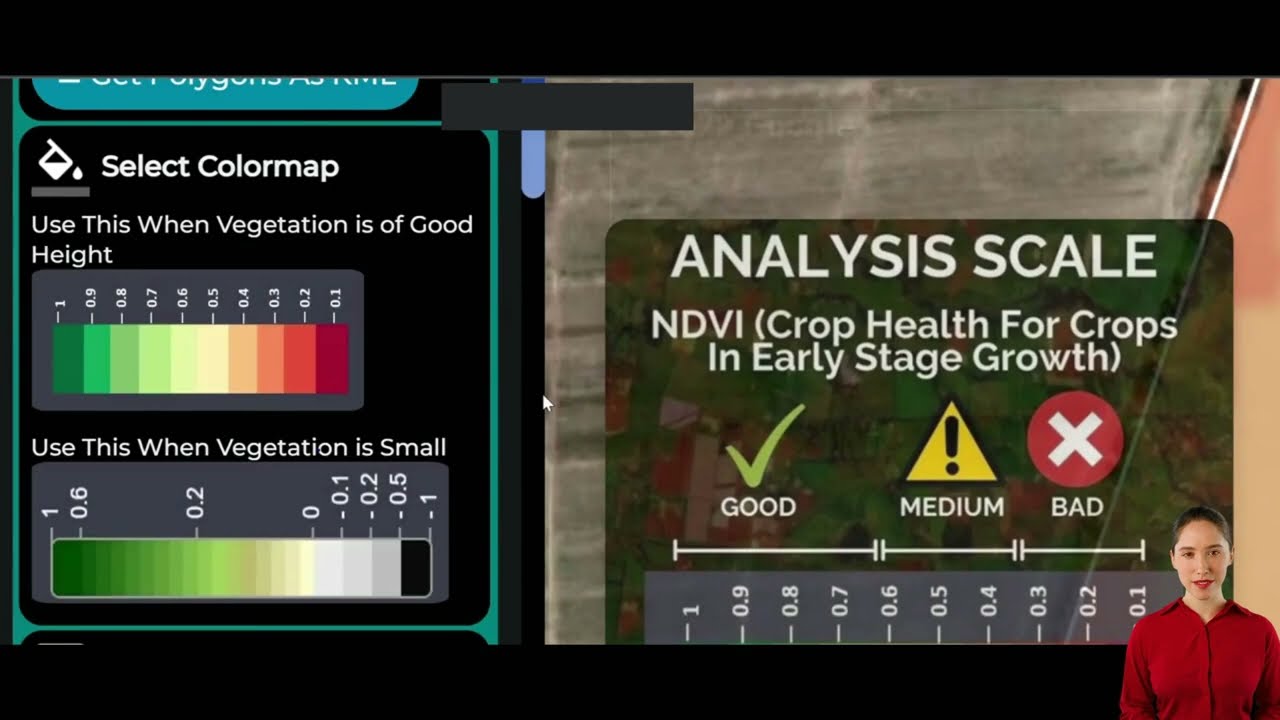
▶ Walk-through of the Farmonaut web app, including the soil health view (recorded 2024) · 10:16
Future Trends in Agronomic Soil Testing: Digital, Smart & Sustainable
By 2025 and beyond, the pace of digital transformation in agronomic soil testing will continue accelerating. The following trends are emerging as big improvements:
-
AI-Driven Analytics:
Predictive models will analyze vast agri-ecosystem datasets—from lab results and IoT sensor feeds to drone imagery—to provide adaptive recommendations and “what-if” scenario planning. -
Remote Sensing Integration:
Satellite and drone images will be further enhanced by AI to estimate parameters like soil organic carbon, texture shifts, moisture, and compaction at local and regional scales. -
Microbial & Carbon Health:
Measuring soil microbial diversity and carbon stocks is increasingly crucial for monitoring sustainability, climate resilience, and eligibility for carbon markets. Explore our carbon footprinting platform for more info. -
Quick-Action Mobile Apps:
Smart apps will convert test results into specific, GPS-guided application maps for fertilizer and irrigation, directly interfacing with variable rate machinery. -
Blockchain Traceability:
Transparency tools will connect soil health, carbon, and yield data directly to supply chains, using secure, blockchain-based records (see Farmonaut Traceability).
The ultimate role of agronomic soil testing is not only to optimize crop yield and reduce input costs—but also to create resilient, resource-efficient, and climate-smart agricultural ecosystems.

▶ Why soil carbon matters, and how satellites can estimate it · 12:15
Soil Health & Sustainability Support Tools
- Environmental Compliance: Precision soil testing supports adherence to regional fertilizer bans or environmental guidelines, like played out in the Florida Fertilizer Ban 2025 (YouTube) for Indian River Lagoon.
-
Crop Loans & Risk Management: Some lenders and insurers may ask for digital soil test verification for approval and payouts.
Interested? See how Farmonaut Crop Loan and Insurance Verification tools facilitate access to finance. - Scale & Mobile Access: Solutions for small, medium, and large farms—enabled via web, Android, iOS, or direct app download.
Farmonaut Subscriptions: Affordable Access to Digital Soil Data
Farmonaut offers scalable, cost-effective subscription packages for individuals, agribusinesses, research, and government use. Choose a plan that matches your monitoring scope and data update requirements—no complex hardware or installation required!
Explore our Large-scale Farm Management platform for integrated digital agronomy, satellite insights, and team collaboration.
FAQ: Agronomic Soil Testing
-
Why is agronomic soil testing important in 2025?
It is vital for matching soil nutrient supply with crop demand, reducing input costs, maximizing yield, and improving long-term soil health. Regular soil testing helps meet sustainability and compliance goals, making farming more efficient and resilient to climate impacts. -
What is the difference between a basic soil test and a comprehensive agricultural soil test?
A basic soil test typically evaluates major nutrients and pH, while a comprehensive test includes secondary/micronutrients, organic matter, microbiology, contaminants, soil structure, and more, often using advanced digital/lab methods. Both are essential, but comprehensive tests provide deeper management insight. -
Which soil tester is best for farm use?
No independent ranking of soil testers exists. For fertilizer and lime advice, use a laboratory that takes part in a proficiency program such as NAPT, and follow your local extension service. Portable sensors and satellite tools can show where a field varies, so they help you decide where to sample. -
How often should soil be tested?
US extension services suggest sampling every 2 to 4 years, or once per crop rotation (Iowa State), and every 4 years in most soils, or every 2 years on sandy or highly managed soils (Purdue). Sample before you apply fertilizer or lime. Satellite or sensor data can add monitoring between tests, but they do not replace the lab test. -
How do digital soil tests integrate with other farm management tools?
Digital soil test data can be automatically synced into farm management apps for variable-rate input mapping, irrigation planning, satellite crop vigor overlays, and automated traceability records for sustainability certification. -
Can soil testing help reduce environmental impact?
Absolutely. Precision management minimizes overuse of fertilizers—preventing waterway pollution, reducing fertilizer costs, and promoting balanced, sustainable soil ecosystems. -
Is Farmonaut a soil tester manufacturer or regulatory body?
No, Farmonaut provides advanced satellite-based digital monitoring, AI advisory, and resource management for soil health and crop productivity—but does not manufacture hardware testers, farm inputs, or regulate farming practices. -
How do I access Farmonaut’s soil monitoring and test advisory features?
Sign up or log in through our Web/Android/iOS Apps or via API endpoints. Choose the service package that fits your needs and start monitoring your agricultural land soil data today.
Chart
Longest gap between soil tests
Years, by source
Conclusion: Shaping the Future of Agriculture with Superior Soil Testing
Agronomic soil testing remains essential to the transformation of global agriculture. By systematically quantifying soil health, nutrient status, and biological activity, good lab testing and digital methods are enabling both small and large farmers to reduce costs, improve yield, and ensure sustainable soil management.
Platforms like Farmonaut—by integrating real-time satellite data, AI, and blockchain—bring actionable insights, environmental compliance, and resource traceability to every user, from the field to the cloud.
In this era of rising demand for food and climate challenges, it is clear: regular, science-based, digital soil testing is not an option, but a necessity for productive, sustainable, and future-ready farming.
Ready to take your soil health monitoring into the digital future?
Start with Farmonaut today and build the foundation for resilient, productive, sustainable agriculture.
Farmonaut crop monitoring
See where your fields vary, then sample there
Farmonaut Satellite + AI Farm Monitoring System shows field variation from space, so you can place soil samples where they count. It does not replace a laboratory test.




Keep reading
Sources
- Purdue Extension, Soil Sampling Guidelines AY-368 (2018): extension.purdue.edu
- Iowa State University Extension, Take a Good Soil Sample, PM 287 (2003): crops.extension.iastate.edu
- University of Arizona Cooperative Extension, A Guide to Effective Soil Sampling, AZ2147 (2025): extension.arizona.edu
- University of Maryland Extension, Soil pH Management and Determining Liming Rates, SFM-5 (1997): extension.umd.edu
- University of Maryland Extension, Soil pH: The Master Soil Variable (2022): extension.umd.edu:443
- Soil Science Society of America, NAPT Program (page read October 2026): soils.org
- Alliance of Bioversity International and CIAT (CGIAR), Low-Cost Portable Soil Fertility Sensors: Myth or Reality? technical report: cgspace.cgiar.org
- USDA NRCS, Conservation Practice Standard 590 Nutrient Management (January 2011 version, hosted by Utah State University Extension): extension.usu.edu
- Oregon State University Soil Health Lab, soil testing packages and turnaround (page read October 2026): cropandsoil.oregonstate.edu
- Utah State University Analytical Laboratories, price list (page read October 2026): usu.edu
- University of Wisconsin Extension, La Crosse County, soil sampling and fees (page read October 2026): lacrosse.extension.wisc.edu
- FAO Global Soil Partnership, Global Soil Laboratory Network (GLOSOLAN): fao.org
- Semella et al., Accuracy and Reproducibility of Laboratory Diffuse Reflectance Measurements with Portable VNIR and MIR Spectrometers, Sensors (2022): ncbi.nlm.nih.gov
- Farmonaut, pricing page (read October 2026): farmonaut.com
Discussion
Questions, corrections or field experience? Share them below. First-time comments are reviewed before they appear, and your email is never published.
No comments yet. Be the first to add a question or your experience.

 Aadyah Aerospace
 Kubota
 FFBS
 Jontra
 Kalustyan
 Tucor
 Geno
 Hayleys Agriculture
 Linx Agritech
 Adinet
 Save Your Soils
 Grandstream Algérie
 XOS Realty
 Geospatial Lab Africa
 Agro La Gándara
 HIPSAC
 ZOL Zimbabwe

 Licence holder · Niger · Gold










