

Crops · US values and costs
Cash Crops: Examples, US Values and Tree Crop Costs
A cash crop is grown to sell. Corn led US field crops in 2025 at $70.1 billion, ahead of soybeans at $43.6 billion (USDA NASS). Here are the main examples, what they cost per acre, and why tree crops such as almonds pay more slowly.
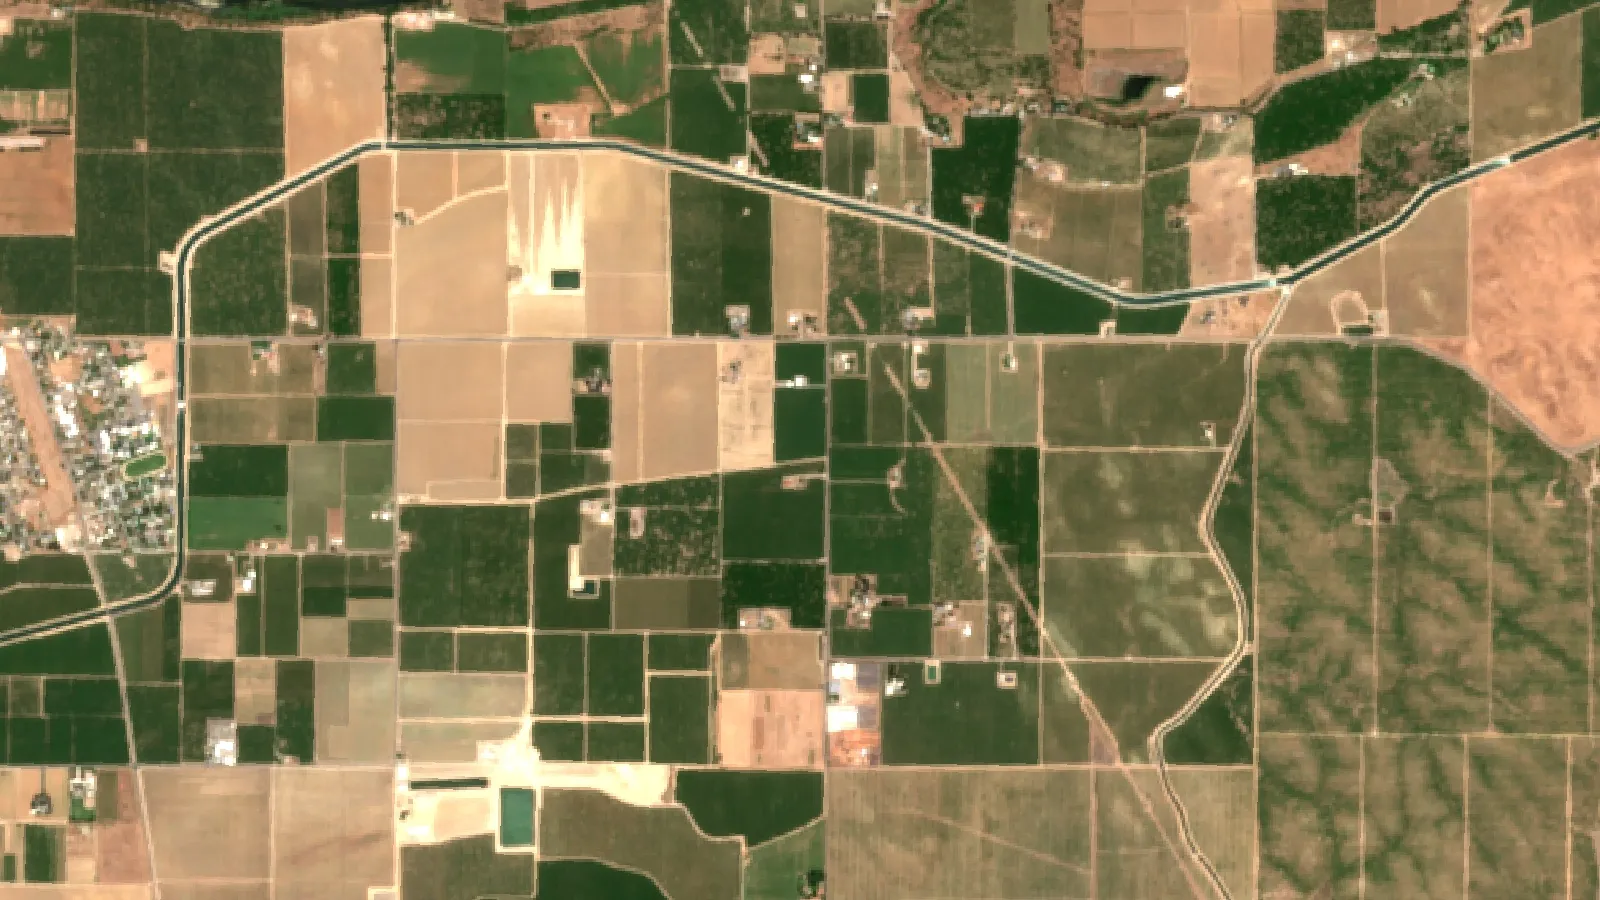
Key takeaways
- A cash crop is grown for sale, not for home use or the farm’s own livestock.
- US corn for grain was worth about $70.1 billion in 2025 and soybeans $43.6 billion, of $167.6 billion for all field crops (USDA NASS, February 2026).
- Season average prices fell from 2023 to 2025: corn $4.55 to $4.10 per bushel, wheat $6.96 to $4.90 (NASS).
- Alabama’s 2025 budgets projected soybeans and peanuts near break-even and cotton at a $237 per acre loss before land costs (Alabama Extension).
- A UC almond study puts accumulated net cash cost at $17,292 per acre by year 3 and $21,225 by year 5, before full yield.
In this article
- What is a cash crop?
- Cash crop examples ranked by US value
- Cash crop prices: what farmers received
- What does a cash crop cost to grow?
- Tree crops: higher value, longer wait
- Cash crops vs tree crops compared
- How to choose a cash crop for your farm
- Cash crop farming practices that protect margins
- Climate, sustainability and the cash crop
- Farm income and the wider economy
- Insurance, finance and records
- How we checked the numbers
- FAQ
A cash crop is a crop grown to sell for money rather than to feed the farm family or the farm’s own animals. In the United States the biggest cash crop by value is corn for grain, worth about $70.1 billion in 2025, followed by soybeans at $43.6 billion, according to the USDA NASS Crop Values 2025 Summary. Tree crops such as almonds, apples, cocoa and coffee are cash crops too, but they take years to pay back.
This guide gives cash crop examples with dated US values, shows what row crops and an almond orchard cost per acre, and explains how to choose between annual crops and tree crops. It also has a break-even calculator you can fill in with your own yields, prices and costs.
What is a cash crop?
The word “cash” is the key. A subsistence crop is eaten at home. A feed crop goes to the farm’s own cattle or hogs. A cash crop leaves the farm and is sold, usually to an elevator, a gin, a packer, a processor or an exporter. The same plant can be either. Corn fed to your own steers is a feed crop; corn hauled to the elevator is a cash crop.
Farm advisers also use the term inside crop rotations. The SARE guide to cover crops talks about planting a cover crop “after the harvest of a cash crop and before planting the next cash crop”. In that sense the cash crop is the one you harvest and sell, and the cover crop is the one you grow to protect the soil.
Characteristics of cash crops
- Sold off the farm. The price is set by a market, a contract or a buyer, not by the grower.
- Priced in standard units. Bushels for grain, pounds for cotton and nuts, tons for hay and sugar beets, hundredweight for rice and potatoes.
- Graded. Moisture, protein, fiber length or kernel size can raise or cut the price.
- Exposed to world markets. Large harvests elsewhere can lower your price even in a good local year.
- Input heavy. Seed, fertilizer, crop protection, fuel and machinery make up most of the cost per acre.
Annual cash crops and tree crops
Annual cash crops, such as corn, soybeans, wheat, cotton and canola, are planted and harvested in one season. You can change the mix every year. Tree crops, also called perennial or plantation crops, include nuts, tree fruit, citrus, olives, cocoa, coffee and oil palm. They need several years before the first real harvest, and the trees stay in the ground for decades. Mixing trees with field crops on the same land is called agroforestry; one common form, alley cropping, grows crops between rows of trees.
Cash crop examples ranked by US value
The table and chart below rank US field crops by value of production in 2025. This is the value of the whole harvest at the season average price, before any costs. It is not profit. Tree fruit and nuts are counted in a separate NASS report, so they are not in this list.
Chart
Top US field crops by value of production
US$ billion, 2025 crop, value at season average prices received
| Crop | 2025 value | Unit and 2025 average price | Best for |
|---|---|---|---|
| Corn for grain | $70.1 billion | $4.10 per bushel | Large Corn Belt farms with storage and drying |
| Soybeans | $43.6 billion | $10.20 per bushel | Rotation with corn; lower fertilizer need |
| Hay, all | $17.2 billion | $160 per ton | Farms near dairies, feedlots and horse owners |
| Wheat, all | $9.9 billion | $4.90 per bushel | Drier plains and winter rotations |
| Potatoes | $4.6 billion | $11.20 per cwt | Irrigated farms with processor contracts |
| Cotton | $4.2 billion | $0.624 per pound | Southern farms close to a gin |
| Rice | $2.4 billion | $12.10 per cwt | Flat, flood-irrigated land in the Delta and California |
| Peanuts | $1.8 billion | $0.247 per pound | Sandy Southeast soils with a sheller nearby |
Values and prices are from the NASS Crop Values 2025 Summary (February 2026). These are season average prices received by farmers, not futures or dealer prices.
A few points stand out. Corn and soybeans together were worth about $113.7 billion, about two thirds of the $167.6 billion total for US field and miscellaneous crops. Hay ranks third, partly because much of it is sold locally rather than through national markets. Smaller cash crops, such as tobacco ($0.83 billion), canola ($0.94 billion) and hops ($0.45 billion), can still pay well on the right farm with the right buyer.
Other common cash crop examples
Around the world, the list of cash crops is long. It includes sugarcane and sugar beets, oilseeds such as canola and sunflower, fiber crops such as cotton and flax, beverage crops such as coffee, tea and cocoa, and specialty crops such as vegetables, berries, nuts, herbs and hops. An FAO yearbook notes that sugar cane made up around 21 percent of world crop production by weight over 2000 to 2020, while vegetables were 20 percent of the value of world primary crops in 2020 and fruit 17 percent.
Cash crop prices: what farmers received
Prices for the big grain and oilseed crops fell from 2023 to 2025. NASS data show the average corn price dropped from $4.55 to $4.10 per bushel, and wheat from $6.96 to $4.90. Soybeans fell from $12.40 to $10.00 in 2024 and then edged up to $10.20 in 2025.
Chart
US season average prices received
US$ per bushel, crop years 2023 to 2025
Big harvests are one reason. In its October 2026 Crop Production report, NASS forecast the 2026 corn crop at 16.0 billion bushels, which would be the second highest on record, and soybeans at a record 4.56 billion bushels. Large supplies tend to hold prices down.
Farm income has held up better than crop prices, helped by government payments, which ERS expects to rise by $19.5 billion in 2026. The USDA Economic Research Service forecast net farm income at $158.4 billion for 2026 (update of 3 September 2026), down 2.6 percent from 2025 in nominal terms. In the same release, net cash farm income was forecast at $176.4 billion.
What does a cash crop cost to grow?
Gross value says little about what a farmer keeps. Enterprise budgets from extension services show the other side. The Alabama Cooperative Extension 2025 row crop budgets compare projected revenue with total cost per acre for non-irrigated crops in Alabama, before land costs.
Chart
Projected revenue vs total cost per acre, Alabama
US$ per acre, non-irrigated, 2025 budgets, land costs excluded
- Cotton (North Alabama): cost $832 per acre, revenue $595, a loss of $237.
- Corn: cost $626, revenue $599, a loss of $27.
- Soybeans: cost $471, revenue $473, a return of $2.
- Peanuts: cost $873, revenue $875, a return of $2.
These are budget projections for one state and one year. Your costs, yields and prices will differ. The point is that margins on major cash crops are thin in low-price years, so small changes in yield or cost decide whether a field makes money.
Use the calculator below to test your own field. The example values are set close to break-even so you can see how each number moves the result.
Try the numbers for your own farm below.
Calculator
Cash crop break-even calculator
Enter your own yield, price and costs for one crop.
- Revenue per acre: 469 US$
- Net return per acre: -2 US$
- Break-even price: 10.2 US$ per unit
- Break-even yield: 46.2 units/acre
Example values only, set near break-even; they are not a forecast or a benchmark. The example price is the 2025 US soybean season average ($10.20 per bushel, USDA NASS) and the example cost is Alabama Extension’s 2025 non-irrigated soybean budget ($471 per acre). Use today’s price and your own costs. Get professional advice before major financial decisions.
Tree crops: higher value, longer wait
Tree crops can earn more per acre than field crops once they bear, but the start-up bill is large and the payback is slow. A 2024 UC Davis and UC Cooperative Extension cost study for almonds in the northern San Joaquin Valley of California shows what that looks like for a 100-acre orchard under micro-sprinkler irrigation.
Chart
Almond orchard: accumulated net cash cost
US$ per acre by orchard year, northern San Joaquin Valley, 100-acre example orchard
- Year 1 cash cost: about $12,869 per acre, mostly site preparation, trees and the irrigation system.
- Accumulated net cash cost by year 3: $17,292 per acre.
- Accumulated net cash cost by year 5: $21,225 per acre, even after early harvests.
- Mature yield assumed: 2,200 kernel pounds per acre from year 6.
- Mature orchard costs: operating costs of $3,807 per acre and total costs of $8,615 per acre, including non-cash overhead.
The study used a price of $1.60 per pound, based on returns reported when it was written. At that price and yield, revenue is about $3,520 per acre, which is below the total cost. The study’s ranging table shows the operating cost per pound falls from $2.27 at 1,600 pounds per acre to $1.22 at 3,400 pounds, so yield is the main lever. The accumulated cash costs above leave out land, but the $8,615 total cost includes a non-cash land charge of $2,063 per acre. Prices for nuts change every season; check current handler returns before using any of these figures.
Why growers still plant tree crops
- Long life. An orchard planted once can produce for 20 years or more.
- Higher value per acre in good years. Nuts and tree fruit sell for far more per acre than grain when prices and yields are strong.
- Less yearly tillage. Permanent tree cover protects soil between rows.
- Land and water use. Some sloped or stony land suits trees better than row crops.
The main risks
- Capital locked in. You cannot switch crops when prices fall.
- Water. Orchards need water every year, even in drought, or trees may die.
- Pollination and labor. Almonds need rented bee hives; tree fruit needs hand labor at harvest.
- Weather. One spring frost or hail storm can take most of a year’s crop.

▶ How oil palm, a major tree crop, is planted and managed for high-quality palm oil. · 11:29
Cash crops vs tree crops compared
| Feature | Annual cash crops | Tree crops |
|---|---|---|
| Time to first sale | One season | Usually 3 to 5 years |
| Start-up cost | Seed, inputs and machinery each year | High: $17,292 per acre by year 3 for almonds in one UC study |
| Flexibility | Change crops each year | Locked in for decades |
| Price exposure | Grain and oilseed markets | Specialty markets, often export-led |
| Soil impact | Depends on tillage and rotation | Permanent cover between rows |
| Labor peaks | Planting and harvest | Pruning, pollination and harvest |
| Finance | Annual operating loans | Long-term loans and equity |
How to choose a cash crop for your farm
- Start with the buyer. A crop is only a cash crop if someone near you will buy it. Check the distance to the nearest elevator, gin, processor or packing shed.
- Match soil and climate. Look at your soil type, drainage, rainfall and frost dates. Good soil fertility lowers fertilizer cost.
- Use an extension budget. Most land-grant universities publish cost and return budgets by crop. Start from one and replace the numbers with your own.
- Work out your break-even. Divide total cost per acre by expected yield to get the price you need. Then divide cost by price to get the yield you need.
- Plan the rotation. Alternating crops cuts pest and disease pressure and can lift yields.
- Check equipment and labor. A new crop may need a different planter, header or harvester, or seasonal crews.
- Manage price risk. Consider forward contracts, crop insurance and storage. Talk to a farm finance adviser before large commitments.
Cash crop farming practices that protect margins
Rotation and diversity
SARE’s guide to diversifying cropping systems says yields of crops in rotations are typically 10% higher than in monoculture in normal seasons and as much as 25% higher in droughty seasons. Rotations also spread labor across the year and break pest cycles, such as corn rootworm and soybean cyst nematode. A rotation of different crops is part of good crop rotation and soil practice.
Cover crops between cash crops
Cover crops such as cereal rye can hold soil over winter and feed soil life. In a survey summarized by SARE, 52% of farmers had “planted green”, seeding a cash crop into a standing cover crop and ending the cover soon after; of those, 71% reported better weed control. Practices like these sit at the heart of soil health programs.
Stage-by-stage management
Each crop has key stages, from seedbed to harvest, where a missed task costs yield. Our guide to crop farming stages walks through them. Matching nitrogen and water to each stage is where most savings come from.
Precision tools
Precision agriculture uses GPS guidance, yield maps, soil sampling and satellite images to vary inputs within a field. Satellite vegetation maps show which parts of a field or orchard are lagging, so you can scout those spots first. The Farmonaut Satellite + AI Farm Monitoring System gives this kind of field-by-field view on web, Android and iOS. For a wider look at how farming has changed, see our photo guide to modern agriculture.
Pest control
Biological and botanical products such as neem, oil sprays and other low-toxicity options can form part of an integrated pest management plan. Always read and follow the product label and check your state or national rules before applying any pesticide.

▶ A walk-through of satellite crop health maps for monitoring fields from the web. · 8:43
Climate, sustainability and the cash crop
Cash crop farming depends on weather, and changing rainfall and heat patterns affect what grows where. Growers are responding with drought-tolerant varieties, better irrigation scheduling, cover crops and wider rotations. For background on how farming and Climate Change interact, see our explainer.
Buyers now ask more questions about how crops are grown. Food companies and exporters may ask for records on inputs, field boundaries and land-use history. Keeping clean field records, maps and spray logs makes these requests easier to meet and can open premium markets.
Tree crops can store carbon in wood and roots, and some farms plant trees on field edges or in alleys between crops. These systems take longer to pay off but can spread income over more products, such as nuts, fruit or timber, as well as grain.
Farm income and the wider economy
Cash crops support far more than the farm. Elevators, gins, trucking firms, seed dealers, machinery shops and processors all depend on them. University of Kentucky economists noted in their ag economic outlook that crop receipts were projected to fall 9.2% in 2024 as grain prices slumped after large world crops, while livestock receipts rose. The ERS farm income webinar of September 2026 explained that crop cash receipts were forecast to rise $14.6 billion, partly because farmers sold crops from inventory.
For a small farm, a single high-value cash crop sold direct to buyers can matter more than scale. For a large farm, the margin per acre on corn and soybeans, multiplied over thousands of acres, sets the year’s result. Either way, knowing your break-even is the first step.
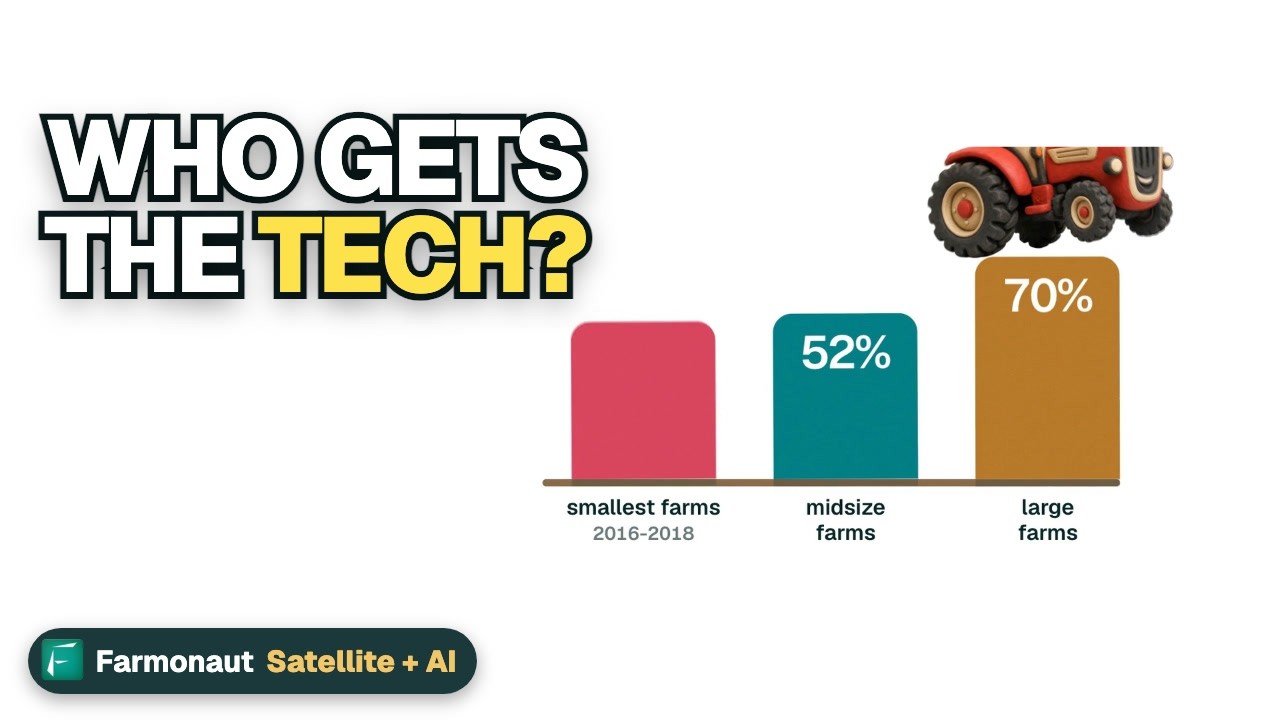
▶ What farm technology means for money, jobs and internet in rural towns. · 3:50
Insurance, finance and records
Lenders and insurers look at yield history and field records. Satellite records of crop condition can support claims and loan reviews; see our page on satellite-based crop insurance. Some buyers also ask for blockchain-based traceability from field to shipment. Before taking out a loan for a new orchard or a new crop, get advice from a farm finance professional and check the terms of your crop insurance policy.
Related pages on our site: satellite crop monitoring app, farm management for large estates, farm fleet management, farm carbon footprinting, satellite and weather API docs.
How we checked the numbers
US crop values and prices come from the USDA NASS Crop Values 2025 Summary, released in February 2026. Values are the value of production at season average prices received by farmers. Crop forecasts come from the NASS Crop Production report of October 2026. Farm income figures come from the USDA ERS forecast updated on 3 September 2026. Per-acre costs come from the Alabama Cooperative Extension 2025 row crop budgets and the 2024 UC Davis almond cost study. Budget figures are projections for one region and exclude land costs.
FAQ
What is the most valuable cash crop in the US?
Corn for grain. NASS valued the 2025 US corn crop at about $70.1 billion, ahead of soybeans at $43.6 billion and hay at $17.2 billion.
What are three examples of cash crops?
Corn, soybeans and cotton are three common examples in North America. Wheat, canola, sugar beets, coffee, cocoa and almonds are also cash crops.
Is a tree crop a cash crop?
Yes, when the harvest is sold. Almonds, apples, cocoa, coffee and oil palm are all grown mainly for sale. They differ from annual cash crops because the trees take years to bear and stay in the ground for decades.
What is the most profitable cash crop?
No single crop is most profitable everywhere. Profit depends on your yield, price, costs and market access. In Alabama’s 2025 budgets, soybeans and peanuts were projected near break-even, while cotton showed a loss of $237 per acre before land costs. Use the calculator with your own numbers.
How long does an almond orchard take to pay back?
Many years. In the 2024 UC almond cost study, accumulated net cash costs reached $21,225 per acre by year 5, and full yield of 2,200 pounds per acre was assumed only from year 6. Payback depends heavily on nut prices.
What is the difference between a cash crop and a cover crop?
A cash crop is harvested and sold. A cover crop, such as cereal rye or clover, is grown between cash crops to protect and build the soil and is usually not sold.
Farmonaut crop monitoring
Watch your cash crops from space
Draw your fields or orchard blocks once and Farmonaut shows satellite vegetation maps for them through the season, on web, Android or iOS.




Sources
- USDA NASS, Crop Values 2025 Summary (February 2026): release.nass.usda.gov
- USDA NASS, Crop Production (October 2026): release.nass.usda.gov
- USDA ERS, Highlights from the Farm Income Forecast (updated 3 September 2026): ers.usda.gov
- USDA ERS, Farm Income webinar transcript (3 September 2026): ers.usda.gov
- Alabama Cooperative Extension System, 2025 Alabama Row Crop Costs and Returns: aces.edu
- UC Davis and UC Cooperative Extension, Sample Costs to Establish an Orchard and Produce Almonds, San Joaquin Valley North (2024): almonds.org
- SARE, Building Soils for Better Crops, Ch. 10 Cover Crops: sare.org
- SARE, Building Soils for Better Crops, Ch. 11 Diversifying Cropping Systems: sare.org
- FAO, Statistical Yearbook: World Food and Agriculture 2022: openknowledge.fao.org
- University of Kentucky, Ag Economic Situation and Outlook: agecon.mgcafe.uky.edu
Discussion
Questions, corrections or field experience? Share them below. First-time comments are reviewed before they appear, and your email is never published.
No comments yet. Be the first to add a question or your experience.

 Adinet
 Save Your Soils
 YelloSkye
 GalaxEye Space
 Grandstream Algérie
 XOS Realty
 Geospatial Lab Africa
 Agro La Gándara
 HIPSAC
 ZOL Zimbabwe
 Juligerm
 AdBio
 MISE Maroc
 NWNS
 Red August Group
 Farm Inc
 WeMe Global
 Agrotoken
 Blue BearX
 Insignito

 Licence holder · Niger · Gold
 Licence holder · Nigeria · Gold + lithium
 Client · Somalia · Gold
 Client & affiliate partner · Ghana · Gold










