

Farm inputs · Plain-English guide
Agricultural Chemicals: Main Types, Uses and Costs
Fertilizers make up most farm chemicals by weight and herbicides lead pesticide sales. This guide covers each type, US retail fertilizer prices from September 2026, use per hectare by country, label rules, environmental effects and ways to use less for the same yield.
Key takeaways
- Farms worldwide used 201 million tonnes of N, P and K nutrients in 2020, 56% of it nitrogen, and about 2.7 million tonnes of pesticides (FAO Statistical Yearbook 2022).
- Herbicides (with plant growth regulators) took 44% of world pesticide spending at the producer level in 2012, insecticides 29% and fungicides 26% (EPA sales and usage report).
- In the last week of September 2026, US retail anhydrous averaged US$979/ton and urea US$683/ton, 20% and 12% above a year earlier (DTN survey of dealer prices).
- A Nature Plants study of 946 French arable farms estimated pesticide use could fall 42% without loss of productivity or profit on 59% of farms.
- Label rules are law in the US; check the label and local rules and get professional advice before changing products or rates.
In this article
- What are agricultural chemicals?
- The four main types of agricultural chemicals at a glance
- Fertilizers: nitrogen, phosphorus and potassium
- Fertilizer prices and the cost per acre
- How much fertilizer countries use per hectare
- Pesticides: herbicides, insecticides and fungicides
- Plant growth regulators and biostimulants
- Rules, labels and safety
- Environmental effects of farm chemicals
- Integrated pest management: use less without losing yield
- Precision application and satellite monitoring
- How to choose and use agricultural chemicals: 7 steps
- FAQ
Agricultural chemicals are the fertilizers, pesticides, plant growth regulators and soil amendments that farmers apply to feed crops and protect them from weeds, insects and disease. The two big groups are fertilizers and pesticides. Farms worldwide used 201 million tonnes of fertilizer nutrients in 2020, and about 2.7 million tonnes of pesticides, according to the FAO Statistical Yearbook 2022.
This guide explains each type in plain terms, shows what they cost at US retail in autumn 2026, compares how much fertilizer farms in major producing countries use per hectare, and covers the rules, risks and methods that help growers use less product for the same yield. It also has a calculator to test whether a lower nitrogen rate pays on your own farm.
What are agricultural chemicals?
The term covers any manufactured product a farmer applies to a crop, the soil or stored grain to raise yield or protect it. Some are natural minerals that are mined and processed, such as potash and rock phosphate. Others are made in factories, such as urea from natural gas or a synthetic herbicide. Lime and gypsum are also often listed with farm inputs because they change soil chemistry.
Most farm chemicals fall into four groups:
- Fertilizers supply nutrients, mainly nitrogen (N), phosphorus (P) and potassium (K), plus sulfur and trace elements.
- Herbicides kill or suppress weeds that compete with the crop for light, water and nutrients.
- Insecticides and fungicides control insect pests and plant diseases. Nematicides, miticides and fumigants are smaller groups in the same family.
- Plant growth regulators and biostimulants change how a plant grows, for example shorter, stronger stems in wheat, or better rooting.
Herbicides, insecticides, fungicides and fumigants are all pesticides in law. In the United States they are registered by the Environmental Protection Agency (EPA). Fertilizers are mostly regulated by state departments of agriculture. In the European Union, pesticides need approval of the active substance at EU level and product approval in each member state.
The four main types of agricultural chemicals at a glance
The table sums up what each group does, the common active ingredients or products, and the main risk to manage. Each group has its own section below.
| Type | What it does | Common examples | Main risk to manage |
|---|---|---|---|
| Nitrogen fertilizer | Leaf and stem growth, protein | Anhydrous ammonia, urea, UAN solutions, ammonium nitrate | Nitrate leaching, ammonia loss, nitrous oxide |
| P and K fertilizer | Roots, energy transfer, water control | DAP, MAP, 10-34-0, potash (muriate of potash) | Phosphorus runoff to lakes and rivers |
| Herbicides | Weed control before or after planting | Glyphosate, glufosinate, 2,4-D, dicamba, atrazine | Drift, resistant weeds, water residues |
| Insecticides | Insect pest control | Pyrethroids, neonicotinoids, diamides, organophosphates | Harm to bees and natural enemies |
| Fungicides | Disease protection and cure | Strobilurins, triazoles, copper, sulfur | Fungicide resistance, water residues |
| Growth regulators | Shorter stems, fruit set, ripening | Chlormequat, trinexapac-ethyl, ethephon | Wrong timing can cut yield |
Fertilizers: nitrogen, phosphorus and potassium
Fertilizers are the largest group of farm chemicals by weight. Of the 201 million tonnes of nutrients used in 2020, nitrogen made up 113 million tonnes (56%), phosphorus 48 million tonnes (24%) and potassium 39 million tonnes (20%). Total use was 49% higher than in 2000, with potassium up 81% (FAO, 2022). China, Brazil and the United States are among the largest users.
Nitrogen
Nitrogen drives leaf growth and grain protein. Corn, wheat, canola and grass need the most. The main US forms are anhydrous ammonia (82% N), urea (46% N) and UAN solutions (28% or 32% N). Nitrogen is the hardest nutrient to keep in the field. It can wash out as nitrate, escape to the air as ammonia when urea sits on a warm surface, or turn into nitrous oxide, a strong greenhouse gas, in wet soils.
Phosphorus
Phosphorus helps roots grow and moves energy inside the plant. Growers apply it as DAP (18-46-0), MAP (11-52-0) or liquid 10-34-0. It binds tightly to soil, so the main loss is on eroded soil and in surface runoff. Small amounts in a lake can feed algae blooms.
Potassium
Potassium controls water flow in the plant and helps it resist drought and disease. The common product is potash (0-0-60). It moves little in most soils, but sandy fields and high-yield hay or vegetable crops remove a lot each year.
Blended and compound products combine nutrients in one granule. Our guides to 13-13-13 fertilizer and 30-0-10 fertilizer explain how to read the three numbers on a bag.
Newer fertilizer formulations
Enhanced-efficiency fertilizers try to keep more nutrient in the root zone. Polymer-coated urea releases nitrogen slowly. Urease inhibitors cut ammonia loss from surface urea for a short time. Nitrification inhibitors slow the change from ammonium to nitrate, so less washes out in a wet spring. They cost more per pound of nutrient, so they pay best where losses are high: sandy soils, early application or no-till fields with residue on the surface.
US farms are getting more crop per pound of nutrient. Researchers at the University of Illinois found that application rates of N, P and K per bushel produced have been declining for corn, soybeans and wheat, because yields grew faster than rates (farmdoc daily, May 2025).
Fertilizer prices and the cost per acre
Fertilizer is one of the largest cash costs on a grain farm, so price swings matter. In the last week of September 2026, DTN’s survey of US retail dealers showed that all eight fertilizers it tracks were higher in price than a year earlier. Anhydrous ammonia was 20% higher and urea 12% higher. These are average retail asking prices per short ton, not contract or delivered prices, so your dealer quote will differ.
Chart
US retail fertilizer prices, late September 2026
Average dealer asking price, US$ per short ton, last week of September 2026
On a price per pound of nitrogen, the same survey put anhydrous at US$0.60, urea at US$0.74, UAN28 at US$0.77 and UAN32 at US$0.75. Anhydrous is often the lowest cost source of N, but it needs special equipment and careful handling. Price per pound of nutrient, not price per ton, is the fair way to compare products.
Prices depend on natural gas (for nitrogen), mine output (for potash and phosphate), shipping routes, trade duties and the planting outlook. A rise in corn acres in spring tends to lift nitrogen demand. Before you book, compare at least two dealer quotes on a per-pound-of-nutrient basis and check what is included: delivery, application and any inhibitor.
Try the numbers for your own farm below.
Calculator
Does a lower nitrogen rate pay on your farm?
Enter your acres, N rate, prices and the yield you might lose.
- N cost per acre now: $118 US$/ac
- Fertilizer saved on the farm: 7,400 US$
- Grain value lost on the farm: 7,000 US$
- Break-even yield loss: 3.7 bu/ac
Example values only, set near break-even; they are not a recommendation. The N price default is the DTN average for urea in late September 2026 (US$0.74 per lb N); the grain price is an example, use today’s price. Yield response to nitrogen depends on soil, rotation and season: use your extension service’s rate guide and on-farm strip trials. Check local rules and get professional advice.
How much fertilizer countries use per hectare
Rates per hectare vary a lot between countries, because of crops, soils, climate and prices. World Bank data show fertilizer use in kilograms of nutrients per hectare of arable land. In 2023 China used about 393 kg/ha and Brazil 344 kg/ha, while the United States used 128 kg/ha, Canada 132 kg/ha and Australia 102 kg/ha (World Bank World Development Indicators).
A higher rate does not mean better farming. Brazil grows two crops a year on many fields and has weathered soils low in phosphorus and potassium. Australia farms large areas of dryland wheat where rain, not nutrients, often limits yield. The chart compares 2021 with 2023, a period of very high fertilizer prices.
Chart
Fertilizer use per hectare of arable land
kg of nutrients (N + P2O5 + K2O) per hectare of arable land, 2021 vs 2023
Pesticides: herbicides, insecticides and fungicides
Pesticide use is small in tonnes but large in value. The FAO yearbook reports global use of about 2.7 million tonnes of active ingredients in 2020, 30% more than in 2000. The United States was the largest user with 0.41 million tonnes, or 15% of the world total, slightly ahead of Brazil (0.38 million tonnes).
Chart
World pesticide spending by type, 2012
US$ million at producer level
Herbicides are the biggest group by sales. An EPA report on pesticide industry sales and usage estimated world spending at the producer level at nearly US$56 billion in 2012. Herbicides and plant growth regulators took 44%, insecticides 29% and fungicides 26%. In US farming, herbicides made up about 59% of pesticide spending in 2012. That report is the latest EPA edition with these sales figures, so treat the split as a long-run pattern rather than a current market size.
Herbicides
Weeds can cause large yield losses if left alone, so most row-crop acres get at least one herbicide pass. Glyphosate is the most widely known. The EPA states that in its 2017 assessment it concluded that glyphosate is not likely to be carcinogenic to humans, and the agency is still working on its review decision. Heavy use of one mode of action has led to resistant weeds such as Palmer amaranth and waterhemp, so advisers now urge rotating and mixing modes of action.
Insecticides
Insecticides protect crops from pests such as aphids, rootworm, bollworm and stink bugs. Seed treatments put a small dose on every seed. Foliar sprays are used when scouting shows pests above a threshold. Many insecticides also kill bees and the beetles and wasps that eat pests, so timing and product choice matter. Our guide to aphids and mealybugs shows how to tell two common sap-feeders apart.
Fungicides
Fungicides prevent or slow diseases such as rusts, blights and mildews. Most work best before the disease spreads, so growers time them to crop stage and weather. Using the same fungicide group again and again lets resistant strains build up. Labels list the group number to help growers rotate.
Plant growth regulators and biostimulants
Plant growth regulators change plant hormones. In cereals they shorten and thicken stems so the crop does not fall over (lodge) before harvest. In fruit they thin blossoms, set fruit or time ripening. In cotton they slow rank growth. They are pesticides in law in the US and are registered the same way.
Biostimulants are a newer and mixed group: seaweed extracts, humic acids, protein hydrolysates and beneficial microbes. They aim to help plants take up nutrients or cope with stress, not to supply nutrients or kill pests. The EU created a product category for them in its Fertilising Products Regulation (EU 2019/1009). Results in field trials vary a lot by product, crop and season. Ask for independent trial data from your region, and test any product on strips with an untreated check before using it across the farm.
Rules, labels and safety
Every pesticide label in the US is a legal document. In the EPA’s own words, the label is the law: using a product in a way the label does not allow is illegal. The label sets the crops, rates, timing, the re-entry interval before workers can return, the pre-harvest interval before harvest and the protective equipment needed.
Rules change. Products are re-evaluated on a cycle, and some uses are cancelled. The EPA’s chlorpyrifos page, for example, records a December 2024 proposed rule to revoke tolerances tied to cancelled food uses. Canada’s Pest Management Regulatory Agency, the UK’s Health and Safety Executive and Australia’s APVMA run their own reviews, so a product legal in one country may not be legal in another.
Fertilizers have their own rules in many places. Some US states require nutrient management plans or limit autumn nitrogen on certain soils. The EU Nitrates Directive caps nitrogen from manure in vulnerable zones. Check the product label and your local rules, and get advice from a licensed agronomist or crop adviser before you change products or rates.
Environmental effects of farm chemicals
Farm chemicals reach water, air and wildlife when they move off the field. In Europe, the European Environment Agency reports that in 19% to 27% of river water bodies one or more pesticides were above their effect threshold each year between 2013 and 2023. Exceedances were also found at 11% to 18% of groundwater bodies, mainly from atrazine and its breakdown products, glyphosate and bentazone. The EU’s Farm to Fork strategy set a goal to cut the use and risk of chemical pesticides by 50% by 2030, though the proposed law to make it binding was withdrawn in 2024.
Nitrogen and phosphorus losses feed algae in lakes and coastal waters and can make drinking water costly to treat. Nitrous oxide from fertilized soils adds to farm greenhouse gas emissions. Insecticides can harm pollinators, and some herbicides can drift onto neighbours’ crops on hot, windy days.
The answer for most farms is not to stop using inputs. It is to put the right amount in the right place at the right time, which also saves money. That idea is behind the 4R nutrient stewardship programme (right source, rate, time and place) promoted by fertilizer groups and extension services across North America.

▶ Seven simple sustainable farming practices that protect soil and water. · 4:34
Integrated pest management: use less without losing yield
Integrated pest management (IPM) uses scouting and thresholds to decide whether a spray is needed at all. The EPA describes four steps in IPM: set action thresholds, monitor and identify pests, prevent problems, and control them when the threshold is reached. A single pest in a field does not always mean action is needed.
- Set thresholds. Use extension thresholds for your crop and region, for example a set number of aphids per plant at a given growth stage.
- Scout and identify. Walk the field on a schedule and name the pest correctly. Many insects are harmless or helpful.
- Prevent. Rotate crops, choose resistant varieties, plant at the right time and keep field edges clean.
- Control. When the threshold is passed, pick the most targeted product and rotate modes of action.
The savings can be large. A study of 946 French arable farms in Nature Plants estimated that total pesticide use could be reduced by 42% without negative effects on productivity or profitability in 59% of the farms studied (Lechenet and colleagues, 2017). The result applied to most farms, not all, and depended on changes in rotations and practices, not only on spraying less.

▶ From blanket spraying to integrated pest management, and how GIS and remote sensing help target pest control. · 14:45
Precision application and satellite monitoring
Precision tools put chemicals only where they are needed. GPS guidance stops overlap at field edges. Section control shuts off boom sections over ground already sprayed. Variable-rate technology changes the fertilizer or seed rate across a field based on soil maps, yield maps or crop images. Spot sprayers use cameras to spray weeds rather than the whole field.
US use of these tools is growing but uneven. A USDA Economic Research Service report found that auto-steer and guidance systems rose from 5.3% of planted corn acres in 2001 to 58% in 2016, while yield maps, soil maps and variable-rate tools were used on only 5% to 25% of planted acres for winter wheat, cotton, sorghum and rice. Large farms adopt them far more than small ones.
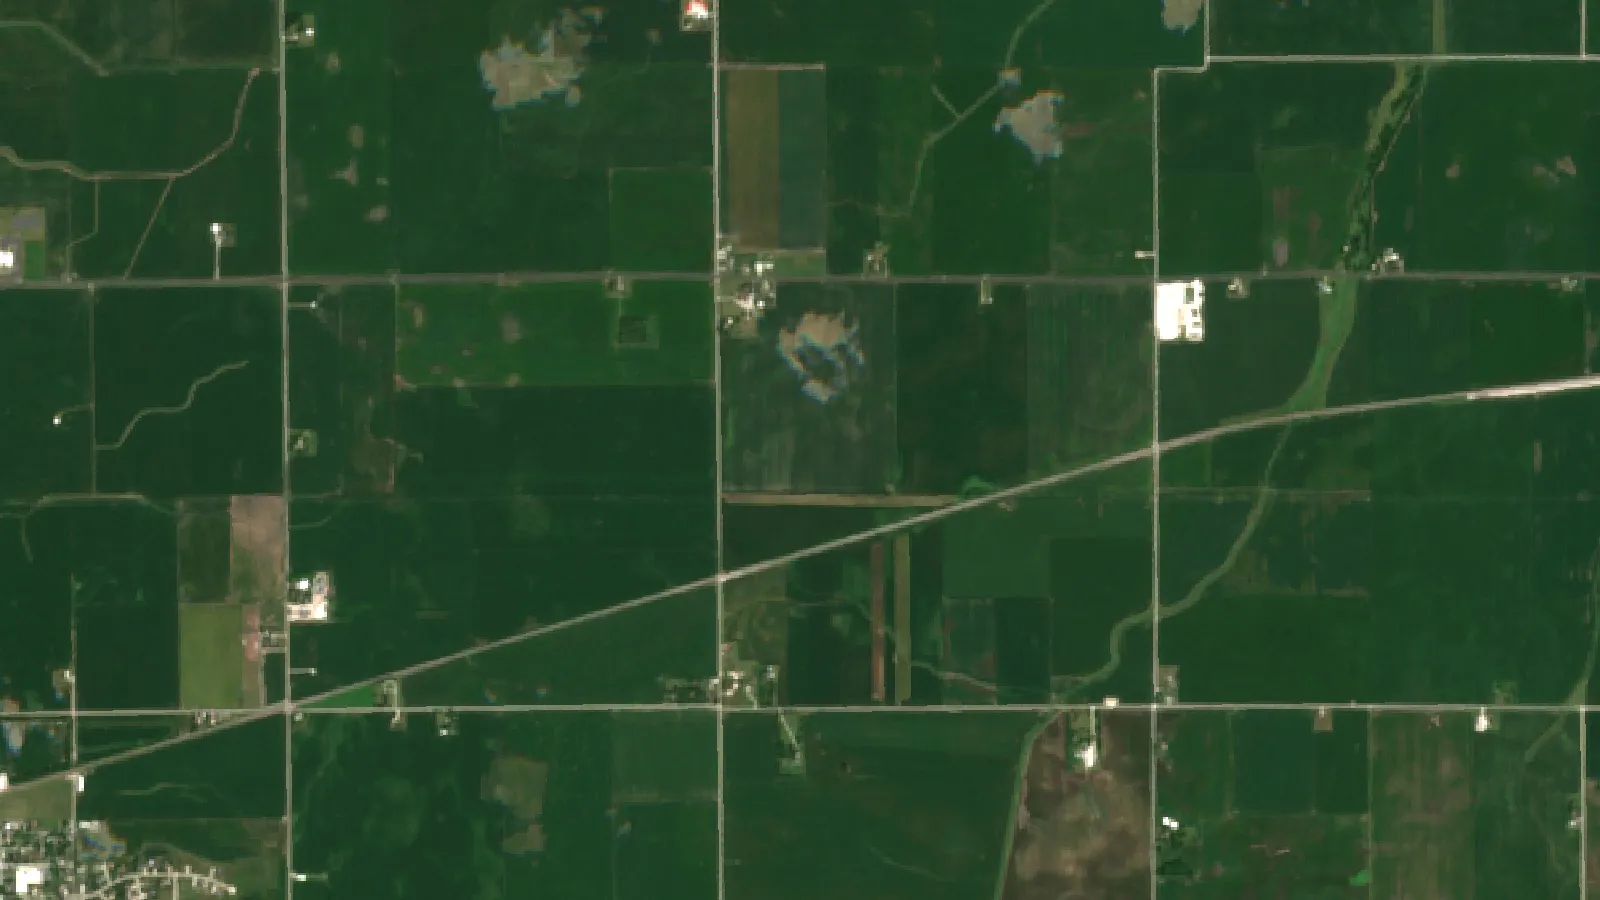
Satellite crop maps are a low-cost way to start. Vegetation indices such as NDVI show which parts of a field are growing well and which are lagging, so you can scout the weak zones first and decide whether a top-up of nitrogen or a fungicide is worth it. Farmonaut’s satellite crop monitoring app provides these maps for fields you draw once, on web, Android and iOS.

▶ Six plain steps to start precision farming without buying a robot, from field maps to satellite monitoring. · 4:18
How to choose and use agricultural chemicals: 7 steps
- Test the soil. Sample every two to four years and before big changes. Fertilize to the test and to a realistic yield goal.
- Compare on nutrient or active ingredient. Work out the price per pound of N, P2O5 or K2O, or per acre treated, not per bag or per jug.
- Scout before you spray. Use thresholds from your extension service, and confirm the pest or disease first.
- Read the whole label. Check the crop, rate, timing, buffer zones, re-entry and pre-harvest intervals and tank-mix limits.
- Calibrate equipment. A sprayer or spreader that is 10% off applies 10% too much or too little on every acre.
- Watch the weather. Avoid spraying in wind or before heavy rain, and do not leave urea on the surface in warm, damp weather if you can incorporate it or use an inhibitor.
- Keep records and check results. Leave an untreated or lower-rate strip, then compare yields at harvest.
Store products locked, dry and away from water sources. Triple-rinse empty containers and return them through a recycling scheme where one exists. This guide is general information: always check the label and local rules, and get professional advice for your farm.
Many of these steps link to wider farm planning. Lenders and insurers ask for input records, food buyers want to know what was applied, and climate programmes count fertilizer in a farm’s emissions. Related pages on our site: major crops and global food security, crop loans and insurance, product traceability, carbon footprint tracking, farm management dashboards, farm fleet tracking, weather and satellite data API, organic farming methods and corn yield by state.
FAQ
What chemicals do farmers use most?
By weight, fertilizers: about 201 million tonnes of N, P and K nutrients in 2020, against about 2.7 million tonnes of pesticide active ingredients (FAO). Among pesticides, herbicides are the largest group by sales value.
What are the common names for agricultural chemicals?
Fertilizers are often called by product: urea, anhydrous, UAN, DAP, MAP and potash. Pesticides are known by active ingredient, such as glyphosate, atrazine or chlorpyrifos, and by trade name. Growth regulators include chlormequat and ethephon.
Are agricultural chemicals safe?
Registered products are approved for the uses on their label after a risk review. Risk rises when labels are ignored: wrong rates, drift, missed re-entry times or poor storage. Wear the protective equipment the label lists, and keep products away from children and water.
How can farmers cut chemical costs?
Test soil, compare prices per pound of nutrient, scout before spraying, calibrate equipment and use variable-rate maps where they fit. The calculator above shows how to check whether a lower nitrogen rate pays on your own numbers.
Is chemical farming better than organic farming?
Each has trade-offs. Conventional systems usually reach higher yields per hectare. Organic systems avoid synthetic inputs and can earn a price premium. Many farms mix ideas from both, such as cover crops and IPM alongside targeted chemical use.
Farmonaut crop monitoring
See where your crop needs inputs
Draw your fields once and Farmonaut shows satellite vegetation maps through the season, so you can scout weak zones before you spray or top-dress, on web, Android or iOS.




Keep reading
Sources
- FAO, World Food and Agriculture Statistical Yearbook 2022: openknowledge.fao.org
- US EPA, Pesticides Industry Sales and Usage: 2008-2012 Market Estimates (2017): epa.gov
- DTN, UAN32 Leads Fertilizer Prices Higher (7 October 2026): dtnpf.com
- World Bank, Fertilizer consumption (kg per hectare of arable land), AG.CON.FERT.ZS: data.worldbank.org
- farmdoc daily, University of Illinois, Trends in Fertilizer Use and Efficiency in the U.S. (May 2025): farmdocdaily.illinois.edu
- US EPA, Glyphosate: epa.gov
- US EPA, Chlorpyrifos: epa.gov
- US EPA, Introduction to Pesticide Labels: epa.gov
- European Environment Agency, Pesticides in rivers, lakes and groundwater in Europe: eea.europa.eu
- US EPA, Integrated Pest Management (IPM) Principles: epa.gov
- Lechenet et al., Reducing pesticide use while preserving crop productivity and profitability on arable farms, Nature Plants (2017): nature.com
- USDA Economic Research Service, Precision Agriculture in the Digital Era: Recent Adoption on U.S. Farms (EIB-248): ers.usda.gov
- 4R Nutrient Stewardship: nutrientstewardship.org
Discussion
Questions, corrections or field experience? Share them below. First-time comments are reviewed before they appear, and your email is never published.
No comments yet. Be the first to add a question or your experience.

 WB Dev
 Sama Premium
 Mahaswami
 Prochecker
 Tres Valles
 LACOS Geoinformation
 Pulsar Supernova
 Magrifly
 LatConnect 60
 WebsEdge
 Blickwinkel
 Agricultural Credit Policy Council
 MCSOD
 Marei Nursery
 eKGIS
 Mostas Tech
 Andex
 FCF India
 Unifrutti Gulf
 Deluxe Conseil

 Licence holder · Niger · Gold
 Licence holder · Nigeria · Gold + lithium
 Client · Tanzania · Gold
 Client · Somalia · Gold
 Client & affiliate partner · Ghana · Gold










