

Climate · Farm practice guide
Climate-Smart Agriculture: 7 Practice Examples
Climate-smart agriculture aims to raise yields, help farms cope with weather extremes and cut emissions. Seven practices with dated evidence from the EPA, Defra, USDA and peer-reviewed studies, plus a calculator for legume cover crops.
Key takeaways
- Climate-smart agriculture has three pillars: productivity, adaptation and mitigation (FAO, World Bank).
- Farming made 11% of US greenhouse gas emissions in 2022 (EPA) and 12% of UK emissions; UK farming also made 70% of UK nitrous oxide and 49% of methane (Defra).
- Legume pre-crops raised the next crop’s yield by 20% on average across 462 field trials (meta-analysis, 2022).
- No-till alone lowered yields on average, but with residue cover and rotation it raised rainfed yields in dry climates (Nature, 2015).
- AWD in rice saves about 38% of water without hurting yields; the 2006 IPCC method assumes about 48% less methane.
In this article
- Climate-smart agriculture practices at a glance
- What is climate-smart agriculture?
- Why climate-smart agriculture matters on farms
- 1. Cover crops and legume rotations
- 2. No-till and crop residue cover
- 3. Nitrogen management
- 4. Water: alternate wetting and drying, and irrigation timing
- 5. Trees on farmland
- 6. Livestock and manure management
- 7. Precision farming and satellite monitoring
- More climate-smart agriculture examples from around the world
- Benefits and challenges of climate-smart farming
- How to start on your own farm
- FAQ
Climate-smart agriculture means farming in a way that does three jobs at once: keeps or raises yields and income, helps the farm cope with drought, heat and floods, and cuts greenhouse gas emissions where it can. Good examples of climate-smart agriculture practices are cover crops, no-till, careful nitrogen use, alternate wetting and drying in rice, trees on farmland, better manure handling and field monitoring by satellite. Each one below comes with numbers from a named source.
This guide is written for farmers in the US, Canada, the UK, Europe, Australia and New Zealand. It explains the idea in plain words, shows how much of each country’s emissions come from farming, and gives a calculator to test whether a legume cover crop could pay for itself in saved nitrogen. For how these ideas work on Australian farms, see climate-smart farming in Australia.
Climate-smart agriculture practices at a glance
The table lists seven practices. A practice counts as climate-smart when it serves at least one of the three aims and does not hurt the others badly. Each row has its own section below.
| Practice | Main aim it serves | What the evidence shows | Best fit |
|---|---|---|---|
| 1. Cover crops and legume rotations | Soil, yield, nitrogen | Legume pre-crops raised the next crop’s yield by 20% on average (meta-analysis, 2022) | Row-crop and mixed farms |
| 2. No-till and residue cover | Resilience in dry years | With residue and rotation, no-till raised rainfed yields in dry climates (Nature, 2015) | Dryland grain farms |
| 3. Nitrogen management | Lower nitrous oxide | Soil management caused 75% of US nitrous oxide in 2022 (EPA) | Any fertilized field |
| 4. Water: AWD in rice, irrigation timing | Water, methane | AWD saves about 38% of water without hurting yield | Rice and irrigated crops |
| 5. Trees on farmland | Resilience, carbon, shade | Agroforestry is found on more than 43% of farmland worldwide (FAO) | Pasture, field edges |
| 6. Livestock and manure | Methane | Manure is about 14% of US farm emissions (EPA) | Dairy, beef, pigs |
| 7. Precision and satellite monitoring | Efficiency, early warning | Auto-steer went from 5.3% to 58% of US corn acres, 2001-2016 (USDA ERS) | Large farms; satellite maps for any size |
What is climate-smart agriculture?
Climate-smart agriculture (CSA) is an approach promoted by the UN Food and Agriculture Organization (FAO). The overview on Wikipedia describes it as a set of farming methods with three main objectives. In short, the three pillars are:
- Productivity: grow more and better food, and earn more from it, without using up soil and water.
- Adaptation: make crops, animals and the whole business more able to handle heat, drought, floods and new pests.
- Mitigation: cut emissions per tonne of food, or store more carbon in soil and trees, where that is possible.
The World Bank uses the same three pillars. Its page on climate-smart agriculture notes that agrifood systems cause about one third of global greenhouse gas emissions, yet receive 4% of climate finance. That gap is one reason why most of the work falls on farmers’ own budgets.
CSA is not one fixed list. A practice that is smart on a wet Ohio corn farm may fail on a dry wheat farm in Saskatchewan or South Australia. The idea is to pick what fits your soil, your weather and your market, then measure the result.
Why climate-smart agriculture matters on farms
Farming is a smaller source of emissions than power or transport, but it is the main source of two strong gases: nitrous oxide from soil and fertilizer, and methane from cattle, manure and rice.
In the United States, the Agriculture sector accounted for 11% of greenhouse gas emissions in 2022, according to the EPA page on agriculture sector emissions. Farm emissions have risen by 8% since 1990. Soil management, such as fertilizer and manure on fields, caused 75% of all US nitrous oxide. Enteric fermentation in cattle and other ruminants is over a quarter of farm emissions.
The UK picture is similar. The Defra Agri-climate report 2024 estimates that farming made 12% of UK emissions in 2022, 70% of nitrous oxide and 49% of methane. UK farm emissions fell by 12% between 1990 and 2022, mainly through fewer cattle and sheep and less manufactured fertilizer.
The weather side matters just as much. Practices that hold water in the soil, protect the surface and spread risk across crops help a farm through bad years. That is the adaptation pillar, and it often brings a direct benefit to the farm itself.
Chart
Farming’s share of national emissions
Percent of each total in 2022, United States and United Kingdom
1. Cover crops and legume rotations
A cover crop is planted to protect and feed the soil, not to sell. Cereal rye, oats, clover, vetch and radish are common choices. Covers reduce erosion, hold leftover nitrogen through winter, add organic matter and can suppress weeds.
Legume covers also add nitrogen. According to the SARE guide to cover crops, red clover, crimson clover, vetch, peas and beans can fix 50-150 pounds of nitrogen per acre for the next crop, depending on growing conditions. Legumes are less good at catching nitrogen left after a cash crop; grasses such as rye do that job better.
Legumes in the rotation help yields too. A global meta-analysis of legume-based rotations pooled 11,768 yield observations from 462 field trials. It found that a legume before the main crop raised that crop’s yield by 20% on average, with larger gains where yields were low.
Adoption is growing, but farmers also drop the practice. A Choices article based on the Census of Agriculture found that US cover crop area rose by 5.0 million acres between 2012 and 2017. Without counties where it fell, the gain would have been 5.9 million acres. Planting cost, a short window after harvest and unclear payback are common reasons for quitting, so the calculator below helps you test the nitrogen side before you start.
Fertilizer rates and credits vary by soil and crop. Check your local extension guide and the product label, and get advice from a certified crop adviser before you cut nitrogen.
Try the numbers for your own farm below.
Calculator
Can a legume cover crop pay for itself in nitrogen?
Enter your own acres, nitrogen credit, nitrogen price and cover crop cost.
- Nitrogen value per acre: $36 US$/acre
- Net per acre: $0 US$/acre
- Nitrogen price needed to break even: $1 US$/lb N
Example values only, set near break-even; they are not a benchmark or a forecast. SARE reports that legume covers can fix 50-150 lb of nitrogen per acre, but the credit you can safely take depends on the stand, the soil and the next crop; ask your extension office or crop adviser. The result ignores soil, erosion and yield benefits and any cost-share payments.
▶ Seven simple ways to protect soil and water, explained with an earthworm called Wilma. · 4:34
2. No-till and crop residue cover
No-till means planting straight into last year’s stubble without plowing. Strip-till and other reduced-till systems sit in between. Less tillage saves fuel and time, keeps the soil covered, and leaves more water in the ground for the crop.
The yield effect depends on the setting. A study in Nature by Pittelkow and colleagues (2015) pooled 5,463 paired yield results from 610 studies. No-till alone lowered yields on average. Used together with residue cover and crop rotation, the yield loss became small, and in dry climates the full system raised rainfed yields. That is why no-till is a strong fit for dryland grain areas such as the Great Plains, the Canadian Prairies and much of Australia.
The Choices study found that US no-till area grew by 7.9 million acres between 2012 and 2017, but would have grown by 13.1 million acres if no farmers had gone back to tillage. Wet, cold soils, weed pressure and new equipment costs explain much of that.
Chart
US cover crop and no-till growth, 2012 to 2017
Million acres added, actual net gain vs gain if no county had cut back
3. Nitrogen management
Nitrogen is where many farms can cut emissions and costs together. Part of the nitrogen put on a field is lost as nitrous oxide, a gas far stronger than carbon dioxide. The usual guide is the “4R” approach: the right source, at the right rate, at the right time and in the right place.
- Test soil and use local rate guides, not round numbers.
- Split applications so the crop gets nitrogen when it can use it.
- Credit nitrogen from manure and legume crops before you buy more.
- Use variable-rate maps where parts of a field yield very differently.
These steps do not need new machines on every farm. A soil test, a yield map and a plan written before the season are a good start. Always follow the fertilizer label and any local rules on timing and buffer strips.
4. Water: alternate wetting and drying, and irrigation timing
Flooded rice fields release methane because the soil runs short of oxygen. With alternate wetting and drying (AWD), farmers let the water level drop below the soil surface for a few days before flooding again. A plastic field tube shows when to re-flood.
According to the summary on alternate wetting and drying, AWD can save about 38% of water without hurting rice yields, and the 2006 IPCC method assumes about 48% less methane than continuous flooding. AWD fits rice areas in Arkansas, California, Louisiana and the Murray-Darling Basin in Australia, where water is often costly.
For other irrigated crops, the same idea applies: water by soil moisture and crop need, not by the calendar. Soil moisture probes, weather forecasts and crop water-use maps all help a farmer skip an irrigation that the crop does not need.
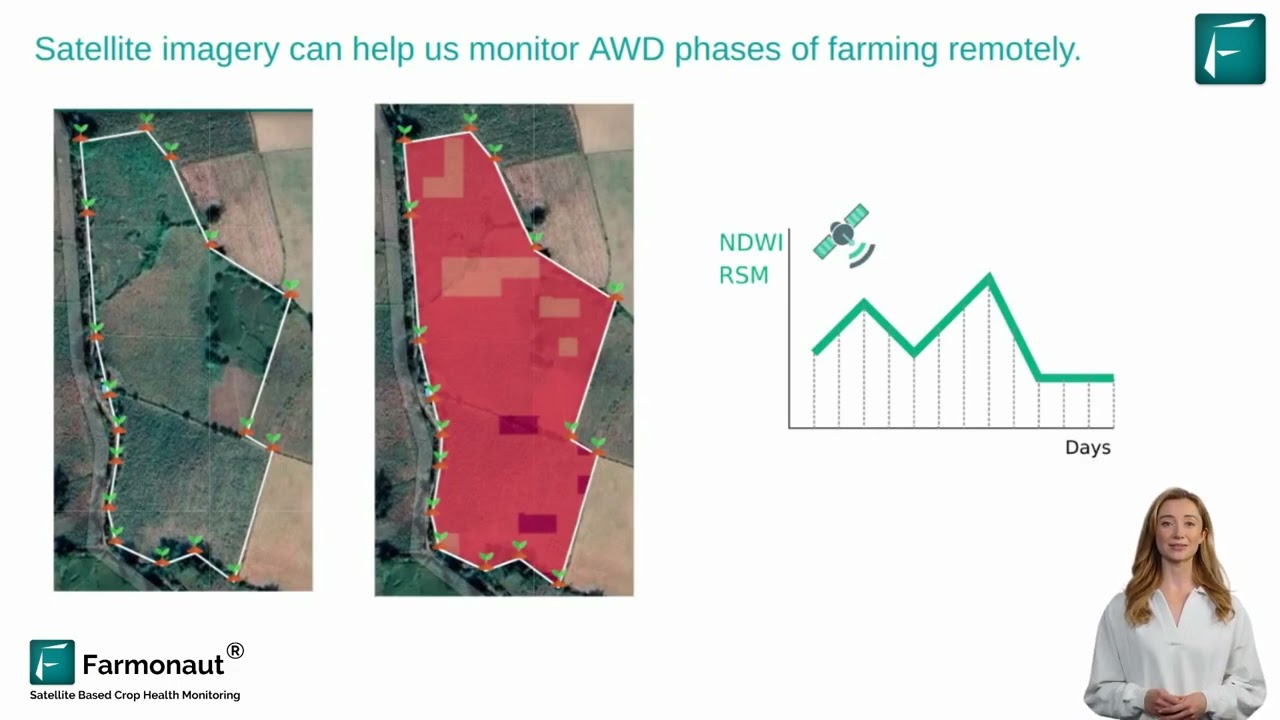
▶ How satellite data can detect the wet and dry phases of alternate wetting and drying in rice fields. · 4:03
5. Trees on farmland
Agroforestry means growing trees and shrubs with crops or animals. Shelterbelts, windbreaks, alley cropping, silvopasture (trees on grazing land) and riparian buffers along streams are common forms in North America and Europe.
Trees shade animals in heat waves, slow wind and soil loss, and store carbon in wood and roots. According to FAO’s agroforestry pages, agroforestry is found on more than 43% of all agricultural land worldwide, and such systems can reach 50-80% of the biodiversity of natural forests.
Two well-known examples come from dry regions. In Niger, farmers practise farmer-managed natural regeneration: they protect and prune tree stumps that regrow in their fields. In Zimbabwe and Niger, small planting basins catch rain at the root; the Wikipedia CSA overview reports three- to fourfold millet yield gains in Niger. None of these needs costly equipment, which is why they spread.
6. Livestock and manure management
Cattle, sheep and goats produce methane as they digest grass. Manure stored as a liquid in lagoons also makes methane. According to the EPA, manure management is about 14% of US farm emissions.
The EPA lists several ways to cut these gases:
- Adjust feed and herd management to reduce methane from digestion.
- Capture methane from covered manure storage and use it for energy.
- Handle manure as a solid or spread it on pasture, though this can raise nitrous oxide.
Grazing management helps too. Rotational grazing gives grass time to regrow, keeps more ground covered and can hold more water in the soil. Feed additives are newer; check local approval rules and talk to your vet or nutritionist before using them.
7. Precision farming and satellite monitoring
Precision tools help a farmer put seed, fertilizer and water only where they are needed. Less waste means lower costs and fewer emissions per bushel.
Chart
Auto-steer and guidance use on US crops
Percent of planted acres using auto-steer or guidance systems
Uptake is uneven. A USDA ERS report on precision agriculture found that auto-steer and guidance were used on 5.3% of planted corn acres in 2001 and 58% in 2016. Yield maps, soil maps and variable-rate tools were used on only 5-25% of acres for winter wheat, cotton, sorghum and rice. Smaller farms used these tools far less than large ones.
Satellite crop monitoring narrows that gap, because it needs no machine on the farm. Vegetation maps from Sentinel-2 and similar satellites show which parts of a field are stressed, wet or behind. A grower can then scout those spots first, check whether a cover crop has established, or see how a field responds to a change in nitrogen. Farmonaut offers this kind of field-level satellite view on web, Android and iOS.

▶ A step-by-step tutorial on monitoring crops by satellite and AI in the Farmonaut web app. · 8:43
More climate-smart agriculture examples from around the world
Many programmes now pay farmers to try these practices. In the US, conservation programmes run by the Natural Resources Conservation Service share the cost of cover crops, nutrient plans and buffers. Canada, the UK, the EU and Australia run similar schemes; check your local agriculture department for what is open now, as programme names and rules change often.
Examples that work at scale include:
- Dryland grain, Canadian Prairies and Australia: no-till with stubble kept on the surface to save moisture.
- Corn and soybeans, US Midwest: cereal rye cover crops, split nitrogen and variable-rate maps.
- Dairy, UK and New Zealand: covered slurry storage, careful spreading and better grass use.
- Rice, US South and California: AWD and laser-leveled fields that drain evenly.
- Mixed farms, Europe: hedgerows, buffer strips and longer rotations with legumes.
Carbon tracking and traceability are growing parts of the picture, as food buyers ask for proof. Records from carbon footprinting and product traceability tools can support those claims.
Benefits and challenges of climate-smart farming
The benefits are real but uneven. Practices that save inputs, such as better nitrogen timing and irrigation by need, often pay in the first season. Practices that build soil, such as cover crops and no-till, can take several years to pay, and may cost yield at first.
Common barriers are:
- Upfront cost: seed, a no-till drill or a manure cover.
- Learning time: a new system can take three or more seasons to settle.
- Weather risk: a wet spring can delay planting into a cover crop.
- Proof: buyers, lenders and programmes want records of what was done.
Good records help with all four. Lenders and insurers increasingly use field data; see our page on crop loan and insurance for how satellite data supports that. For a wider plan, our guide to climate resilience in agriculture covers farm-level risk steps.
How to start on your own farm
- Pick one problem. Erosion, high nitrogen bills, dry summers or wet springs. Choose the practice that fits it.
- Start small. Try a cover crop or no-till on one field, next to a normal field, for at least three years.
- Run the numbers. Use the calculator below for legume cover crops, and ask your extension office for local costs.
- Measure. Keep yields, input costs, soil tests and satellite crop maps for both fields.
- Ask about cost-share. Many programmes pay part of the first years.
Set clear goals before you begin; our page on farming goals and objectives shows how to write them down. Weather data matters too; developers can use the satellite and weather API in their own farm tools.
FAQ
What are examples of climate-smart agriculture?
Cover crops, legume rotations, no-till, nitrogen management, alternate wetting and drying in rice, agroforestry, better manure handling and precision or satellite monitoring. Each serves at least one of the three aims: yield, resilience and lower emissions.
What are the three pillars of climate-smart agriculture?
Raising productivity and income, adapting to climate change, and reducing or removing greenhouse gas emissions where possible. The FAO and the World Bank both use these three pillars.
What does climate-smart agriculture look like on a small farm?
Often it means low-cost steps: keeping the soil covered, rotating crops with legumes, testing soil before buying fertilizer, planting a windbreak and watering by need. Satellite crop maps work on a few acres as well as on thousands.
Do cover crops pay for themselves?
Sometimes in year one, more often over several years. A legume cover can supply 50-150 pounds of nitrogen per acre (SARE). Whether that covers seed and planting depends on your nitrogen price and how much credit your adviser allows.
Does no-till reduce yields?
On average a little, when used alone. Combined with residue cover and rotation, the loss shrinks, and in dry climates the full system raised rainfed yields in a large 2015 study in Nature.
Related pages on our site: fleet management · farm admin dashboard · mobile app download
Farmonaut crop monitoring
See your own fields from space
Draw your fields once and Farmonaut shows satellite vegetation maps for them through the season, on web, Android or iOS.




Keep reading

Sources
- US EPA, Agriculture Sector Emissions (2022 inventory data): epa.gov
- Defra, Agri-climate report 2024 (updated November 2025): gov.uk
- World Bank, Climate-Smart Agriculture topic page: worldbank.org
- Wikipedia, Climate-smart agriculture: en.wikipedia.org
- Wikipedia, Alternate wetting and drying: en.wikipedia.org
- SARE, Cover Crops resources: sare.org
- Zhao et al., Global systematic review with meta-analysis reveals yield advantage of legume-based rotations, Nature Communications (2022): pmc.ncbi.nlm.nih.gov
- Choices, Pervasive disadoption substantially offsets new adoption of cover crops and no-till (3rd quarter 2024): choicesmagazine.org
- Pittelkow et al., Productivity limits and potentials of the principles of conservation agriculture, Nature (2015): nature.com
- FAO, Agroforestry: fao.org
- USDA ERS, Precision Agriculture in the Digital Era (EIB-248): ers.usda.gov
Discussion
Questions, corrections or field experience? Share them below. First-time comments are reviewed before they appear, and your email is never published.
No comments yet. Be the first to add a question or your experience.

 Field Capacity
 Abhishta Agri
 SP Farms
 Indosistim Teknologi
 Liquify Digital
 CU Foods
 BeyondTech Global
 Rouge VC
 AgroGreen Dynamics
 AgroRisk
 Oath Inc
 Reddane Farming
 Esri North East Africa
 Cresol
 MDCV UK
 Etech Consulting Madagascar
 Vestlandsforsking

 Exploration consultancy · South Africa · Gold
 Licence holder · Niger · Gold
 Client · Tanzania · Gold
 Client · Somalia · Gold










