

Reviewed September 2026 against USDA Farm Service Agency, USDA NASS, and the Soil Health Institute.
Try it: Run your own numbers →
To restore agricultural land, farmers combine soil-rebuilding practices — cover cropping, reduced tillage, agroforestry, and enrollment in programs like the USDA’s Conservation Reserve Program (CRP) — with satellite monitoring to track whether the land is actually recovering. The fastest wins come from practices that keep soil covered and roots in the ground year-round; the CRP alone shows what’s possible at scale, with 22.9 million acres enrolled and $1.8 billion in annual rental payments in fiscal year 2023, according to the USDA Farm Service Agency.
This matters because degraded cropland is not a hypothetical problem. USDA’s National Resources Inventory found that about 18% of cultivated cropland had water-driven erosion above its soil loss tolerance, and about 14% had excess wind-driven erosion (USDA ERS). Below are seven restoration techniques used on US, UK, and EU farmland, what each one actually delivers, and how to verify progress on your own acres rather than take anyone’s word for it.
What Land Restoration Actually Means
Land restoration is the deliberate process of reversing degradation on farmland — rebuilding soil structure, organic matter, and biological activity that intensive cropping, erosion, or drainage have depleted. Agricultural restoration differs from generic ecological restoration in one important way: the goal is not to return land to wilderness, but to restore its productive function while rebuilding the ecosystem services (water infiltration, nutrient cycling, pest regulation) that make that productivity durable.
Restoration farming sits between two extremes. On one side is intensive farming, which maximizes short-term output through heavy inputs and monocultures — the practice most responsible for the degradation restoration now has to fix. On the other is untouched conservation land, which restores ecological function but produces no food or income. Restoring land for continued farming means finding the point between them: enough disturbance to harvest a crop, little enough to let soil biology recover.
Farms looking for that middle ground can draw on sustainable farm methods that keep land productive.

Why Restoring Agricultural Land Pays Off
The economic case for reviving agriculture on degraded ground is no longer a sustainability talking point — it shows up in yield data. In a Soil Health Institute study of 100 farms in nine states, 67% of farmers using soil health management systems (typically no-till plus cover crops) reported higher yields, and net income rose by an average of $51.60 an acre for corn and $44.89 for soybean (Soil Health Institute). That is a direct financial return on restoration practices, not a projected co-benefit.
Improving land also protects against the cost side of the ledger. Soil erosion strips the most fertile topsoil first, and replacing lost fertility with synthetic inputs is expensive and temporary. The cost of that loss rises with fertilizer prices, since eroded nutrients have to be replaced. Restoring land management now, through sustainable land use practices, is cheaper than perpetually re-purchasing the fertility erosion removes.
- Restores degraded land and reverses productivity loss measured in USDA erosion data
- Improves soil health by rebuilding organic matter and microbial populations
- Cuts input costs as reported by the Soil Health Institute’s 30-farm cohort
- Sequesters carbon — CRP land averages 0.8 Mg C/ha/yr in soil carbon gains, per a 2024 PLOS ONE/USDA study
- Reduces flood and drought risk through improved water infiltration
7 Land Restoration Techniques for Farmland
These are the techniques most widely used across US and European farming operations to restore agricultural land while keeping it in production.
1. Cover Cropping: The Fastest Way to Restore Soil Cover
Cover cropping is the single most measurable land restoration technique in US agriculture today, because USDA NASS tracks adoption directly. National cover crop adoption stood at 4.7% of cropland acres in 2022, according to USDA NASS data reported by USDA ERS. Adoption is far from uniform: Maryland had the highest rate of any state in the 2022 Census, and use is more common in the South and East than in colder, drier regions (USDA ERS).
- Restoring land starts with keeping roots in the soil between cash crops — bare fallow ground is where erosion losses concentrate.
- Cover crops such as cereal rye, clover, and radish reduce nitrogen and phosphorus runoff, protect against wind and water erosion, and add organic matter as residue breaks down.
- Adoption gap: at 4.7% national uptake versus 27.3% in the leading state, most US cropland has substantial room to add cover crops before hitting any regional ceiling.
Because USDA NASS updates cover crop adoption trends annually through its Newsroom and statistics releases, and runs the full Census of Agriculture every five years (next full Census: 2027), check USDA ERS’s Charts of Note for the current national figure before citing this one as still accurate.
2. Conservation Agriculture: No-Till and Permanent Soil Cover
Conservation agriculture techniques combine minimal soil disturbance (no-till or strip-till), permanent soil cover, and crop rotation diversity. Unlike cover cropping alone, conservation agriculture changes how the cash crop itself is planted and managed.
- Improving soil fertility: undisturbed soil retains organic matter and fungal networks that tillage breaks apart.
- Water efficiency: surface residue reduces evaporation and improves rainfall infiltration, cutting irrigation demand on affected acres.
- Erosion reduction: permanent cover is the direct counter to the erosion volumes USDA-NRCS has documented on conventionally tilled cropland.
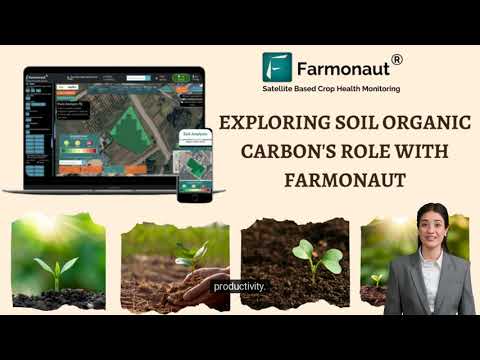
Read the underlying principles at Wikipedia’s conservation agriculture overview. Farmers can track soil moisture and residue cover through satellite monitoring, with results fed into farm management software via API-based integration.
3. Conservation Reserve Program Enrollment: Paid Land Retirement
For land too degraded to farm profitably in the near term, the USDA’s Conservation Reserve Program pays farmers to take marginal or environmentally sensitive acres out of production and plant permanent cover instead. As of fiscal year 2023, CRP covered 22.9 million acres nationally, with $1.8 billion paid out in annual rental payments, per the USDA Farm Service Agency.
- CRP is a direct income source during restoration, not just a cost — rental payments replace lost cropping revenue on marginal acres.
- Contract lengths typically run 10 to 15 years, giving degraded soil enough time to rebuild organic matter under permanent grass or tree cover.
- The USDA Farm Service Agency updates CRP enrollment and payment figures quarterly; check USDA FSA’s Conservation Reserve Program page for the current acreage and fiscal-year spending before relying on the FY2023 figures above.
4. Agroforestry: Integrating Trees for Long-Term Soil Health
Agroforestry systems combine trees with crops or livestock on the same land — an ancient practice increasingly used to restore degraded cropland edges, waterways, and windbreak zones.
- Nitrogen-fixing tree species improve soil fertility and reduce erosion along field margins.
- Tree cover creates habitat corridors that increase on-farm species diversity.
- Root systems sequester carbon below ground in addition to aboveground biomass.
Learn the fundamentals at Wikipedia’s agroforestry overview. For operations combining agroforestry with row-crop management, sustainable productivity strategies help balance tree establishment costs against near-term cropping income.

Monitoring mixed tree-and-crop land requires tracking two different canopy signatures at once. Farmonaut’s Large-Scale Farm Management solution provides real-time crop health insights across diversified land uses on a single dashboard.
5. Silvopasture: Trees, Forage, and Livestock Together
Silvopasture integrates trees, forage plants, and grazing animals into one system, restoring degraded pasture while adding a second income stream.
- Trees provide shade and shelter, reducing heat stress on livestock and improving weight gain in warm months.
- Grazing animals distribute manure and nutrients, cycling fertility back into the soil without synthetic inputs.
- Ground cover under trees protects against the same erosion mechanisms driving the USDA-NRCS’s 1.70-billion-ton annual soil loss estimate.
Full technical detail is available at Wikipedia’s silvopasture entry. Satellite vegetation-health monitoring supports silvopasture design by identifying where shade-tree placement will do the most good for forage growth.

6. Assisted Natural Regeneration: Low-Cost Recovery on Abandoned Ground
Assisted Natural Regeneration (ANR) protects and nurtures naturally sprouting tree seedlings on abandoned or degraded fields rather than replanting from scratch.
- Farmers manage competing undergrowth and protect seedlings from grazing or fire, at a fraction of full-replanting cost.
- Best suited to large-scale restoration where labor and capital for replanting are limited.
- Local, already-adapted species reestablish faster than introduced nursery stock.
Details at Wikipedia’s Assisted Natural Regeneration page. Satellite change-detection can map regeneration progress across large abandoned tracts, directing limited labor to the highest-value zones first.
7. Wetland and Peatland Restoration: Paludiculture
Paludiculture is sustainable farming or forestry on rewetted peatlands, replacing the drainage that turns peat into a major CO₂ source. Instead of draining wetlands for row crops, paludiculture cultivates species that thrive in waterlogged soil — reeds, sedges, sphagnum, and berry plants.
- Rewetting stops the large carbon releases associated with drained peat oxidation.
- Restored wetlands filter nutrients and purify water moving downstream — directly relevant where farm drainage has degraded watershed water quality.
- Harvested biomass can supply construction materials and specialty horticultural products, giving landowners a return during restoration.
More detail at Wikipedia’s paludiculture page. Where paludiculture and cropland restoration overlap — buffer strips along drained ditches, for instance — pairing wetland rewetting with soil carbon sequestration practices on adjacent acres compounds the carbon benefit.

Comparison Table: Which Restoration Technique Fits Your Land
Use this table to match a technique to your starting condition, timeline, and available capital. Ranges reflect commonly reported outcomes across the practices described above; where a national-level verified figure exists (cover crops, CRP), it is cited separately in the sections above rather than compressed into this table.
| Restoration Technique | Time to First Measurable Soil Benefit | Upfront Cost vs. Continued Cropping | Income During Restoration | Best Suited To |
|---|---|---|---|---|
| Cover Cropping | 1-2 growing seasons | Low — seed and one extra pass | Full — cash crop continues | Any row-crop acreage, especially erosion-prone slopes |
| Conservation Agriculture (no-till) | 2-4 years | Low-Moderate — equipment transition | Full — cash crop continues | Row crops on compacted or erosion-prone soils |
| CRP Enrollment | 3-5 years (permanent cover establishes) | None — USDA pays rental rate | Fixed rental payment, no crop income | Marginal, flood-prone, or highly erodible acres |
| Agroforestry | 3-7 years (tree establishment) | Moderate — tree stock and labor | Reduced short-term, diversified long-term | Field margins, waterways, windbreak zones |
| Silvopasture | 3-6 years | Moderate — tree stock, fencing | Livestock income continues | Degraded pasture and grazing land |
| Assisted Natural Regeneration | 2-5 years | Low — labor for seedling protection only | None during active regeneration | Abandoned fields, deforested tracts |
| Paludiculture | 2-4 years post-rewetting | Moderate-High — rewetting infrastructure | Alternative biomass products | Drained peatland and wetland-adjacent farmland |
A first-year plan for restoring a degraded field
Most restoration fails because it starts with a practice rather than a diagnosis. A simple sequence for the first twelve months:
- Test the soil. Take samples from the worst and best parts of the field for organic matter, pH, phosphorus, potassium and, where salinity is suspected, electrical conductivity. Keep the results as your baseline.
- Find where soil is leaving. Walk the field after heavy rain and look for rills, gullies and sediment at field edges. On flat, dry ground, look for drifted soil along fences.
- Map the weak zones. Compare several seasons of satellite vegetation images or yield maps. Areas that are poor every year usually have a soil problem, not a weather problem.
- Match a practice to each zone. Keep cash crops on productive ground and add a cover crop after harvest. Consider permanent cover, a buffer strip or program enrollment for the areas that lose money every year.
- Ask about cost-share before you buy seed. In the US, the local NRCS or Farm Service Agency office can say which programs and sign-up windows apply to your land. In the UK and EU, check the current national agri-environment scheme.
- Re-test in the same spots. Organic matter moves slowly, so compare soil tests every two to three years and vegetation trends every season.
Write each step down. Records of what you did and when also help when applying for program payments or farm finance.
Soil Recovery Timeline Calculator
The table above gives typical ranges; this calculator applies them to your own acreage and CRP-style rental context so you can compare the cost and timeline of restoring your specific land.
Run your own numbers
Assumptions: recovery timelines are averages drawn from the ranges in the comparison table above, not a guarantee for any specific soil type or climate. The default carbon rate (0.8 Mg C/ha/yr) is an illustrative assumption; your land may sequester faster or slower depending on baseline soil carbon and starting condition. This tool excludes equipment, labor, and seed costs — use it for timeline and payment comparison only.
How to Verify Restoration Is Working
The durable part of any restoration plan is not the technique you pick — it’s the method you use to confirm it’s working, since that method still applies whatever the current adoption numbers or payment rates happen to be. Three checks apply regardless of which of the seven techniques above you choose:
- Track vegetation index trends over multiple seasons, not one snapshot. A single healthy-looking satellite image after a good rain proves nothing; look for a rising trend across at least 2-3 growing seasons.
- Compare adoption against your state or region’s baseline. If your state’s cover crop adoption rate is published by USDA NASS, check whether you’re above or below it — that tells you whether local agronomic conditions or economics are the limiting factor.
- Re-check the source data annually. USDA NASS updates cover crop trends yearly and runs the full Census of Agriculture every five years (next: 2027); USDA FSA updates CRP acreage and payments quarterly; USDA’s National Resources Inventory measures erosion every five years, with the most recent comprehensive assessment from 2017. Numbers this article cites will age — the check itself will not.
Two gaps worth naming plainly rather than guessing at: national data does not break out state-level EQIP or CSP (Environmental Quality Incentives Program / Conservation Stewardship Program) enrollment and spending for the most recent years, and there is no unified national dataset quantifying nitrogen and phosphorus runoff reduction directly attributable to CRP and conservation tillage — EPA and USGS water-quality monitoring exists, but a single consolidated baseline does not. For program-specific numbers on your land, contact your local USDA Farm Service Agency or NRCS field office directly.
Monitoring Tools for Restoration Progress
Verifying restoration over years, not weeks, requires consistent monitoring — the same field checked the same way each season. Farmonaut provides satellite-based tools for exactly that comparison.
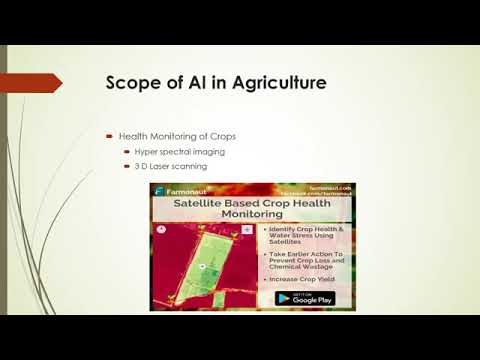
- Satellite-Based Crop Health Monitoring: tracks vegetation health, soil moisture, and field variation over time, supporting the season-over-season comparison restoration verification depends on.
- AI-Based Jeevn Advisory: delivers weather and crop-management guidance to support restoration decisions in-season.
-
Blockchain Product Traceability:
Farmonaut’s blockchain-based traceability solutions document the farm-to-consumer journey for products grown on restored land.
- Fleet and Resource Management: Farmonaut’s fleet management tools coordinate logistics across large restoration projects spanning multiple fields.
-
Carbon Footprinting for Agriculture Innovation:
Farmonaut’s carbon footprinting tool tracks emissions and helps verify sequestration progress against a farm’s own baseline.
- API Integration: developers can pull satellite data into custom dashboards via the Farmonaut API.
For cooperatives, agribusinesses, or public-sector programs managing restoration across many farms at once, Farmonaut’s Large-Scale Farm Management platform consolidates monitoring across multiple properties.



Note: Farmonaut never sells farm inputs or machinery and is not a regulatory authority. We focus on providing intelligent, data-driven monitoring and farm management tools for agricultural stakeholders.
Overcoming Common Obstacles to Land Restoration
Restoring degraded farmland runs into the same handful of obstacles regardless of technique or region.
-
Timeframe for returns: agroforestry and silvopasture take 3-7 years before producing full economic returns.
Solution: blend fast and slow practices — cover crop or graze annual forage for near-term income while trees establish. -
Knowledge and training gaps: transitioning away from conventional tillage and chemical-intensive management requires new skills.
Solution: use monitoring tools such as Farmonaut’s Jeevn AI advisory, and work with a local USDA NRCS or Extension office for technical assistance. -
Program complexity and incentive access: CRP, EQIP, and CSP each have different eligibility rules, and state-level enrollment data for the newest program years is not always publicly consolidated.
Solution: contact your county USDA Farm Service Agency office directly for current sign-up periods and payment rates rather than relying on national averages. -
Risk management: weather variability, pest pressure, and market swings can discourage experimentation.
Solution: diversify income sources, monitor field health with satellite tools, and insure crops where available. See Farmonaut’s crop loan and insurance advisory for verification-based options. -
Access to upfront capital: restoration often requires investment before any return arrives.
Solution: satellite-verified farm monitoring records can support loan and insurance applications by documenting land condition and management history over time.
FAQ: Restoring Agricultural Land
- Q: What is the fastest way to restore agricultural land?
- A: Cover cropping shows measurable soil benefits within 1-2 growing seasons and requires the smallest upfront investment of the seven techniques covered here, since the cash crop rotation continues uninterrupted.
- Q: How many acres are enrolled in US land restoration programs?
- A: The Conservation Reserve Program covered 22.9 million acres in fiscal year 2023, with $1.8 billion paid in annual rental payments, per the USDA Farm Service Agency. Check the FSA’s CRP page for the current figure, since enrollment is updated quarterly.
- Q: What percentage of US farms use cover crops?
- A: 4.7% of US cropland acres nationally as of 2022, per USDA NASS data via USDA ERS — with wide state variation; Maryland had the highest rate in 2022.
- Q: Does restoring farmland actually improve yields, or just soil metrics?
- A: Both. In a Soil Health Institute study of 100 farms, 67% of farmers using soil health management systems reported higher yields, and net income rose for 85% of corn growers — a direct productivity return, not only an ecological one.
- Q: How is land restoration different from ecological restoration in general?
- A: Land restoration for farming keeps the land in production while rebuilding soil health, using practices and land management strategies such as cover crops and reduced tillage. Broader ecological restoration can include retiring land entirely, as CRP enrollment does.
- Q: How does Farmonaut support land restoration efforts?
- A: Farmonaut provides satellite monitoring, AI advisory, carbon footprint tracking, and blockchain traceability — helping farmers and agribusinesses track restoration progress against their own field history season over season.
To monitor your own restoration progress, try Farmonaut on Web, Android, or iOS.
Conclusion: Restore the Land, Keep Farming It
Restoring agricultural land does not require choosing between production and recovery. Cover cropping, conservation agriculture, CRP enrollment, agroforestry, silvopasture, assisted natural regeneration, and paludiculture each offer a path to rebuild soil health while keeping land productive or generating alternative income during the transition. The USDA figures cited throughout — 22.9 million CRP acres, 4.7% national cover crop adoption, 67% of farmers in a 100-farm study reporting yield gains from soil health systems — describe where US agriculture stands as these programs are measured; each will move as USDA NASS, FSA, and the Soil Health Institute publish updated figures, and the sources linked above are where to find the current numbers.
What does not expire is the method: pick a technique matched to your land’s condition and timeline, verify progress through consistent field monitoring rather than a single season’s appearance, and check the primary source data annually rather than relying on any one year’s snapshot — including this one.

 Escorts Kubota
 FieldZero
 Indico Company
 Kubota
 FFBS
FFBS Jontra
 Kalustyan
 Tucor
Tucor Geno
Geno Hayleys Agriculture
 Linx Agritech
 Adinet
 Save Your Soils
