

Reviewed August 2026 against USDA’s National Agricultural Statistics Service and Agricultural Research Service, and Market Research Future’s agtech market models.
Table of Contents
- Introduction: What the Numbers Actually Say
- Fast Facts: 5G and Indoor Farming Market Snapshot
- 5G Smart Farming Market: Global Size and What “5G” Means Here
- US 5G Smart Farming Market
- Argentina 5G Smart Farming Market
- GCC 5G Smart Farming Market
- Understanding Smart Indoor Farming Systems
- Indoor Farming Robots Market: Global and US
- Indoor Farming Automation: What an Automated Indoor Farm Actually Runs
- Automated Hydroponic Gardening System & Indoor Farming Technology Market
- Calculator: Indoor Farm Automation Payback
- Technological Foundations: IoT, AI, Robotics, Cloud Control
- Advantages Over Traditional Agriculture
- Growth Drivers and a Financing Use Case
- Farmonaut AI & Satellite Platforms
- Challenges & The Path Forward
- Frequently Asked Questions
- Conclusion
US 5G Smart Farming Market Size, Plus Argentina & GCC
Global spend tracked as the 5G smart farming market stood at $25.13 billion in 2025, headed toward $126.07 billion by 2035 at a 17.5% compound annual growth rate, according to Market Research Future. North America holds 45% of that total. Argentina’s narrower IoT-in-agriculture market — the closest tracked proxy for “Argentina 5G smart farming market” — was $56.48 million in 2024, projected to $156.89 million by 2032, per DataBridge Market Research. The GCC’s connected-agriculture market was $114.77 million in 2025, projected to $507.27 million by 2035.
Indoor farming automation — the robots, hydroponic controllers, and vertical racks that make up a smart indoor farming system — is a separate, smaller market. Indoor farming robots alone were valued at $2.62 billion globally in 2025, rising toward $9.61 billion by 2035. The rest of this guide breaks down each market by geography and by technology, with sourced tables, four charts, and a calculator so you can size an automation payback for your own operation.



Fast Facts: 5G and Indoor Farming Market Snapshot
- Global 5G smart farming market: $25.13B (2025) → $126.07B (2035), 17.5% CAGR, per Market Research Future; a separate model from Polaris Market Research puts 2025 at $25.63B rising to $113.16B by 2034 (18.24% CAGR).
- North America share: 45% of the global 5G smart farming total in 2025 — the closest published stand-in for a standalone US figure.
- Argentina IoT-in-agriculture: $56.48M (2024) → $156.89M (2032), 15.71% CAGR.
- GCC connected agriculture: $114.77M (2025) → $507.27M (2035), 16.02% CAGR.
- Indoor farming robots: $2.62B (2025) → $9.61B (2035), 13.88% CAGR.
- Automated hydroponic gardening systems: $1.87B (2025) → $5.42B (2035), 11.23% CAGR.
- Try it: Result
5G Smart Farming Market: Global Size and What “5G” Means Here
Most “5G smart farming market” reports bundle cellular 5G with the broader IoT connectivity stack — sensors, gateways, and edge compute that run on whichever network a farm has, not strictly the 5G radio standard. That matters for reading Argentina’s numbers: within Argentina’s IoT-in-agriculture market, Wi-Fi is still the largest connectivity segment at $22.48 million (2024) and also the fastest-growing at a 16.47% CAGR, ahead of cellular options, per DataBridge Market Research. Hardware is the largest offering segment at $41.29 million (2024, 15.95% CAGR), and precision farming is the largest use case at $20.90 million (2024, 16.32% CAGR).
The table below lines up the global baseline against the three geography-specific figures this article was written to answer.
| Market | Base Year Value | Forecast Year Value | CAGR | Source |
|---|---|---|---|---|
| Global 5G smart farming | $25.13B (2025) | $126.07B (2035) | 17.5% | Market Research Future |
| Global 5G smart farming (alternate model) | $25.63B (2025) | $113.16B (2034) | 18.24% | Polaris Market Research |
| North America share of global 5G smart farming | 45% (2025) | — | — | Market Research Future |
| Argentina IoT in agriculture | $56.48M (2024) | $156.89M (2032) | 15.71% | DataBridge Market Research |
| GCC connected agriculture | $114.77M (2025) | $507.27M (2035) | 16.02% | Market Research Future |
US 5G Smart Farming Market
No research firm in this review publishes a standalone US dollar figure for 5G smart farming; the number that exists is North America’s 45% regional share of the $25.13 billion global 2025 total (Market Research Future). Run that math and North American 5G-enabled farm technology spend works out to $11.3 billion in 2025 — a derived figure, not a directly published one, since the public report stops at the regional level. For a country-level number specific to your operation’s state or crop, Market Research Future’s full report (linked above) sells a country breakout; absent that purchase, the 45% share is the most defensible public data point.
The scale this connectivity spend is chasing is documented separately by USDA. The 2022 Census of Agriculture, released February 13, 2024, counted 1.9 million US farms and ranches producing $543 billion in agricultural products against $880 million acres of farmland — a base large enough that even single-digit 5G/IoT penetration moves real dollars. On the return side, Polaris Market Research’s 5G smart farming analysis cites USDA figures showing precision-agriculture adoption can lift crop yields by up to 15% while cutting input costs 10% to 15%, which is the economic case vendors use to sell 5G-linked sensor and irrigation packages to US operations.
For indoor production specifically, USDA’s Census of Horticultural Specialties is the only nationwide census that separately tracks “food crops grown under protection” — the closest official proxy for US indoor and controlled-environment vegetable output. The 2024 edition is the current release; NASS re-runs this census on its own multi-year cycle, so check that page directly for the next update rather than relying on a fixed number here.
Argentina 5G Smart Farming Market
Argentina’s IoT-in-agriculture market was valued at $56.48 million in 2024 and is projected to reach $156.89 million by 2032, a 15.71% CAGR over 2025–2032, per DataBridge Market Research. Within that total, large farms are the biggest customer segment at $24.36 million (2024, 16.38% CAGR) — consistent with Argentina’s export-scale grain and soy operations driving early connectivity spend ahead of smaller mixed farms. Precision farming applications lead by use case at $20.90 million (2024), growing at 16.32% CAGR, the fastest of any agriculture-type segment tracked in the report.
A country-specific “5G smart farming” dollar figure separate from this broader IoT number is not separately published by the sources reviewed here; the IoT-in-agriculture total above is the closest tracked proxy, and it already captures hardware, connectivity, and precision-farming software spend together.
GCC 5G Smart Farming Market
The GCC’s connected-agriculture market — covering the UAE, Saudi Arabia, Qatar, and neighboring states as a bloc — was valued at $114.77 million in 2025 and is projected to reach $507.27 million by 2035, a 16.02% CAGR, per Market Research Future. The report attributes growth to national food-security programs, citing the UAE’s National Food Security Strategy and Saudi Arabia’s Vision 2030 as policy drivers rather than 5G-specific mandates; big data analytics is named as the largest technology segment within the GCC total, with drones flagged as the fastest-growing. The publisher does not break the $507.27 million forecast out by individual GCC country, so a UAE-only or Saudi-only figure isn’t available from this source.
Understanding Smart Indoor Farming Systems
A smart indoor farming system combines a controlled growing environment with networked sensors, software, and (increasingly) robotics:
- IoT smart farming system: sensor networks that continuously log temperature, humidity, light spectrum, CO2, and nutrient concentration.
- AI-driven control: machine learning models that turn that sensor data into automated adjustments to lighting, irrigation, and climate.
- Vertical farming: crops stacked to maximize output per square foot inside a warehouse or urban building footprint.
USDA Agricultural Research Service scientists interviewed for the agency’s controlled-environment agriculture program estimate vertical farms could eventually capture about half of the US leafy-greens market and around 5% of strawberry and tomato sales, citing yields of 10 to 20 times more product per acre indoors than in open-field growing for crops suited to the method — lettuce and other leafy greens lead adoption today, while cereal and row crops like corn, wheat, and soybeans remain better suited to conventional fields, per USDA ARS.

Indoor Farming Robots Market: Global and US
The global indoor farming robots market was $1.77 billion in 2022, $2.02 billion in 2023, $2.3 billion in 2024, and $2.62 billion in 2025, on track for $6.5 billion by 2032 and $9.61 billion by 2035 — a 13.88% CAGR over 2025–2035, per Market Research Future. North America is the largest regional buyer: $0.84 billion in 2023, projected to $2.45 billion by 2032, which is the closest available figure for a “US indoor farming robots market” size since the publisher reports North America as a bloc rather than breaking out the US alone.
| Robot Application | 2023 Market Size | 2032 Projected Size |
|---|---|---|
| Harvesting | $0.60B | $2.00B |
| Monitoring | $0.50B | $1.80B |
| Irrigation | $0.32B | $1.50B |
| Planting | $0.35B | $1.15B |
| Weeding | $0.25B | $0.85B |
Harvesting and monitoring robots lead spend in every forecast year — logical, since those are the tasks that displace the most manual labor hours inside a vertical farming rack system. Table: Market Research Future.

Indoor Farming Automation: What an Automated Indoor Farm Actually Runs
“Indoor farming automation,” “automated indoor farming,” and “indoor farm automation system” all describe the same stack in practice, whether the operation is a single-room hobby setup or a commercial vertical farming rack facility:
- Environmental control: automated HVAC, dehumidification, and CO2 dosing that hold temperature and humidity inside a set band without a human checking a gauge.
- Lighting automation: LED fixtures on programmable spectrum and photoperiod schedules, tied to the crop’s growth stage.
- Nutrient and irrigation dosing: pumps and sensors that hold pH and electrical conductivity in range for hydroponic or aeroponic delivery.
- Robotics: the harvesting, monitoring, planting, weeding, and irrigation robots sized in the table above, layered on top of the environmental controls.
- Remote/cloud dashboards: the layer that lets an operator check and override the system from a phone instead of walking the floor.
A “smart indoor farming” build and a “smart indoor farming system” purchase decision both come down to the same question: which of these five layers is bought pre-integrated versus assembled from separate vendors, since integration cost is usually the largest line item after the grow structure itself.

Automated Hydroponic Gardening System & Indoor Farming Technology Market
The automated hydroponic gardening system market was $1.87 billion in 2025, projected to $5.42 billion by 2035 (11.23% CAGR), per Market Research Future, with North America holding 45% of that total — the largest single region. Fully automated systems are the smallest 2035 segment at roughly $0.9 billion against $1.8 billion each for semi-automated systems and commercial greenhouses, meaning most of the dollar growth through 2035 still runs through semi-automated rather than fully autonomous setups.
Zoom out to the full indoor farming technology market — hydroponics, vertical racks, containerized units, and the lighting/environmental hardware behind them — and the figure is $25.32 billion in 2025, headed to $55.79 billion by 2035 (8.22% CAGR). Within that total, hydroponics is the single largest technology segment by 2035 at $20.0 billion, environmental control systems follow at $19.04 billion, vertical farming structures at $19.0 billion, and containerized farming units at $12.0 billion, per Market Research Future. Aeroponics remains a smaller sibling technology to hydroponics in these market models rather than its own tracked line item.
Greenhouse spending is tracked separately in smart greenhouse market size, broken down region by region.

Calculator: Indoor Farm Automation Payback
Use your own quote instead of a market-report average: enter your grow space, an automation vendor’s per-square-foot cost, current labor spend, the labor-hour reduction the vendor promises, and the added energy or connectivity cost, and this tool returns a payback period in months.
Result:
Assumptions: straight-line system cost with no financing interest, no maintenance or depreciation, and no yield-revenue upside — only labor savings net of added energy/connectivity cost. It excludes crop-specific revenue, tax treatment, and multi-year escalation, so treat the output as a first-pass screen, not a financing-grade number.
Technological Foundations: IoT, AI, Robotics, Cloud Control
- IoT Sensors: collect light, temperature, humidity, CO2, and nutrient data in real time for automated adjustment.
- AI Algorithms: analyze that sensor stream to predict growth cycles, pest risk, and resource deficiencies, then trigger automation platforms to intervene.
- Robotics: handle sowing, monitoring, harvesting, and pollination, cutting labor hours and manual error.
- Cloud-Based Control Platforms: give remote access so both large agribusinesses and single-site urban farmers can scale operations without adding on-site staff per shift.
Advantages Over Traditional Agriculture
- Water efficiency: closed-loop hydroponic and aeroponic systems use up to 90% less water than field agriculture.
- Reduced chemical use: controlled indoor environments cut disease and pest pressure, lowering pesticide and herbicide applications.
- Year-round output: production decoupled from season and weather.
- Space efficiency: vertical stacking multiplies output per square foot in space-constrained sites.
- Shorter supply chains: siting farms near population centers cuts transportation distance and emissions.
- Soil-independence: soilless methods sidestep soil degradation and salinity problems that limit field expansion.

Growth Drivers and a Financing Use Case
- Urbanization: more consumers in cities with limited growing land favors stacked, indoor production near demand.
- Traceable, local produce demand: buyers want pesticide-free, verifiable-origin food, which is pushing blockchain-based traceability adoption alongside indoor growing.
- Connectivity buildout: the 5G and broader IoT spend detailed above is the infrastructure layer that makes remote monitoring and automation economically viable at scale.
- Supply-chain resilience: shorter, local supply lines reduce exposure to the disruptions that hit long-haul produce logistics.
Use Case: Financing and Insurance
Satellite-supported crop loan and insurance verification is one concrete way this connectivity spend pays back for operators seeking capital: remote, time-stamped monitoring data gives lenders and insurers a way to verify crop status without a site visit, which can shorten underwriting cycles for both indoor and outdoor growers.
Farmonaut AI & Satellite Platforms
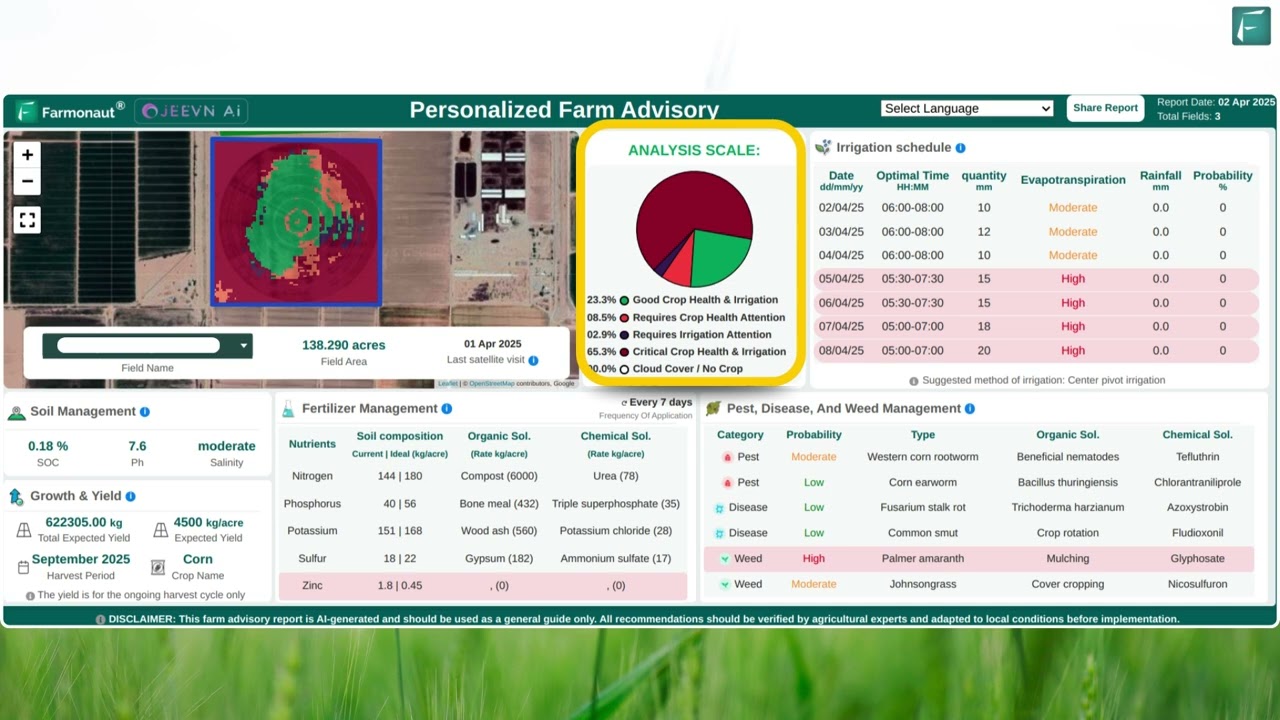
Farmonaut’s platform brings multispectral satellite imagery, AI analytics, blockchain traceability, and resource management together for indoor and outdoor food production alike.
-
Jeevn AI Advisory: analyzes live satellite and farm data for crop recommendations, weather forecasting, and risk detection.

- Blockchain traceability: seed-to-shelf tracking for safety and consumer trust.
- Environmental impact tracking: carbon footprinting tools to measure water, energy, and emissions.
- Fleet and resource management: satellite-driven fleet tools for logistics and cost control.
- Multi-site oversight: the farm admin app for commercial, multi-unit indoor producers.

Developers can integrate satellite-driven insights directly into an indoor farming system through Farmonaut’s API or the API developer docs.
Challenges & The Path Forward
- High upfront investment: automation and connectivity infrastructure raise starter costs versus field agriculture.
- Energy consumption: LED lighting and climate control are the largest recurring operating costs for most facilities.
- Technical expertise: running IoT- and AI-enabled systems requires skills many regions and smaller operators still lack.
- Real estate constraints: suitable vertical space in dense urban areas is not always available at workable lease rates.
Renewable-energy integration, more efficient LED and HVAC hardware, and easier-to-operate software platforms are the three trends most likely to narrow these gaps over the coming several years — none of them a one-time fix, but each moving in a documented direction rather than a speculative one.

Frequently Asked Questions
How big is the US 5G smart farming market?
No firm reviewed here publishes a standalone US dollar figure. North America holds 45% of the $25.13 billion global 2025 total tracked by Market Research Future, which works out to $11.3 billion — a derived estimate, not a directly reported country number.
How big is Argentina’s 5G smart farming market?
The closest tracked figure is Argentina’s IoT-in-agriculture market: $56.48 million in 2024, projected to $156.89 million by 2032 (15.71% CAGR), per DataBridge Market Research.
How big is the GCC’s 5G smart farming market?
The GCC’s connected-agriculture market was $114.77 million in 2025, projected to $507.27 million by 2035 (16.02% CAGR), per Market Research Future, which does not break the figure out by individual GCC country.
What is a smart indoor farming system?
A controlled-environment growing setup that pairs IoT sensors, AI-driven climate and nutrient control, and often robotics or vertical racking to run crop production inside a building rather than a field.
How big is the indoor farming robots market?
$2.62 billion globally in 2025, projected to $9.61 billion by 2035 (13.88% CAGR); North America alone was $0.84 billion in 2023, projected to $2.45 billion by 2032, per Market Research Future.
What counts as indoor farming automation?
Automated environmental control, lighting schedules, nutrient/irrigation dosing, task robotics (planting, harvesting, weeding, monitoring), and a remote dashboard layer tying them together — see the breakdown above.
Is an automated hydroponic gardening system worth the cost?
It depends on your labor cost, energy rate, and vendor quote — run those through the payback calculator above rather than relying on a market-average figure, since fully automated systems remain the smallest 2035 segment (about $0.9 billion) against $1.8 billion each for semi-automated and commercial-greenhouse setups.
Where can I get fresher numbers than the ones on this page?
Each figure here links to its live source report — Market Research Future, DataBridge Market Research, Polaris Market Research, and USDA NASS/ARS all republish or update their underlying data on their own schedules, so check the linked page directly for the current release rather than assuming this snapshot is unchanged.




Conclusion
Two separate markets sit under this article’s queries, and neither should be confused with the other. 5G/connected-agriculture spend — $25.13 billion globally in 2025, with North America at 45% of it, Argentina’s IoT-in-agriculture market at $56.48 million, and the GCC’s connected-agriculture market at $114.77 million — is the network and sensor layer. Indoor farming robots, automated hydroponic systems, and the wider indoor farming technology market — $2.62 billion, $1.87 billion, and $25.32 billion respectively in 2025 — are the equipment layer that connectivity feeds data to and takes commands from. Both are growing at double-digit CAGRs through the mid-2030s across every source cited above, and both are re-published on cycles you can check directly rather than trust to a static snapshot.
Ready to put satellite and AI monitoring behind your own indoor or outdoor operation? Access Farmonaut’s solutions on web, Android, or iOS.

 Rallis India
 Wild Oak Farm
 SFX
SFX BACF Africa
 Doodlakine
 Exurbia Geospatial
 FieldZero
 Indico Company
 Kubota
 FFBS
FFBS Jontra
 Tucor
Tucor
