

Soybean Market Today: Prices, Futures & Trading Guide
Reviewed August 2026 against USDA Agricultural Marketing Service (AMS) daily grain reports and USDA NASS/ERS production data.
Try it: Run your own numbers →
Central Illinois country elevators posted a cash soybean price of $11.29 per bushel on August 6, 2026, per USDA AMS report ams_3192.pdf. If you’re tracking the soybean market today, that’s your reference point for cash bids — futures on the CBOT trade at a premium or discount to that cash price depending on basis, location, and delivery month. This page breaks down how to read that spread, how CBOT soybean futures contracts work, how they compare to wheat futures, and where to pull fresher numbers than the ones printed here.
Soybean Market Today: Cash Price vs. Futures Price
The number a farmer or grain buyer sees at the elevator is not the same number flashing on a CBOT trading screen. The cash price — $11.29/bu at Central Illinois elevators on August 6, 2026 — reflects local supply, demand, and transportation costs. The futures price is a standardized contract for future delivery, traded on the Chicago Board of Trade (part of CME Group), and it sets the benchmark that cash bids are priced against via “basis” (cash price minus futures price).

For anyone doing soybean market analysis, the daily and weekly cash bid is the single most-refreshed, most-actionable data point available — and it’s free, published daily by USDA AMS. Here’s the durable method, not just today’s snapshot:
How to Get Today’s Soybean Cash Price (Method, Not a One-Time Number)
- Go to USDA AMS’s daily market news reports at ams.usda.gov/mnreports.
- For Illinois grain bids, pull report ams_3192.pdf; for Minneapolis-area bids, pull ams_3046.pdf. Both are refiled daily.
- Compare the cash bid to the nearby CBOT futures month to calculate your local basis (cash minus futures).
- Cross-check against USDA ERS’s Soybeans and Oil Crops Market Outlook at ers.usda.gov for the supply-and-demand context behind the day’s move.
This four-step routine works the same whether you’re reading it in 2026 or 2028 — the report numbers change, the retrieval path doesn’t.
Trading Soybean Futures: Contract Basics
A standard CBOT soybean futures contract represents 5,000 bushels. Contract months run January, March, May, July, August, September, and November, with November typically the harvest-year “new crop” contract. Prices are quoted in cents per bushel, and a full contract’s value moves by $50 for every 1-cent price change (5,000 bushels × $0.01).
Trading soybean futures serves two distinct groups differently:
- Hedgers — farmers, grain elevators, and processors — use futures to lock in a price ahead of physical delivery, offsetting the risk of an adverse cash-market move.
- Speculators — including managed money and other large traders tracked in CFTC Commitments of Traders (COT) reports — take directional positions without an underlying physical crop, aiming to profit from price moves.
Soybean Future Contract Specifications
| Specification | Detail |
|---|---|
| Exchange | CBOT (part of CME Group) |
| Contract size | 5,000 bushels |
| Price quotation | Cents per bushel |
| Value per 1-cent move | $50 per contract |
| Contract months | Jan, Mar, May, Jul, Aug, Sep, Nov |
| Reference cash price used here | $11.29/bu, Central Illinois, Aug 6, 2026 (USDA AMS) |
Margin requirements (the deposit needed to open a position) are set and periodically adjusted by CME Group and are not published in the source material reviewed for this article. Check the current initial and maintenance margin directly on the CME Group soybean futures contract page before sizing any position — margins move with volatility and are not a figure to treat as fixed.
Soybean Market Analysis: What Actually Moves the Price
Soybean market analysis comes down to a short list of recurring drivers, each of which has a specific, checkable data source:
- US and South American production — Brazil and Argentina harvest opposite the US calendar, so their crop size directly affects the US export window. USDA NASS’s soybean yield and production maps at nass.usda.gov break this down state-by-state and are updated on USDA’s crop reporting schedule.
- China demand — as the largest global soybean importer, shifts in Chinese purchasing show up quickly in export sales data and in the cash basis at Gulf and Pacific Northwest export elevators.
- US dollar strength — a stronger dollar makes US soybeans more expensive for foreign buyers relative to Brazilian or Argentine supply, pressuring export demand.
- Biofuel demand — soybean oil demand for renewable diesel and biodiesel production competes with food-use demand and has become a larger share of total soybean crush in recent marketing years.
- Weather during the growing season — moisture stress during pod-fill (roughly late July through August in the US Midwest) is the single highest-impact weather window for yield.
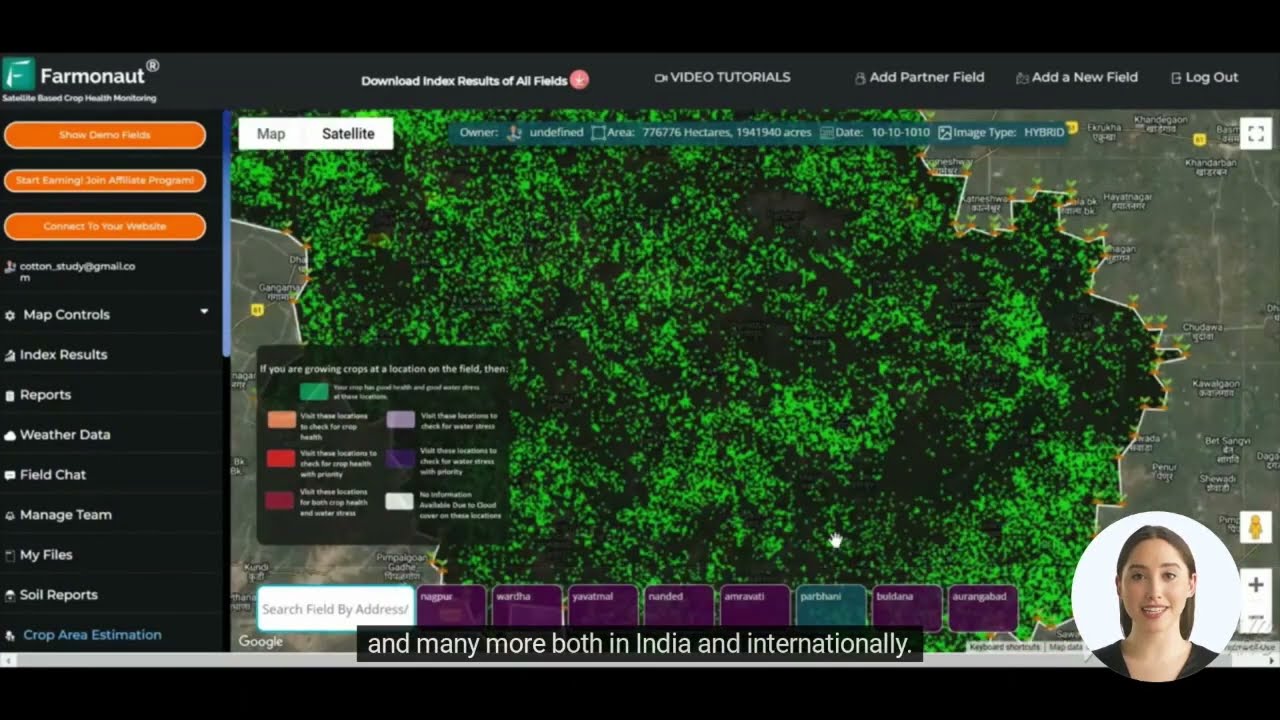
On weather specifically: satellite-based crop monitoring — vegetation indices like NDVI overlaid on field boundaries — lets you track moisture stress in specific growing regions between USDA crop progress releases rather than waiting for the weekly report. Farmonaut’s satellite monitoring platform applies this at the field level:

Gaps in Publicly Available Data
Being direct about what’s not published, rather than guessing: historical soybean price volatility indices, typical CBOT daily trading volume and open interest figures, detailed soybean oil and soybean meal contract specifications, and regional basis differentials by growing region were not found in the sources reviewed for this article. For open interest and volume, check the CME Group soybean futures contract page directly, which publishes daily settlement data. For regional basis, compare a specific USDA AMS regional report (like ams_3192.pdf for Illinois or ams_3046.pdf for Minneapolis) against the nearby futures settlement on the same day — that spread is your basis, and it’s specific to your delivery point.

Wheat Futures Market Analysis: A Comparison
Wheat futures market analysis follows the same basis-and-fundamentals framework as soybeans, but the supply picture looks different. CBOT wheat futures closed at $678.17 per bushel-equivalent quote (CME/CBOT front-month close) on August 18, 2026, per Trading Economics’ CBOT wheat data feed. Note the wheat quote convention differs from the flat cents-per-bushel soybean quote shown on retail platforms — always confirm the units on the specific data source you’re reading before comparing across commodities.
The bigger structural story in wheat is supply: USDA’s August 2026 report projects US all-wheat production for marketing year 2026-27 at 1,531 million bushels — the lowest since 1970-71, according to USDA ERS. That’s a multi-decade production low, and it’s the kind of figure that reshapes the supply side of wheat futures pricing independent of any single week’s demand news.
Soybean vs. Wheat Futures: Side-by-Side
| Metric | Soybeans | Wheat |
|---|---|---|
| Reference price | $11.29/bu cash, Central Illinois, Aug 6, 2026 (USDA AMS) | $678.17/bu-equivalent, CBOT close, Aug 18, 2026 (Trading Economics/CME) |
| Exchange | CBOT | CBOT |
| Contract size | 5,000 bushels | 5,000 bushels (CBOT wheat standard) |
| Key current driver | China demand, South American crop size, biofuel demand | US production at multi-decade low (1,531M bu, MY 2026-27) |
| Data source to refresh | USDA AMS daily reports (ams.usda.gov/mnreports) | USDA ERS wheat outlook; CME/CBOT settlement data |
Because both trade on the same exchange with the same 5,000-bushel contract convention, the spread trade between soybeans and wheat is a common way traders express a view on relative supply tightness without taking an outright directional position in either market — one of the strategies covered below.
Regional Cash Bids: Soybean Rates Beyond Illinois
Readers searching for a specific elevator’s rate today need the region-specific report, not a national average. USDA AMS publishes separate daily reports by region — ams_3192.pdf covers Illinois grain bids, ams_3046.pdf covers the Minneapolis area — and each is refiled daily with that day’s elevator bids. If your local elevator isn’t in either report, USDA AMS’s full mnreports index lists reports by state and region; check it directly rather than assuming a single Midwest number applies to your delivery point, since basis can differ by more than $0.20/bu between nearby elevators depending on rail access and local demand.
Strategies for Trading Soybean Futures Contracts
These are structural approaches, not predictions about where price goes next — the method holds regardless of which direction the market is currently moving:
- Spread trading: Trade the price relationship between two contract months of soybeans, or between soybeans and a related commodity like wheat or corn, rather than taking an outright directional position.
- Options on futures: Buying calls, puts, or combinations like straddles lets you express a volatility view or hedge a physical position with defined downside risk (limited to the premium paid).
- Basis trading (for producers): Lock in the futures price via a hedge-to-arrive contract, then separately negotiate basis with your local elevator once you’re ready to deliver — this separates the two price components instead of taking both at once.
- Technical levels: Track support and resistance on the nearby contract chart, using moving averages and momentum indicators (like RSI) to time entries around fundamental catalysts such as a USDA WASDE report release.
- Fundamental-driven positioning: Build a position thesis around a specific USDA report date — WASDE, quarterly Grain Stocks, or the Crop Production report — since these scheduled releases are the highest-volatility events on the futures calendar.
Each carries real risk, including the possibility of losses exceeding your initial margin deposit on a futures position. None of these strategies substitute for confirming current CME Group margin requirements and contract specifications directly before trading.

Soybean Contract Value Calculator
Use the calculator below to convert a cash or futures price per bushel into a full contract’s dollar value, and see what a one-cent move is worth to your position.
Run your own numbers
Assumptions: this calculator computes notional contract value and price sensitivity only — it excludes margin requirements, brokerage commissions, exchange fees, and basis. The default price ($11.29/bu) and contract size (5,000 bushels) reflect the Central Illinois cash reference and CBOT standard contract size cited above; replace both with your own numbers. It does not account for options premiums or spread positions.
Satellite Monitoring’s Role in Soybean Market Analysis
Crop condition is a fundamental input to any soybean market analysis, and satellite monitoring closes the gap between USDA’s weekly Crop Progress reports. Precision agriculture solutions using multispectral imagery can flag moisture stress or canopy stress at the field level days before it would show up in a regional yield estimate.

For traders and analysts layering this into a soybean or wheat futures view, the relevant agriculture solutions include:
- Field-level NDVI and moisture stress tracking via satellite imagery, refreshed on each satellite pass
- AI-driven advisory alerts tied to specific growth stages, including pod-fill for soybeans
- Blockchain-based traceability for verifying grain origin through the supply chain
- Weather forecasting layered against field boundaries rather than county-level averages



Building This Into a Trading or Analysis Workflow
For developers and analysts who want to pull crop condition data programmatically rather than reading dashboards manually, Farmonaut’s API Developer Docs cover satellite and weather data endpoints that can feed directly into a market analysis model alongside USDA release data. Combining a programmatic feed of field-level conditions with the USDA’s own scheduled releases (WASDE, Crop Production, Grain Stocks) gives a more complete picture than either source alone — the USDA reports set the official record, satellite data fills the gaps between them.
Conclusion: A Repeatable Framework, Not a Single Snapshot
The specific numbers in this article — $11.29/bu for Central Illinois cash soybeans on August 6, 2026, $678.17 for CBOT wheat on August 18, 2026, and 1,531 million bushels for projected US wheat production — will be out of date by the time you read this if enough time has passed. What doesn’t go stale is the method: pull the daily USDA AMS regional report for your cash price, compare it to the nearby CBOT futures settlement for your basis, check USDA ERS and NASS for the supply-side fundamentals, and layer in field-level satellite monitoring for anything the weekly Crop Progress report hasn’t caught yet. That combination — not any single number — is what a durable soybean market analysis is built on.
Further reading:
FAQ Section
Q: What is the soybean market price today?
A: The most recent verified figure is $11.29 per bushel, the Central Illinois cash price at country elevators on August 6, 2026, per USDA AMS report ams_3192.pdf. For a current figure, pull the latest report directly from ams.usda.gov/mnreports, which is refiled daily.
Q: How do I trade soybean futures?
A: Soybean futures trade on the CBOT in 5,000-bushel contracts, quoted in cents per bushel. You’ll need a futures trading account with a broker, sufficient margin (check CME Group’s current requirement directly), and a strategy — outright directional, spread, or options-based — matched to your risk tolerance.
Q: How does the soybean market compare to wheat futures right now?
A: On August 18, 2026, CBOT wheat closed at $678.17 per bushel-equivalent while soybeans’ most recent cash reference was $11.29/bu (Aug 6, 2026). The bigger structural story is wheat supply: USDA projects US all-wheat production for MY 2026-27 at 1,531 million bushels, the lowest since 1970-71.
Q: What is a soybean futures contract, specifically?
A: A standardized CBOT agreement to buy or sell 5,000 bushels of soybeans at a set price for delivery in a specified month (January, March, May, July, August, September, or November). Each 1-cent price move changes the contract’s value by $50.
Q: Where can I find soybean rates for a specific region, like Latur or another local market?
A: This article’s data sources — USDA AMS, NASS, and ERS — cover US markets specifically. For a US regional cash bid, use the daily USDA AMS report for your area (Illinois: ams_3192.pdf; Minneapolis: ams_3046.pdf); the full report index at ams.usda.gov/mnreports lists additional regions.
Q: How can satellite monitoring improve soybean or wheat futures market analysis?
A: Field-level satellite imagery flags moisture stress and canopy condition between USDA’s weekly Crop Progress releases, giving traders and analysts an earlier read on yield risk than waiting for the next scheduled government report.
Track the soybean market today and every day with Farmonaut’s field-level satellite monitoring, paired with the USDA data sources cited throughout this article, to build a market analysis that updates as fast as the fundamentals do.

 Adinet
 Save Your Soils
 YelloSkye
 GalaxEye Space
 Grandstream Algérie
 XOS Realty
 Geospatial Lab Africa
 Agro La Gándara
 HIPSAC
 ZOL Zimbabwe
 Juligerm
 AdBio
AdBio MISE Maroc
 NWNS
NWNS Red August Group
 Farm Inc
 WeMe Global
 Agrotoken
 Blue BearX
 Insignito
