

Reviewed August 2026 against USDA ERS, New Mexico State University Extension and USDA Farm Service Agency.
Fencing Solutions for Large Agricultural Properties
On a large property, fencing is priced by the mile, not by the acre — and the two move in opposite directions. A square 40-acre block needs 5,280 ft of perimeter fence (132 ft per acre); a square 6,000-acre block needs 64,663 ft (10.8 ft per acre). But a real ranch is not a square: New Mexico State University’s cost study of a 360-head operation with 6,000 private acres modelled 75 miles of fence at $15,000 per mile — about $2.84 per foot, and roughly six times the fence a bare perimeter would require, because of cross-fencing, irregular boundaries and terrain.
That gap between the geometry and the reality is where farm fencing budgets are won or lost. Below are the verified cost anchors, the service lives, the USDA cost-share rules that pay for a share of it, and a calculator that puts your own acreage and your own quoted price per mile into the arithmetic.
Why “large” changes the fencing maths
Perimeter grows with the square root of area. Double the acreage and you add only about 41% more perimeter. This is the single strongest economic argument for consolidating agricultural land into fewer, larger blocks, and it is why fence cost per acre collapses as blocks get bigger.
Scale matters here because US agriculture keeps concentrating. The USDA Economic Research Service reported on 28 February 2024 that the 2022 Census of Agriculture counted 1,900,487 farms on 880 million acres — the first count below 2 million since before the Civil War — with average farm size up 5% to 463 acres. ERS’s Farming and Farm Income series, updated 5 February 2026, put 2024 at 1.88 million farms on 876 million acres, averaging 466 acres, with large-scale family farms — about 5% of operations — producing 50% of the value of production. Fence is being bought by fewer, bigger buyers each cycle.
Types of fencing for farms, and what each is actually for
There is no single best agricultural fence. There is a best fence for a specific job — boundary, interior division, predator exclusion, deer exclusion, riparian protection or temporary strip grazing — and buying the wrong one for the job is the most expensive mistake on this list.
| Fence type | The job it does | Verified cost anchor | Service life | Main failure mode |
|---|---|---|---|---|
| Multi-strand wire boundary fence (barbed or smooth, wood/steel posts) | Legal boundary, cattle containment across long runs | $15,000/mile ≈ $2.84/ft, New Mexico ranch model, NMSU B-133, March 2025 | 25 years in the NMSU model | Post rot and corner failure; annual repair budgeted at 2% of build cost ($300/mile/yr) |
| High-tensile smooth wire (electrified or not) | Interior division, long spans between posts, rebuilds on rolling ground | No single national published figure — price it from your state NRCS payment schedule and two contractor quotes | Wire class and post material decide it; specify Class 3 galvanising in the quote | Loss of tension after temperature swings; requires in-line strainers and periodic re-tensioning |
| Woven wire | Sheep, goats, hogs; anywhere an animal will push through rather than over | Priced per roll and per foot locally; get quotes for the same mesh spacing and wire gauge | Longest of the wire fences when properly braced | Sagging between inadequate braces; snow load in drifted country |
| 8 ft high-tensile woven wire deer exclusion | Keeping deer out of orchards, vegetables, nursery stock and vineyards | ~$10/ft installed; farmer-installed cuts about 35% — Rutgers Snyder Research Farm | More than 20 years of effective depredation prevention (Rutgers) | Gates left open; deer entering at watercourse crossings |
| Portable electric (polywire, netting) | Strip and rotational grazing; short-term crop protection on small blocks | Rutgers recommends portable electric for areas of one acre or less | Seasonal to a few years | Grounding out in wet vegetation; energiser or battery failure |
| Virtual fencing (GPS collars) | Interior grazing control on extensive rangeland; riparian exclusion | $200/collar, $20/battery pair, $10,000 per LoRaWAN tower (4 towers per 6,000 acres) — NMSU B-133 | Collars 5 years; batteries about 1 year | Does not replace a legal boundary fence; individual animals that repeatedly breach |
Where this table says “no single national published figure”, that is deliberate. Fence pricing is a local commodity: wire, posts, freight and labour all vary by state and by month. Three durable ways to get a defensible number for your own county, in order of reliability:
- Your state NRCS payment schedule. NRCS publishes per-foot rates for Conservation Practice 382 (Fence) by state and fiscal year, broken out by scenario — barbed or smooth wire, woven wire, 2-strand electric, 4-or-more-strand electric, exclusion fence. These are the rates the agency itself will pay against, refreshed annually. Search “NRCS payment schedules”, choose your state and the current fiscal year, and filter to practice code 382.
- Iowa State University Extension’s Estimated Costs for Livestock Fencing (publication FM 1855), which models a quarter-mile of woven wire, barbed wire, high-tensile non-electric and high-tensile electrified fence with materials and labour split out, and is revised against Iowa retailer prices.
- Two contractor quotes on identical specifications — same wire gauge, same galvanising class, same post spacing, same brace design. Quotes that differ on specification are not comparable, and this is where most farm fencing budgets go wrong.

Fence cost per kilometre
Outside the US, fence and wildlife-fence budgets are usually quoted per kilometre. The same verified anchors converted (1 mile = 1.609 km, 1 km = 3,281 ft):
| Fence | US anchor | Per kilometre | Source |
|---|---|---|---|
| Multi-strand wire boundary fence | $15,000 per mile | about $9,300 per km | NMSU B-133, March 2025 |
| 8 ft high-tensile woven wire deer fence, contractor-installed | about $10 per ft | about $32,800 per km | Rutgers Snyder Research Farm |
| Same deer fence, farmer-installed (about 35% less) | about $6.50 per ft | about $21,300 per km | Rutgers Snyder Research Farm |
For scale, a square 100-hectare block (1 km by 1 km, about 247 acres) needs 4 km of perimeter fence. At the NMSU boundary rate that is roughly $37,000 before gates, braces and cross-fencing. The same perimeter in 8 ft deer fence would cost about $131,000 contractor-installed.
These are US dollar figures from US studies. Wildlife-exclusion fences built to keep out larger or more determined animals, such as predator-proof or electrified designs, cost more per kilometre, and local wire, post and labour prices differ by country. Use the table to test a quote, not to replace one.
Price your own fence line
Enter your block size, how many interior divisions you want, and the price per mile you have actually been quoted — the calculator returns total fence length, cost after cost-share and the annualised cost per acre.
Run your own numbers
Assumes a square block and straight, equally spaced cross-fences. Excludes gates, corner and end braces, water development, cattle guards, brush clearing, rock excavation, survey costs and annual repair (NMSU budgets repair at 2% of build cost per year). Terrain, timber and creek crossings all add length beyond the geometric figure. Cost-share is applied to the whole build here; in practice only practice-eligible footage qualifies.
What the fence is holding out, and what that is worth
Predator exclusion is a common justification for upgrading agricultural fences, and it is worth checking against measured loss data rather than impression. Mississippi State University Extension's publication P2661, Predator Control on Beef Cattle Operations (issued April 2026), reports that in 2005 Mississippi cattle operations lost $1,037,000 in cattle over 500 pounds and a further $959,000 in calves under 500 pounds to predation, and that exclusion fencing was used by 25% of the state's cattle operations as a control method.
The attribution matters for fence design. Dogs and coyotes both go under or through a fence rather than over it, which points at bottom-wire height and offset electrified wires rather than at overall fence height.
Deer are the other exclusion problem, and the economics are different again. Rutgers' Snyder Research and Extension Farm is direct about it: 8 ft high-tensile woven wire runs about $10 per foot installed, farmer installation cuts that by roughly 35%, and only high-value crops — vegetables, nursery stock and fruit — return enough per acre to justify it. A 10-acre square orchard block needs 2,640 ft of perimeter; at $10/ft that is $26,400, or $2,640 per acre, before gates. Spread over the 20-plus years Rutgers reports for effective service life, that is about $130 per acre per year — trivial against nursery stock, ruinous against pasture.
Virtual fencing: where it fits on large acreages
Virtual fencing replaces interior fence lines with GPS collars that deliver an audio cue and then an electrical pulse at a boundary drawn on a map. On extensive properties it is the one genuinely different answer to the miles-of-fence problem, and it now has published field results rather than vendor claims.
Raynor and colleagues, publishing in Frontiers in Veterinary Science on 10 September 2025, ran 120 British-breed yearling steers (mean 382 kg) across four roughly 130-hectare (321-acre) shortgrass steppe pastures at the USDA-ARS Central Plains Experimental Range near Nunn, Colorado, using the Vence system. Virtual-fence herds stayed inside their designated areas 94–99% of the time — but five steers made consistent daily excursions, and virtual-fence management reduced growth rates by about 9% overall (12% in one acclimated group), leaving steers 7.3 kg lighter at season end. That weight penalty is the number vendors do not lead with, and it belongs in any honest comparison.
The cost side comes from New Mexico State University Extension bulletin B-133 (Vitale, Ward, Vitale, Gifford, Utsumi and Spackman, March 2025), which builds an annual budget for a 360-head ranch with 6,000 private acres, 75 miles of fence and access to 23,920 total operating acres.
Against that $33,376, NMSU puts the physical fence alternative at $67,500 a year: 75 miles built at $15,000 per mile ($1,125,000), annual repair at 2% of build cost ($22,500), spread over a 25-year service life. Per head that is $188 a year for wire against $92.71 for collars — virtual fencing lands at roughly half the annual cost in this model, and the advantage widens as fence miles per animal rise.
Three cautions before that chart becomes a purchase order. Virtual fencing does not discharge a legal boundary obligation — a perimeter fence still has to exist. It depends on collar battery discipline and radio coverage; NMSU budgets four towers at $10,000 each for 6,000 acres, and coverage on broken ground may need more. And the Colorado growth-rate penalty is real enough that the gain in fence savings can be partly offset at the scale. Where it shines is interior control: rotational grazing paddocks that would otherwise need permanent cross-fencing, and riparian exclusion where wire is impractical.

Who pays for farm fencing: the two USDA doors
Most large-property fencing projects in the US are part-funded, and the two routes are distinct.
EQIP and practice code 382
NRCS pays against Conservation Practice Standard 382 (Fence) through the Environmental Quality Incentives Program, at a published flat rate per foot for each fence scenario in your state, with historically underserved and beginning producers eligible for a higher rate. Fence is usually funded as a supporting practice — it is easiest to get approved when it enables a grazing management plan, protects a stream, or excludes livestock from a sensitive area. The practical sequence: contact your local NRCS field office, get a conservation plan written, confirm the FY payment rate for your state's 382 scenario before you sign, and do not start construction before the contract is obligated.
ECP after a disaster
Where fence has been destroyed by flood, wildfire, hurricane or severe drought, the USDA Farm Service Agency Emergency Conservation Program covers restoring permanent fences among its five eligible practices, at up to 75% of the allowable cost, or up to 90% for limited-resource producers. Applications are taken after a natural disaster on a first-come, first-served basis, with funding subject to annual appropriations — which is why the ECP instruction is always to apply as soon as possible after the event, through the local FSA office, rather than after the rebuild.
Both figures are policy rates rather than market rates, and both are reset by farm bill authority and appropriations. Verify the percentage and the per-foot schedule with your county office in the fiscal year you intend to build.
Regional realities: hill country, plains and the Brevard, NC case
Search interest in fencing solutions around Brevard, North Carolina, is a good illustration of why national per-foot averages mislead. Brevard sits in Transylvania County in the southern Appalachians, hard against Pisgah National Forest: steep slopes, shallow rocky soils, high rainfall, and heavy deer and black bear presence on forest-adjacent boundaries. Every one of those conditions raises cost per mile above a plains figure — post holes that need rock augers or driven steel, fence lines that cannot run straight, creek crossings that need floodgates, and boundaries where an ordinary four-strand wire fence will not stop the wildlife pressure that matters.
The method for pricing a mountain-parcel fence, which holds wherever the ground is difficult:
- Pull your parcel in the NRCS Web Soil Survey and check depth to bedrock and slope class before quoting post installation — that single variable moves labour cost more than wire choice does.
- Walk the boundary and measure actual fence line, not the deeded acreage. On broken ground the real length routinely runs well above the square-block geometry in the calculator above.
- Ask the North Carolina NRCS state office for the current fiscal-year 382 payment schedule and the specific scenario codes that match steep-ground construction.
- Check your state's fence law and your county's rules on boundary fence cost-sharing between adjoining landowners before you build on a line — statutes differ sharply between states, and a shared-cost claim is far harder to make after the fact.
- Budget floodgates or drop-panels at every watercourse; in high-rainfall country these are the first components to fail and the most common route for stock to leave.
Contrast that with the plains and Midwest agriculture, where long straight runs, deep soils and mechanised post driving pull cost per mile toward the low end, and where the binding constraint is more often snow load and drifting than terrain. Regional fencing and equipment suppliers around agricultural hubs increasingly quote both wire and collar systems, so ask for both on the same job.

Fencing as part of land and water management
Fence lines decide where animals do not go, which makes them one of the cheapest instruments of agricultural land management available. Excluding livestock from stream banks is a standard NRCS objective and one of the more reliable ways to get 382 funded; the same logic underpins water management strategies across land uses. Where wire crosses drainages, plan the exclusion and the alternative water point together — a stream-excluded pasture without a tank simply moves the problem.
Wildlife-permeable design is the other durable specification. In pronghorn and big-game country, state wildlife agencies converge on the same pattern: a smooth bottom wire set high enough for animals to pass beneath, a top wire low enough to be jumped cleanly, and no barbed wire in either position. Ask your state wildlife agency for its current fencing guideline sheet before you set wire heights; several states and NRCS enhancements pay a premium for building to that specification, and climate-smart farming practices programmes increasingly reference it.

Watching the fence line without driving it
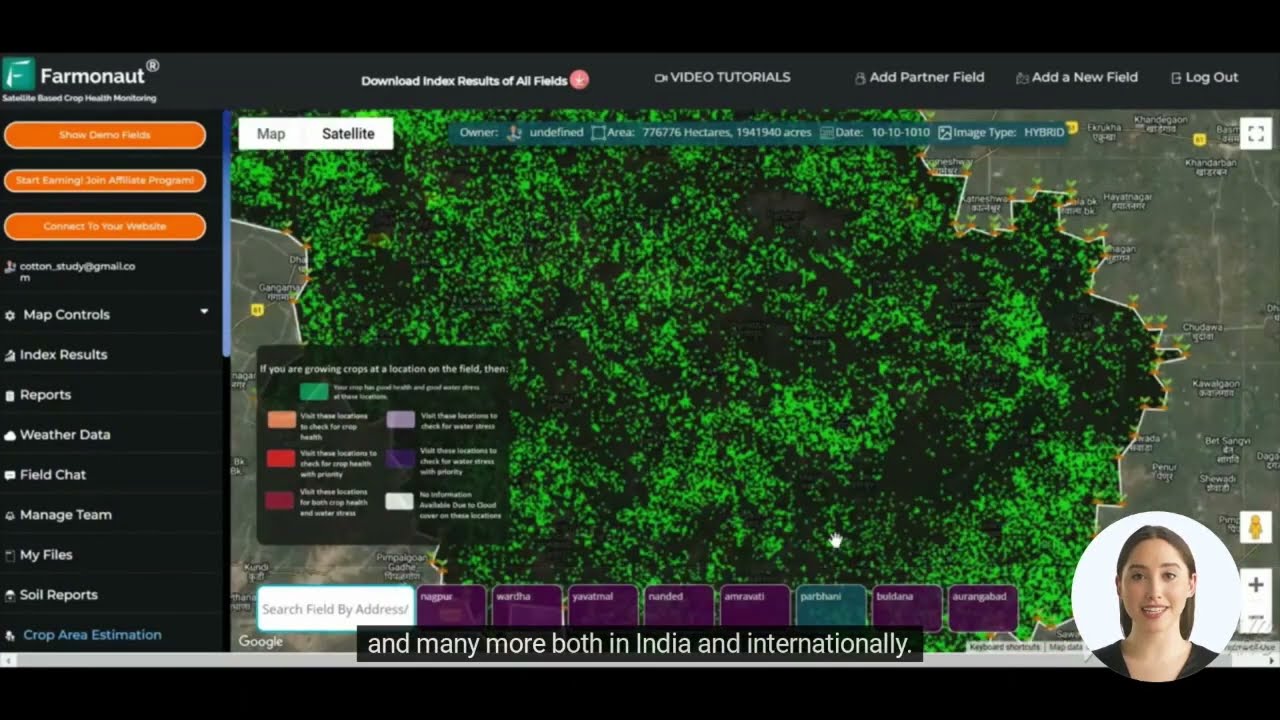
On thousands of acres, the fence itself is only half the management problem — the other half is knowing which paddocks are worth the fence. Satellite vegetation monitoring tells you where forage has recovered and where a paddock is being overgrazed, which is what a cross-fence or a virtual boundary is actually there to control. Farmonaut's platform provides satellite crop and pasture health monitoring, weather data, AI-based advisory and traceability tools that sit alongside smart farming hardware rather than replacing it, and integrate with advanced farm management workflows.



Developers pulling pasture and weather layers into their own grazing or fencing management systems can work from the API and the API Developer Docs.

A checklist that outlives the price list
Prices move; this sequence does not. Work it in order before any wire is ordered.
- Measure the actual fence line. Walk or GPS it. Compare against the square-block geometry above; if your real length is more than double, look for blocks worth consolidating.
- Name the job for each segment. Boundary, interior division, exclusion, riparian, temporary. Do not build one specification everywhere.
- Get the state 382 payment schedule for the current fiscal year before pricing, so you know the ceiling you will be reimbursed against.
- Take two quotes on identical specifications — wire gauge, galvanising class, post material and spacing, brace design. Any difference in these makes the quotes incomparable.
- Divide by service life, not by build cost. A fence at $2.84/ft lasting 25 years costs $0.11/ft/yr; the same money on a fence lasting 12 years costs double.
- Add 2% of build cost per year for repair, the rate NMSU uses, and put it in the budget rather than in the surprise column.
- Check wildlife guidance and fence law for your state before setting wire heights or building on a shared boundary.
- Re-price annually. Steel wire and fence-gate producer price indexes are published monthly by the Bureau of Labor Statistics and mirrored on FRED; look up the "Steel Fencing and Fence Gates" PPI series to see whether material prices have moved since your last build before you reuse an old estimate.
Frequently asked questions
- How much fence does 1,000 acres need? A square 1,000-acre block has a 26,400 ft perimeter — exactly 5 miles, or 26 ft of fence per acre. Irregular boundaries and interior divisions push that up; NMSU's modelled ranch carried 75 miles of fence across an operation with 6,000 private acres, about six times the bare perimeter figure.
- What is the cheapest fencing for a large agricultural property? On a per-mile basis, a multi-strand wire fence at around $15,000 per mile (NMSU, March 2025) is the baseline for long boundary runs. For interior division on extensive ground, virtual fencing came out at $92.71 per head per year against $188 for physical fence in the same study.
- Does virtual fencing replace a boundary fence? No. It manages interior grazing boundaries. A legal perimeter fence is still required, and the Colorado trial published in September 2025 recorded containment of 94–99% with a small number of animals breaching daily.
- How much will USDA pay towards agricultural fences? Emergency Conservation Program cost-share for restoring permanent fences after a disaster runs up to 75% of allowable cost, or up to 90% for limited-resource producers. EQIP pays a published flat rate per foot for practice 382 that differs by state and fiscal year.
- How long should a farm fence last? NMSU models physical ranch fence over a 25-year service life; Rutgers reports more than 20 years of effective service from 8 ft high-tensile woven wire deer fence. Collars for virtual fencing are modelled at 5 years, with batteries replaced about annually.
- What fence keeps deer out of crops? An 8 ft high-tensile woven wire fence, at roughly $10 per foot installed per Rutgers, with farmer installation cutting about 35%. It is justified on vegetables, nursery stock and fruit, not on pasture.
The decision on a large property is rarely which fence is best in the abstract. It is how many miles you genuinely need, what each mile is being asked to do, what your state will pay per foot toward it, and how many years the specification will actually last. Get those four numbers in writing and the fence type mostly chooses itself.

 Atur Kuliner
 GlobalQuant
 MDCV UK
 Zerella Group
 Etech Consulting Madagascar
 Vestlandsforsking
 Agritein
 Delicio
 WB Dev
 Sama Premium
 Prochecker
 Tres Valles
 LACOS Geoinformation
 Magrifly
 LatConnect 60
 Blickwinkel
 Agricultural Credit Policy Council
 Marei Nursery
 eKGIS
eKGIS Mostas Tech
