

Reviewed August 2026 against USDA NASS, Copernicus and FAO.
Try it: Satellite monitoring ROI: what it returns on your acreage →
Impact of Agritech on Rural Areas: What the US Numbers Actually Show
Agritech’s measurable impact on rural areas runs through three channels: fewer, larger farms operated with less hired labor; a connectivity floor that now covers most but not all farm households; and a shift in where agronomic decisions get made. The 2022 Census of Agriculture counted 1,900,487 farms in the United States working 880.1 million acres — 7% fewer farms than in 2017, on land that consolidated to an average of 463 acres per operation. Over the same period the share of US farms reporting internet access rose from 75% to 79%. That gap between near-universal connectivity and near-total consolidation is where agritech’s rural impact is actually decided, and this page walks through the numbers, the costs, and how to check them against your own acres.
“79% of US farms reported internet access in 2022 — up from 75% in 2017 — while the number of farms fell 7%.”
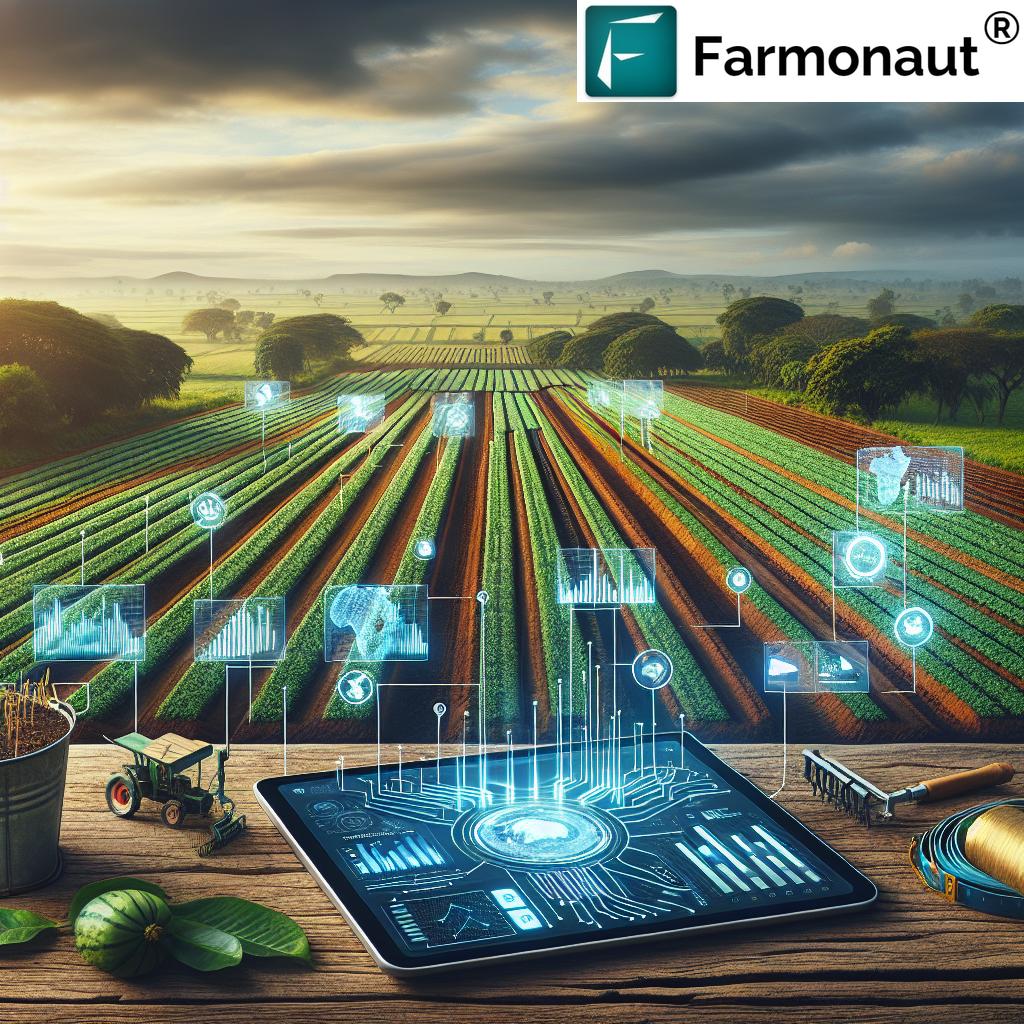
What Is Agritech? A Working Definition
Agritech is the application of digital sensing, data processing and connectivity to agricultural production and its supply chain. The agritech definition that holds up in practice is narrower than “technology on farms”: a tractor is machinery, but a tractor with RTK guidance writing an as-applied map to a cloud account is agritech. The distinguishing feature is that a decision which used to be made by walking the field is now made from a data layer.
Four layers make up almost every deployment you will encounter:
- Sensing. Satellite multispectral imagery, aerial and drone survey, in-field soil moisture probes, weather stations, machine telematics.
- Processing. Vegetation indices such as NDVI and NDRE, evapotranspiration models, yield forecasting, disease-risk models.
- Delivery. A web or mobile interface, an API feed into a farm management information system, or a prescription file loaded onto a controller.
- Action. Variable-rate application, irrigation scheduling, scouting priority, harvest logistics, and documentation for buyers or lenders.
The term itself is a contraction of “agriculture” and “technology“, and it covers both the field side and the downstream supply chain. When people search for agriculture and agritech solutions, they are usually asking which of these four layers they need to buy and which they already have. Most US row-crop operations already own layer one and layer four — the sensing sits on the machinery, the application equipment is in the shed — and are missing layers two and three.

The Rural Impact, Measured
Rural America is not a rounding error and it is not the whole country either. Roughly 46 million people — about 14% of the US population — live in nonmetropolitan counties, according to USDA Economic Research Service reporting. Farming is a minority of rural employment in most of those counties, but it anchors the land base: 880.1 million acres in farms as of the 2022 Census, published by USDA NASS in February 2024.
The structural numbers that agritech interacts with:
- 1,900,487 farms in 2022, down from 2,042,220 in 2017 — a loss of about 141,700 operations in five years.
- Average farm size 463 acres in 2022, up from 441 acres in 2017. Land did not disappear; it was absorbed.
- $543 billion in market value of agricultural products sold in 2022.
- Average producer age 58.1 years — succession and labor scarcity are the operating context for every adoption decision.
Consolidation and digitalization reinforce each other. A 463-acre average is a farm you can still walk; the operations driving technology purchases are far above that average and cannot be walked at all. The practical consequence for a rural county is that the same acreage generates fewer farm households, and the households that remain need remote monitoring simply to cover ground. Agritech is a response to a labor and scale problem before it is a yield problem.
If you want county-level versions of every figure above — farm counts, acreage, irrigated acres, sales class — the underlying tables are queryable at USDA NASS Quick Stats. Select Program: CENSUS, Sector: DEMOGRAPHICS or ECONOMICS, then your state and county. This is the single most useful thing a rural landowner can do with twenty minutes, and no AI summary will do it for your county.
Agritech Digitalization: What “Digital” Means on a US Farm
Agritech digitalization is the transition from paper and memory to machine-readable field records. Its progress is directly measurable in the census: the share of US farms reporting internet access reached 79% in 2022, from 75.4% in 2017 and about 69.6% in 2012.
Note what that chart does not say. Internet access in the census means the household reported access — it does not mean fixed broadband at a speed that will upload a full-field imagery layer, and it says nothing about coverage at the far corner of a quarter section. The federal response has been infrastructure money: the USDA ReConnect Program makes loans and grants for broadband build-out in rural areas that lack sufficient service, and applicants can check eligibility against the program’s service-area map before applying.
The workaround that makes digitalization possible at 79% rather than 99% coverage is that the heavy computation happens off-farm. Satellite imagery is processed on a server; what reaches the farmhouse is a compressed map and a text advisory. That is a few hundred kilobytes, not a few hundred megabytes, and it moves over a cellular signal that would choke on a live video feed.
Benefits of Agritech: The Verification Table
Vendor claims about the benefits of agritech collapse into percentages that nobody can audit. The table below does something different: for each layer, it names what the technology replaces, where the cost benchmark is actually published, and how you would test the claim on your own ground in a single season.
| Agritech layer | What it replaces | Where the cost benchmark is published | How to test it on your acres in one season |
|---|---|---|---|
| Satellite crop monitoring (Sentinel-2, Landsat, commercial) | Windshield scouting; scheduled walk-throughs | Sentinel-2 and Landsat pixels are free; you pay for processing and delivery. Compare against your scouting labor hours. | Flag the three lowest-index zones each month, ground-truth them, and log how many were real problems you had not already found. |
| Variable-rate nutrient application | Flat-rate application across the field | USDA ERS Fertilizer Use and Price data product; USDA AMS market news for current $/ton by product. | Leave two flat-rate check strips through the variable-rate zones and compare yield-monitor data at harvest. |
| Irrigation scheduling (ET + soil moisture) | Calendar or feel-based watering | Your own pumping energy bill; state extension irrigation cost budgets. | Meter one scheduled pivot against one calendar pivot for a full season; compare acre-inches and yield. |
| Fleet and logistics telematics | Radio coordination and paper haul tickets | EIA weekly on-highway diesel price, published every Monday. | Track deadhead miles per load for four weeks before and after. |
| Traceability and documentation | Binder audits; buyer questionnaires | Your buyer’s audit fee and the staff hours it consumes. | Time one audit cycle with digital records against your last paper one. |
| Satellite-verified credit and insurance | In-person field inspection for acreage and condition | Lender inspection fee line item; USDA RMA actuarial data browser for crop insurance parameters. | Ask your lender what their per-visit verification cost is and whether imagery substitutes for it. |
The reason the free-imagery column matters: USGS Landsat archive data has been free to all users since 2008, and Landsat 8 and Landsat 9 together deliver an 8-day repeat cycle at 30 m resolution. The European Space Agency’s Copernicus Data Space Ecosystem distributes Sentinel-2 at 10 m in the visible and near-infrared bands with a 5-day equatorial revisit, and Sentinel-2C launched on 5 September 2024 to sustain that cadence. A USGS-published user survey (Open-File Report 2019-1109) estimated the total annual economic benefit of Landsat imagery to users at about $3.45 billion in 2017. The raw observation is a public good; what you buy from an agritech vendor is the cloud masking, the index calculation, the field boundary, and the alert.
The Per-Acre Economics
Whether agritech pays is arithmetic, and the arithmetic is dominated by two lines: what you spend per acre on the subscription, and what fraction of your input bill the system can move. USDA NASS’s June 2025 Acreage report put US corn planted area at approximately 95.2 million acres, the largest since 2013 — at that scale a change of a few dollars per acre in nitrogen management is a national-scale number, and on one farm it is the whole decision.
Two prices you need and should not take from any article, including this one, because they move weekly:
- Your nutrient cost per ton. Pull it from the USDA Economic Research Service price series for the national trend, and from USDA AMS market news reports for the current regional quote on anhydrous ammonia, urea and DAP. Use the quote your retailer actually gave you where they differ.
- Your diesel cost. The US Energy Information Administration publishes on-highway diesel prices every Monday by region. Use your PADD region, not the national average.
Then the test is simple. If a monitoring subscription costs you a few dollars per acre per year, it has to change a decision worth more than that. On a nitrogen program running well into the tens of dollars per acre, a 5% reallocation clears the bar. On a low-input pasture, it may not — and that is a legitimate answer, not a failure of the technology. The 2022 Census recorded about 55.6 million irrigated acres nationally; for those operations, pumping energy alone usually makes the arithmetic obvious in the first season.
Run your own version of this before you buy anything.
Satellite monitoring ROI: what it returns on your acreage
Your inputs only — this tool contains no benchmark yield or price data. Use your own last-season figures, and treat any vendor’s yield-gain percentage as unproven until they show you two contrasting seasons.



“1,900,487 US farms in 2022 — 141,700 fewer than in 2017, on land that averaged 463 acres per operation.”

Market Access, Credit and Insurance
The market-access story in the United States is not about bypassing intermediaries — US growers already have futures markets, elevator bids and USDA Agricultural Marketing Service price reporting. It is about documentation speed. Grain moves on contracts that specify quality and delivery windows; specialty and organic buyers add audit requirements on top. Every one of those creates a paperwork event that a digital record can shorten.
Credit and crop insurance verification
Lenders and insurers spend real money confirming that a crop exists, on the acreage claimed, in the condition claimed. Historically that meant a field visit. Satellite verification changes the unit economics of that check: an underwriter can confirm planted area and in-season condition from imagery, and reserve physical inspections for the cases where the imagery and the claim disagree.
This matters most for the operations that are hardest to serve — remote acreage, small parcels, and first-generation operators without a long credit file. Farmonaut’s satellite-verified crop loan and insurance workflow (details here) exists for exactly that gap: it gives the institution a defensible record of crop area and condition without a truck roll.
For US growers, pair this with the federal layer. Crop insurance actuarial parameters, county yields and price elections are published by USDA’s Risk Management Agency, and Farm Service Agency acreage reporting deadlines are county-specific. Digital field boundaries created once can serve your FSA reporting, your insurance acreage report and your lender file — the single largest time saving most operations get from digitalization, and one that never shows up in a yield-percentage claim.
Water, Nutrients and Carbon
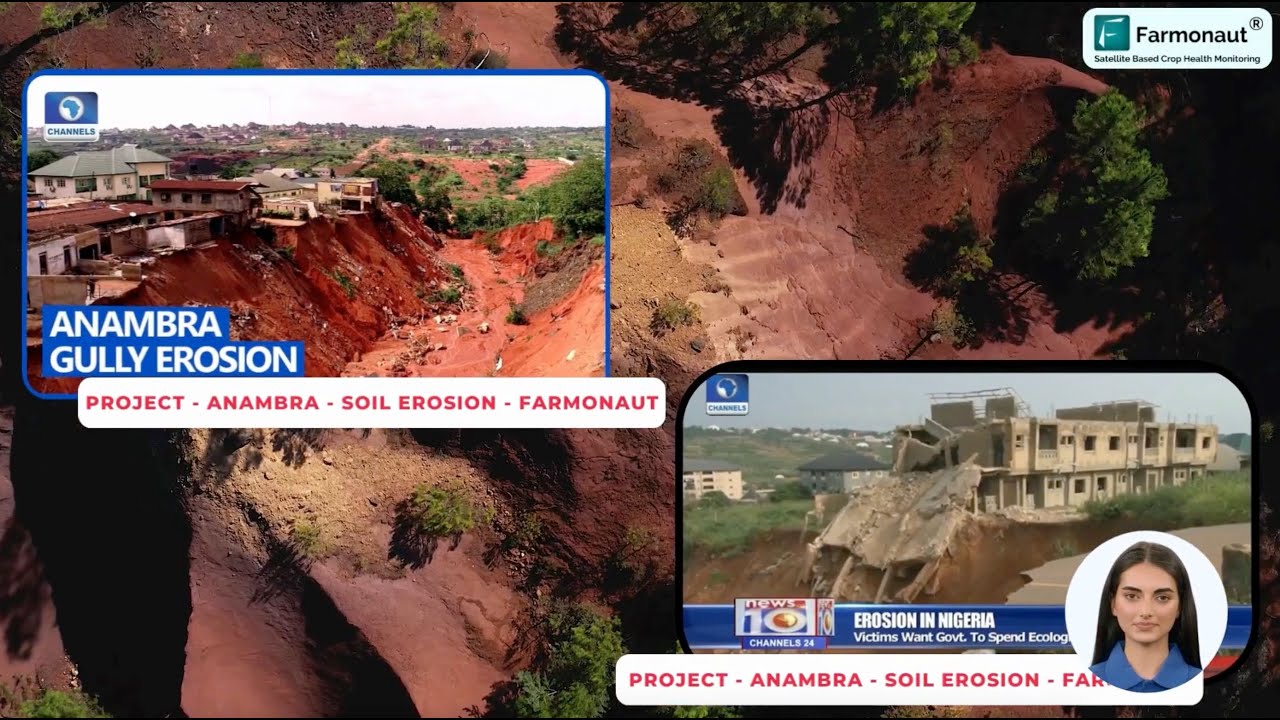
Rural agricultural land carries the largest managed water and nutrient footprint in the country. Agritech’s environmental contribution is unglamorous: it moves inputs from where they are wasted to where they are limiting.
- Irrigation. With about 55.6 million irrigated acres counted in the 2022 Census, scheduling driven by evapotranspiration models and soil-moisture readings reduces pumping without reducing availability at critical growth stages. The saving shows up on the energy bill before it shows up in yield.
- Nutrients. Variable-rate application concentrates nitrogen and phosphorus on responsive zones and pulls it off unresponsive ones. Reduced over-application is also reduced runoff — the mechanism behind most watershed nutrient targets.
- Cost-share. The NRCS Environmental Quality Incentives Program provides financial and technical assistance for conservation practices, with payment schedules published by state. Check your state’s current schedule before assuming a practice is unaffordable.
- Carbon accounting. Buyers and processors increasingly ask for field-level emissions data. Farmonaut’s carbon footprinting module turns satellite and management records into a reportable figure rather than an estimate reconstructed from receipts.
The Impact of Agritech on Food Security
Food security has a domestic dimension and a global one, and agritech affects them through different mechanisms.
Domestically, the constraint is access, not production. USDA ERS reported that 13.5% of US households — 18.0 million households — were food insecure at some point during 2023, up from 12.8% in 2022. No amount of yield technology fixes that directly; US agriculture already produces a surplus of most commodities. Where agritech contributes is in the stability and cost of supply: shorter loss windows through earlier disease detection, less spoilage through better harvest logistics, and firmer supply forecasting that dampens the price spikes that hit low-income households hardest.
Globally, production and volatility both bind. FAO’s State of Food Security and Nutrition in the World 2024 estimated that 733 million people faced hunger in 2023 — about one in eleven people worldwide. US and European agricultural exports are part of that balance, and so is the observational infrastructure: the same free Sentinel and Landsat archives that let a US grower check a field also underpin famine early-warning and global crop-condition monitoring. National production series for cross-country comparison are published by FAO FAOSTAT.
The honest framing: agritech’s food-security impact is largely a variance reduction effect, not a level effect. It narrows the gap between a good year and a bad year on a given piece of ground. In a climate where bad years are getting more frequent, that is worth more than a headline yield percentage.
Rural Jobs and Skills
Agriculture, food and related industries contributed roughly $1.5 trillion to US GDP in 2023 — about 5.5% of the total — with the output of farms themselves accounting for approximately $203 billion of that. The jobs agritech creates sit in the wider band, not the narrow one: precision ag technicians at the dealership, agronomists selling data-backed service instead of product, imagery analysts at cooperatives, and equipment specialists who can diagnose a controller as well as a hydraulic line.
These are the roles that keep young people in rural counties, because they pay like technical work and are located where the acres are. Supporting them:
- Logistics roles. Grain and input hauling is a scheduling problem; fleet management tools cut deadhead miles and idle time at the scale, which is where the margin is.
- Compliance and quality roles. Blockchain-backed product traceability converts an audit scramble into a query, and creates a permanent job maintaining the record.
- Extension and training. Land-grant university extension services run the practical training for most of this, county by county, and remain the cheapest agritech education in the country.
With the average US producer at 58.1 years old, the succession question and the digitalization question are the same question. A farm with clean digital records is a farm that can be handed over, sold, or brought under professional management without reconstructing thirty years of knowledge from memory.

What Still Blocks Adoption
Twenty-one percent of US farms reported no internet access in 2022. That is the headline barrier, and it is geographically concentrated — the Great Plains, the Mountain West, Appalachia and the Mississippi Delta carry most of it. Three others matter as much:
- Capital cost versus subscription cost. Hardware-heavy precision systems require a machinery purchase; imagery-based systems require a subscription. For an operation below the 463-acre average, the subscription route is often the only one that pencils.
- Data portability. Records locked in a machinery brand’s proprietary platform lose value the moment you change colors. Ask any vendor, including us, for a plain-format export before you commit.
- Trust in the recommendation. A grower with thirty seasons of experience will not act on an alert they cannot interpret. Systems that show the underlying imagery alongside the advice get adopted; black boxes do not.
Connectivity gaps are solvable, and satellite-delivered service is part of that solution set — the same approach documented in our case study on satellite technology bridging the digital divide in remote areas applies wherever terrestrial build-out is uneconomic. In the US the primary vehicle remains federal infrastructure funding through programs like ReConnect, plus state broadband offices that maintain their own challenge and mapping processes.
The Agritech Industry and the European Picture
The agritech industry spans four commercial segments that behave differently: equipment manufacturers embedding sensors and controllers; input suppliers bundling digital agronomy with product; independent software and imagery providers selling by subscription; and downstream buyers funding traceability so their own supply-chain claims survive audit. Venture funding across the sector has been sharply cyclical since 2021, so treat any total-market figure you encounter as dependent on which of those four segments the analyst counted — check the definition before you compare two market-size numbers.
In German-language markets the search term is agritech & Landwirtschaft, and the regulatory driver differs from the US one. EU farms operate under Common Agricultural Policy conditionality, which ties direct payments to record-keeping and environmental standards — making digital field records a compliance necessity rather than an efficiency option. Eurostat’s Farm Structure Survey counted approximately 9.1 million agricultural holdings across the EU working around 157 million hectares in 2020; current structural and area statistics for Germany and other member states are published by Eurostat. The practical difference for a vendor: in the EU, the audit trail sells the product; in the US, the input saving does.
Farmonaut Subscription Plans
Pricing is published rather than quoted, so you can run the per-acre arithmetic above against a real number before talking to anyone.
Start here: Access the Farmonaut App
Farmonaut: Agriculture and Agritech Solutions
Farmonaut sells layers two and three from the definition at the top of this page — the processing and the delivery — on top of the free public satellite archives, with no on-farm hardware to buy:
- Satellite crop health monitoring. NDVI and multispectral indices per field, updated on the satellite revisit cadence, with zone-level variation you can act on.
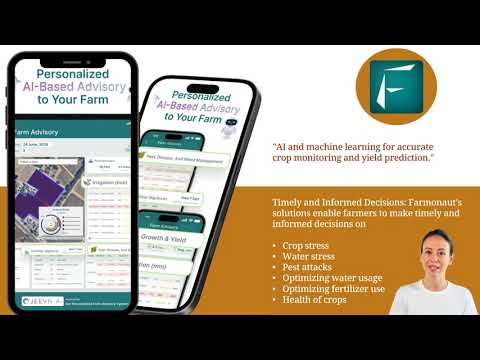
- Jeevn AI advisory. Satellite and weather inputs converted into field-specific recommendations delivered to phone or browser.
- Blockchain traceability. Harvest and movement records for buyers who audit their supply chains.
- Fleet and resource management. Machinery and haul logistics for operations where transport is a real cost line.
- Carbon footprinting. Reportable emissions data from management and satellite records (see details).
Developers and integrators: pull satellite and weather data directly through the Farmonaut API, with full developer documentation covering endpoints and authentication.
Multi-farm and plantation operators: manage many fields and users under one account with the large-scale farm management solution.
Try it on one field first. Use the cross-platform app here, or install for Android or iOS, draw a boundary, and compare a month of imagery against what you found walking it.
Frequently Asked Questions
What is agritech, in one sentence?
Agritech is the use of digital sensing, data processing and connectivity to make agricultural decisions that were previously made by direct observation — spanning satellite imagery, soil and weather sensors, farm management software, variable-rate application and supply-chain traceability.
What is the impact of agritech on rural areas?
It lets fewer people manage more acres. With US farm numbers down 7% between 2017 and 2022 and average farm size up to 463 acres, remote monitoring substitutes for labor that is no longer available. It also creates a band of technical rural jobs — precision ag technicians, data-backed agronomy, logistics — and shifts the rural constraint from equipment to connectivity, where 21% of farms still reported no internet access in 2022.
What is the impact of agritech on food security?
Mostly variance reduction rather than raw output. Earlier stress detection and better logistics narrow losses in bad years and stabilise supply. In the US, where 13.5% of households were food insecure in 2023, the binding constraint is access rather than production. Globally, with 733 million people facing hunger in 2023 per FAO, both production and volatility matter.
What are the benefits of agritech for a specific farm?
Input reallocation, earlier problem detection, faster documentation for lenders, insurers and buyers, and fewer wasted trips across the field. Test each one with the check-strip and metering methods in the verification table above — they are cheap and they settle the question in a single season.
Does agritech require broadband?
Not at full broadband speed. Processing happens on remote servers, so what reaches the farm is a compressed map and a short advisory. A usable cellular signal at the farmhouse is enough for most satellite-based platforms.
Where do I get current figures for my own county?
USDA NASS Quick Stats for census and survey data by county, USDA AMS market news for current input and commodity quotes, EIA for weekly diesel, and your state land-grant extension service for local enterprise budgets.
The Short Version
Agritech’s rural impact is real, measurable and narrower than the marketing suggests. It does not reverse consolidation — 141,700 US farms disappeared between the 2017 and 2022 censuses while average size rose to 463 acres. What it does is make the remaining operations manageable by fewer people, put a defensible data record behind credit and insurance decisions, and cut input waste in ways you can verify with check strips and a meter rather than a vendor slide.
The public data layer is free, the processing is cheap, and the honest test costs one season. Start with one field, one check strip and one metered pivot, and let the numbers decide.
Explore module-specific solutions:
- Carbon Footprinting — reportable field-level emissions
- Traceability — supply chain records buyers will accept
- Crop Loan & Insurance — satellite-verified acreage and condition
- Fleet Management — haul and machinery logistics
- Large-Scale Farm Management — the Agro Admin App
Discussion
Questions, corrections or field experience? Share them below. First-time comments are reviewed before they appear, and your email is never published.
No comments yet. Be the first to add a question or your experience.

 Crossprod
 Aamoksh One Eighty
 Patrick America
 Liquify Digital
 CU Foods
 BeyondTech Global
 Rouge VC
 AgroGreen Dynamics
 AgroRisk
 Oath Inc
 Reddane Farming
 Esri North East Africa
 Cresol
 MDCV UK
 Zerella Group
 Etech Consulting Madagascar
 Vestlandsforsking
 Delicio
 WB Dev
 Sama Premium
 Exploration consultancy · South Africa · Gold
 Licence holder · Niger · Gold










