

Silver mining costs · Data guide
Silver Mining Cost per Ounce: Regions, Miners, Calculator
Primary silver mines averaged an all-in sustaining cost of US$12.21 an ounce in 2025, but company reports range from minus US$10.71 to US$52.31. See why, by region and by miner, then run your own cost.
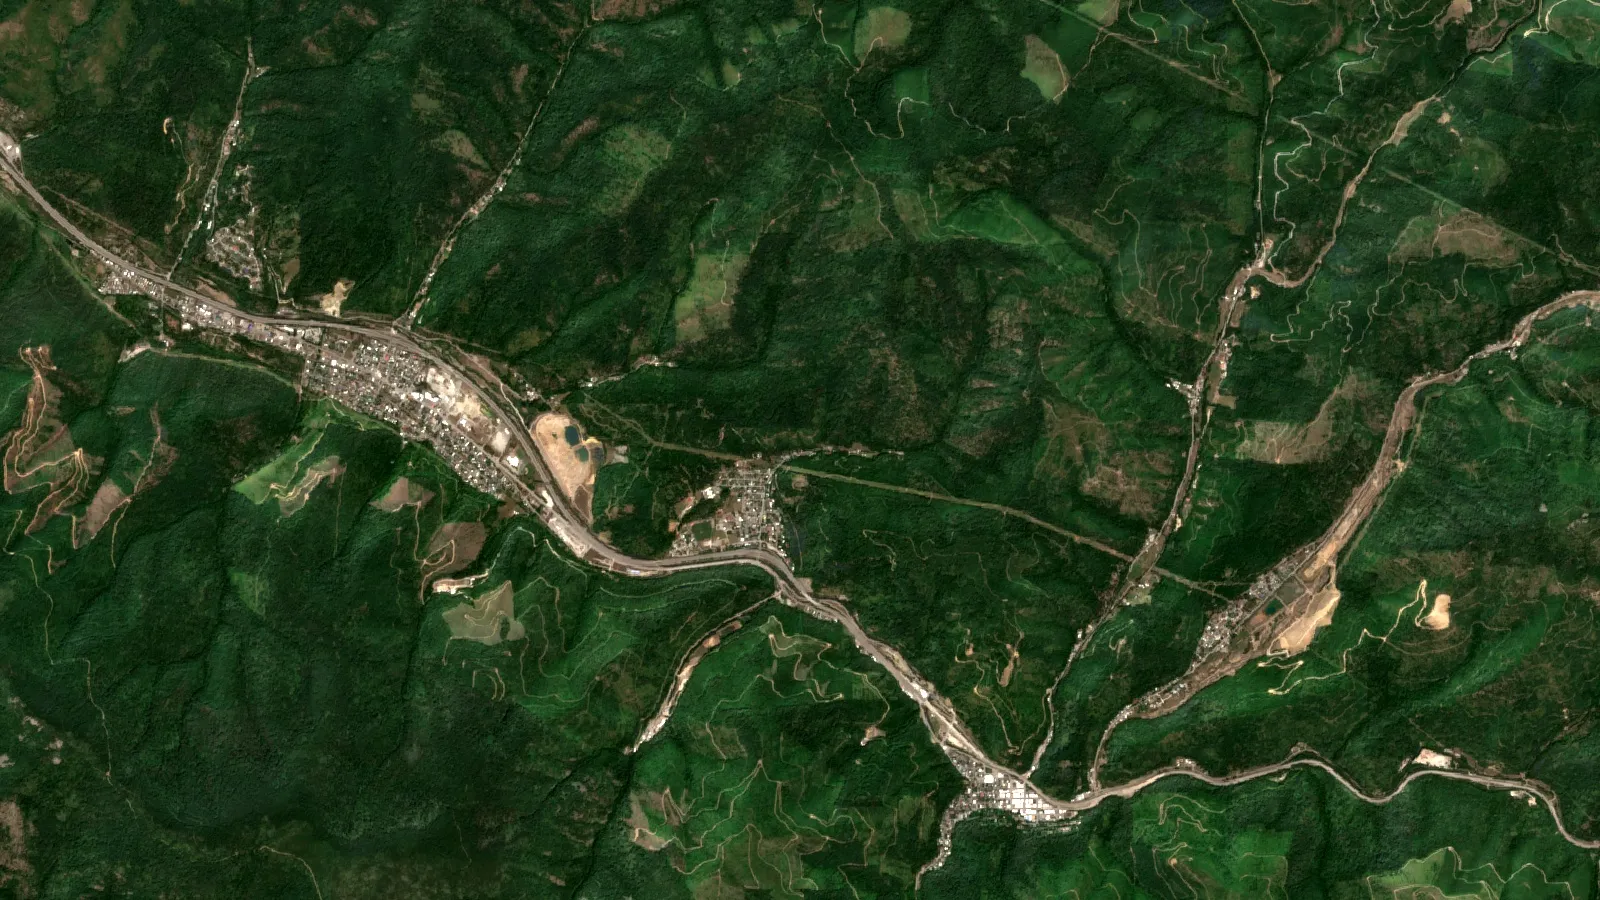
Key takeaways
- Primary silver mines averaged US$12.21/oz AISC and US$5.21/oz total cash cost in 2025, on a by-product basis (Metals Focus, in the Silver Institute World Silver Survey 2026).
- North America had the lowest regional AISC at US$10.28/oz in 2025; Oceania rose 37% to US$14.15/oz after a grade drop at Cannington.
- Only 26.1% of 2025 mined silver came from primary silver mines; lead-zinc, copper and gold mines supplied the rest, so by-product prices set many silver costs.
- Company-level AISC for the latest reported period ranges from US$6.07/oz at Hecla to US$40.63/oz at Americas Gold and Silver (both second quarter 2026), because company bases differ.
- Spot silver was US$54.08/oz on 26 October 2026 (Fortune), against a 2025 average of US$40.03 and a primary-mine AISC margin of US$27.81/oz.
In this article
- How much does it cost to mine an ounce of silver
- Cash cost, total cash cost and AISC explained
- Silver mining cost per ounce by region
- Why the cost of an ounce can be negative or above US$40
- Silver mining costs by company
- Americas Gold and Silver production costs at Galena and Cosalá
- Where the money goes in a silver mine
- Why silver mining costs move
- Silver supply by source and why most ounces are by-products
- Calculate your own cost per ounce of silver
- How to compare silver miners' costs properly
- Lowering silver exploration cost before the mine is built
- Frequently asked questions
Primary silver mines produced silver at a global average all-in sustaining cost (AISC) of US$12.21 an ounce in 2025, with a total cash cost of US$5.21 an ounce, on a by-product basis, according to Metals Focus data in the Silver Institute’s World Silver Survey 2026. That average hides a very wide spread. In the second quarter of 2026, Hecla reported an AISC of US$6.07 per silver ounce after by-product credits, while Americas Gold and Silver reported US$40.63 per silver ounce sold. Spot silver stood at US$54.08 an ounce at 8:15 a.m. Eastern Time on 26 October 2026 (Fortune).
This page explains what those cost numbers mean, shows them by region and by company, and lets you run your own cost per ounce. Each figure carries its source and period, because silver costs are quoted on several different bases and the same mine can look cheap or expensive depending on which one you read.
How much does it cost to mine an ounce of silver
There is no single price, because miners report three different cost measures and each answers a different question. The Silver Institute’s survey, built on the Metals Focus Silver Mine Cost Service, gives the global averages for primary silver mines (mines run mainly for their silver) in the table below. All three figures are on a by-product accounting basis, which means revenue from gold, lead, zinc and copper is subtracted from the cost of producing silver.
Chart
Primary silver mining costs, global average
US$ per ounce, by-product basis, 2016 to 2025
| Cost measure (primary silver mines, global average) | 2024, US$ per oz | 2025, US$ per oz | Change |
|---|---|---|---|
| Cash operating cost | 5.10 | 4.10 | -20% |
| Total cash cost (TCC) | 5.91 | 5.21 | -12% |
| All-in sustaining cost (AISC) | 12.36 | 12.21 | -1% |
Source: Metals Focus, in the Silver Institute World Silver Survey 2026, Appendix 13. The 2025 silver price averaged US$40.03 an ounce (London), so the average primary silver mine earned an AISC margin of about US$27.81 an ounce, and an estimated 99% of primary silver production was profitable.
The cost of sustaining a mine is a large part of the gap. AISC sits well above cash cost because it adds sustaining capital, corporate overhead and exploration. Sustaining capital spending rose by 18% in 2025, according to the same survey, because of new projects ramping up and more expansion work.
Cash cost, total cash cost and AISC explained
A cash cost counts the money spent at the mine site to produce metal: mining, milling, site administration, refining charges and royalties. The Silver Institute defines total cash costs as all direct and indirect mine-site cash costs of producing metals, including mining, on-site processing, general and administrative costs, third-party refining, royalties and production taxes, net of by-product revenue. A by-product credit is that revenue from other metals taken out of the cost line.
All-in sustaining cost (AISC) adds the things a mine must keep paying to stay in business: community costs, sustaining capital spending, corporate general and administrative expense and exploration. Most listed miners follow this layout, and it is the number to use when you ask whether a mine makes money at today’s silver price. In company reports AISC normally leaves out growth projects and income tax, so it is not the full cost of building a new mine. For a wider explanation of the metric across commodities, see our guide to all-in sustaining cost in mining.
Two more terms appear in company reports. A primary silver mine earns most of its revenue from silver. A silver equivalent (AgEq) ounce converts the gold, lead and zinc a mine sells into silver ounces at fixed metal prices, so one cost per ounce can describe a whole polymetallic mine. The two accounting styles give very different numbers for the same rock, which is why the company section below states the basis for every figure.
Silver mining cost per ounce by region
Costs differ by region because ore grade, by-product mix, wages, currency and tax regimes differ. In 2025, primary silver AISC was lowest in North America at US$10.28 an ounce and highest in the CIS countries at US$16.23, with Central and South America at US$13.98, Oceania at US$14.15 and Asia at US$10.74 (Metals Focus, in the Silver Institute survey). North America’s primary silver mines are therefore among the cheapest, helped by gold, copper and zinc credits.
Chart
Primary silver AISC by region
US$ per ounce, by-product basis, 2024 versus 2025
The survey explains why. In the United States, total cash cost and AISC fell sharply because gold by-product credits grew by 63%, and Hecla’s Greens Creek mine reported much lower AISC from higher by-product credits and lower treatment charges. In Oceania, costs rose after the silver grade at South32’s Cannington mine fell by 18%, which lifted its total cash cost by 82% and AISC by 37%. In Mexico, a stronger peso and a 1% rise in the special mining duty rate from January 1, 2025 pushed costs up.
The table gives the cost of each part of the build-up by region, so you can see how large the cash portion is compared with the sustaining portion.
| Region (primary silver mines) | Total cash cost 2025, US$/oz | AISC 2025, US$/oz | AISC change from 2024 |
|---|---|---|---|
| North America | 3.08 | 10.28 | -5% |
| Central and South America | 7.14 | 13.98 | -4% |
| CIS | 12.12 | 16.23 | -15% |
| Asia | 1.31 | 10.74 | +11% |
| Oceania | 7.31 | 14.15 | +37% |
| Global total | 5.21 | 12.21 | -1% |
Source: Metals Focus, in the Silver Institute World Silver Survey 2026. Regional averages are by-product figures weighted by production, and small regions can swing on one mine.
Why the cost of an ounce can be negative or above US$40
Company reports show a far wider range than regional averages, and the reason is the accounting basis. Hecla Mining Company (NYSE: HL), which mines silver, gold, lead and zinc at Greens Creek in Alaska and Lucky Friday in Idaho, reported a second-quarter silver cash cost of minus US$8.10 an ounce after by-product credits (Hecla, 4 August 2026). Negative means the gold, lead and zinc revenue from that mine was larger than its whole cash cost, so each silver ounce was effectively produced at a gain before sustaining costs. Greens Creek, which the Alaska Division of Geological & Geophysical Surveys calls the largest silver producer in the U.S. and which also yields zinc, lead, gold and copper, posted an AISC of minus US$10.71 an ounce; Lucky Friday posted US$17.08.
Other companies report on other bases. Pan American Silver reported a silver-segment AISC of US$17.80 per silver ounce for the second quarter of 2026, net of credits from other metals, against an average realized silver price of US$70.97 (Pan American Silver, Q2 2026 report). Fresnillo plc reports per equivalent silver ounce: for the first half of 2026, AISC was US$15.82 at Juanicipio, US$25.23 at San Julián veins, US$29.32 at Saucito and US$32.87 at the Fresnillo mine, up 39% to 71% on a year earlier, which Fresnillo attributes to higher cash cost and higher sustaining spending per equivalent ounce (the cash cost rise reflects a higher silver price in the equivalent-ounce maths and a higher cost per tonne) (Fresnillo plc, interim results, 2026). First Majestic guides to a 2026 AISC of US$27.69 to US$28.77 per payable silver equivalent ounce, calculated at US$52 silver and US$3,900 gold (First Majestic, Q2 2026 production release). Its third-quarter release (8 October 2026) reported 3.4 million silver ounces, 72% of the guidance midpoint, with a 12-day labour dispute at San Dimas cited as the main cause of the shortfall (First Majestic, Q3 2026 production release).
Because the bases differ, do not rank these companies on one number. The chart below lines them up only to show the spread, and its caption states the basis for each.
Silver mining costs by company
| Company or mine | Period | Cost basis | AISC, US$ per oz |
|---|---|---|---|
| Hecla, all silver operations (excluding Keno Hill) | Q2 2026 | Per silver oz, after by-product credits | 6.07 |
| Hecla, Greens Creek (Alaska) | Q2 2026 | Per silver oz, after by-product credits | -10.71 |
| Hecla, Lucky Friday (Idaho) | Q2 2026 | Per silver oz, after by-product credits | 17.08 |
| Pan American Silver, silver segment | Q2 2026 | Per silver oz, net of other-metal credits | 17.80 |
| Fresnillo plc, Juanicipio | First half 2026 | Per equivalent silver oz | 15.82 |
| Fresnillo plc, Saucito | First half 2026 | Per equivalent silver oz | 29.32 |
| First Majestic, consolidated guidance | Full-year 2026, midpoint of range | Per payable AgEq oz at US$52 silver | 28.23 |
| Americas Gold and Silver, consolidated | Q2 2026 | Per silver oz sold, after by-product credits | 40.63 |
Chart
Reported silver AISC by company, selected periods
US$ per ounce; bases and periods differ (see table above)
Sources: company releases linked in the section above and in the Sources list. The First Majestic midpoint is the average of the US$27.69 and US$28.77 guidance range. Juanicipio is owned 44% by Pan American Silver, which includes its share in its attributable figures. This is a statement of reported costs, not a ranking of which company is better run, and it is not investment advice.
Americas Gold and Silver production costs at Galena and Cosalá
Americas Gold and Silver Corporation (TSX: USA, NYSE American: USAS) runs the Galena Complex in Idaho and the Cosalá Operations in Sinaloa, Mexico. For 2026 it guides to 3.2 to 3.6 million ounces of silver at an AISC of US$30 to US$35 per ounce sold. Its reported cost per silver ounce sold was US$34.12 (AISC) and US$23.57 (cash cost) in the first quarter, then US$40.63 (AISC) and US$25.68 (cash cost) in the second quarter, giving US$36.92 and US$24.48 for the first half (Americas Gold and Silver, Q2 2026 results; Q1 2026 results).
The two mines differ sharply. In the second quarter Cosalá, a high-grade silver-copper mine, had a cash cost of US$16.91 and an AISC of US$29.94 per silver ounce sold, helped by copper by-product credits. The Galena Complex, where the company was finishing a shaft upgrade that raised hoisting capacity by about 150%, had a cash cost of US$35.26 and an AISC of US$52.31. Galena also produced about 328,000 ounces of silver, against about 420,000 a year earlier, which spreads fixed costs over fewer ounces. The company’s own filing reconciles the consolidated second-quarter figures as follows.
| Build-up of second-quarter cost | US$ thousand | US$ per oz sold |
|---|---|---|
| Direct mining costs | 23,661 | 37.90 |
| Smelting, refining and royalty expenses | 525 | 0.84 |
| Less by-product credits | -8,152 | -13.06 |
| Cash cost | 16,034 | 25.68 |
| Sustaining capital and exploration | 9,335 | 14.95 |
| All-in sustaining cost | 25,369 | 40.63 |
Source: Americas Gold and Silver, Q2 2026 results; US$ per oz is the US$ thousand figure divided by 624,343 silver ounces sold. It is a useful worked example because it shows the whole chain, from direct mining cost to the all-in number, on one page.
Where the money goes in a silver mine
The cost split depends on the mine, and no published global percentage table covers labour, energy and consumables. What company and industry data do show:
- Direct mining and processing is the biggest block. At Americas Gold and Silver it was US$23.7 million in the second quarter, against cash costs of US$16.0 million after by-product credits.
- By-product credits offset about a third of that: US$8.2 million, or US$13.06 per ounce sold in the same quarter.
- Sustaining capital and exploration added US$9.3 million, about 37% of that company’s AISC.
- Labour, energy and consumables are described by Metals Focus as major cost drivers, with labour mixed by region and cyanide cheaper in North and South America than elsewhere.
- Royalties and duties rise with price. Higher silver, gold and zinc prices lifted royalty payments in 2025, offsetting part of the fall in cash cost.
The Silver Institute counts reclamation and closure obligations in total production costs, which add depreciation, amortization and those obligations to the cash cost, so a mine’s full cost sits above both cash cost and AISC. The short animation below on the environmental impacts of mining shows why land rehabilitation and water treatment appear on the cost sheet.
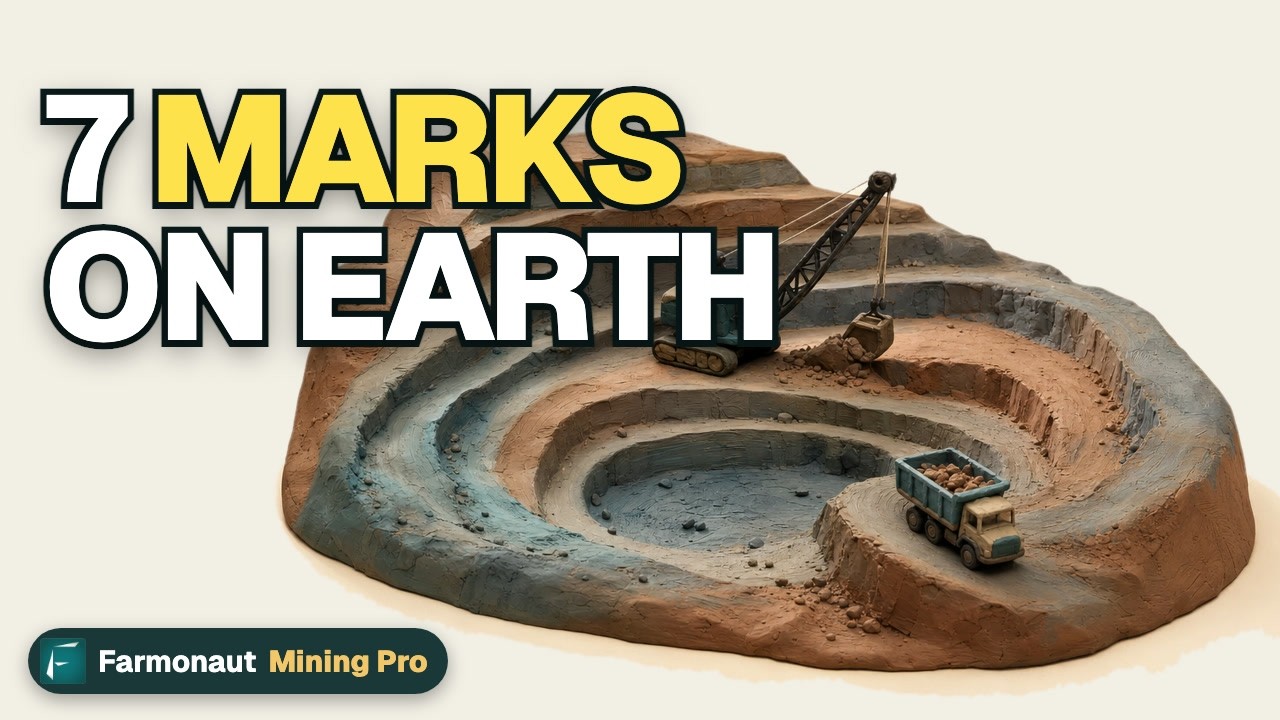
▶ The seven environmental impacts of mining, explained in clay animation. · 2:31
Why silver mining costs move
Five drivers explain most of the year-to-year change in the sourced figures:
- By-product prices. In 2025, gold by-product revenue rose by 36% worldwide and completely offset lower lead and copper credits, which held silver costs down. If gold falls, those credits shrink and silver cost per ounce rises.
- Ore grade. A drop in grade raises cost per ounce because the same plant produces fewer ounces. South32’s Cannington mine is the survey’s example.
- Currency. Mexican, Peruvian and Chinese currencies strengthened against the US dollar in 2025, which raised local costs measured in dollars.
- Inflation and fuel. Metals Focus expects higher crude oil prices and inflation to raise on-site costs in 2026, especially labour and consumables.
- Price-linked costs. Royalties and some taxes are a share of revenue, so a higher silver price lifts them. Equivalent-ounce reporting also moves with the price assumption, which is one reason Fresnillo’s first-half 2026 cost per equivalent ounce rose.
Silver supply by source and why most ounces are by-products
Only about one in four silver ounces comes from a primary silver mine. Of 846.6 million ounces mined in 2025, lead-zinc mines supplied 249.1 million, copper mines 237.3 million, primary silver mines 221.1 million and gold mines 134.7 million (Metals Focus). The primary share of 26.1% is a new low, so supply depends more and more on gold and base-metal prices than on silver alone. That is also why the cost of an ounce often depends on another metal’s price. The US Geological Survey puts 2025 world mine production at about 26,000 tonnes and reserves at 610,000 tonnes, and reports that US mines produced about 1,100 tonnes in 2025 at four silver mines and, as a by-product or co-product, at 31 base- and precious-metal operations, with Alaska the leading state (USGS Mineral Commodity Summaries 2026).
Chart
Mined silver by source metal, 2025
Million ounces
By country, Metals Focus counts Mexico as the largest producer in 2025 at 172.9 million ounces, ahead of Peru at 130.6 million and China at 112.8 million. The United States produced 35.7 million ounces, up 5%.
Calculate your own cost per ounce of silver
Use the calculator below to convert your own tonnage, grade, recovery and unit costs into a cash cost, an AISC and a margin per ounce. The defaults are round example numbers for a mid-size underground mine, not benchmarks, and the silver price is an input you should replace with today’s price. The results include a break-even silver price, the price at which revenue per ounce equals the AISC calculated here. It leaves out corporate overhead and community costs, so add them to the sustaining line for a full match.
Calculator
What is your AISC and margin per ounce of silver?
Enter your own mine numbers; the results update as you type.
- Silver ounces sold per year: 2,049,609
- Cash cost per ounce (US$): 24.39
- Break-even silver price (US$/oz): 28.30
- Margin per ounce at your price (US$): 21.70
- Annual margin before tax (US$): $44,480,428
Example values only, not a benchmark. Operating cost per tonne is mining, milling, site administration, refining and royalties together. AISC here is operating cost minus by-product credit, plus sustaining capital and exploration, divided by silver ounces sold. The Silver Institute definition also adds corporate overhead and community costs, so add them to the sustaining line for a full match (Metals Focus, World Silver Survey 2026). Silver price is an input: example, use today’s price.
How to compare silver miners’ costs properly
Before you rely on a cost figure, check these points in the company’s filing:
- Basis. Is it per silver ounce after by-product credits, or per silver equivalent ounce? The two can differ by tens of dollars for the same mine.
- Period. Quarterly numbers jump around; annual figures and guidance ranges are steadier.
- Scope. Does the AISC include corporate overhead, exploration and sustaining capital, and does it exclude growth capital? Americas states that its AISC is for operations only and excludes share-based payments and derivative settlements.
- Price assumptions. First Majestic’s guidance uses a fixed US$52 silver and a 75:1 gold-to-silver ratio, so its cost per equivalent ounce moves if you change those inputs.
- By-product dependence. Ask what the cost would be with no gold or zinc credit. Hecla’s Greens Creek cost is negative only because other metals pay for the mine.
- Ownership share. Joint ventures such as Juanicipio are reported on different shares by their owners.
For a Mining Pro course chapter that builds an AISC and break-even picture step by step, see the video below.
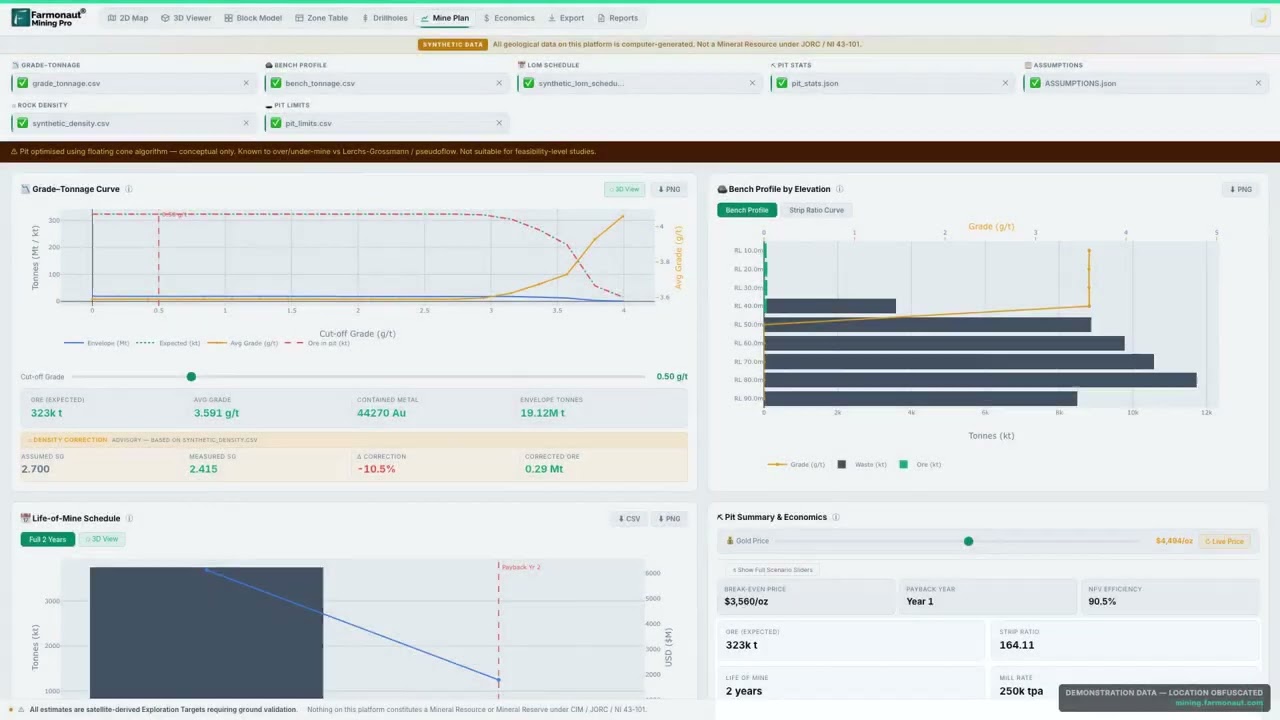
▶ Farmonaut Mining Pro course, chapter 13: building a cost picture with all-in sustaining cost per ounce, break-even price and payback. · 14:58
Lowering silver exploration cost before the mine is built
Production cost is only one part of the story. Early exploration spending also matters before any ounce is produced. Farmonaut, a US-based satellite data company, maps alteration zones, faults and anomalies from satellite imagery for a boundary you supply as a KML, KMZ or polygon file. Results are exploration targets, not a resource estimate, and they sit ahead of drilling and any resource report. Farmonaut states that it can lower early-exploration cost by up to 80-85%, with delivery in 5 to 20 business days depending on area size and mineral complexity.
More from Farmonaut: Farmonaut home, agro admin app, web app, carbon footprinting, weather API docs, fleet management and product traceability.
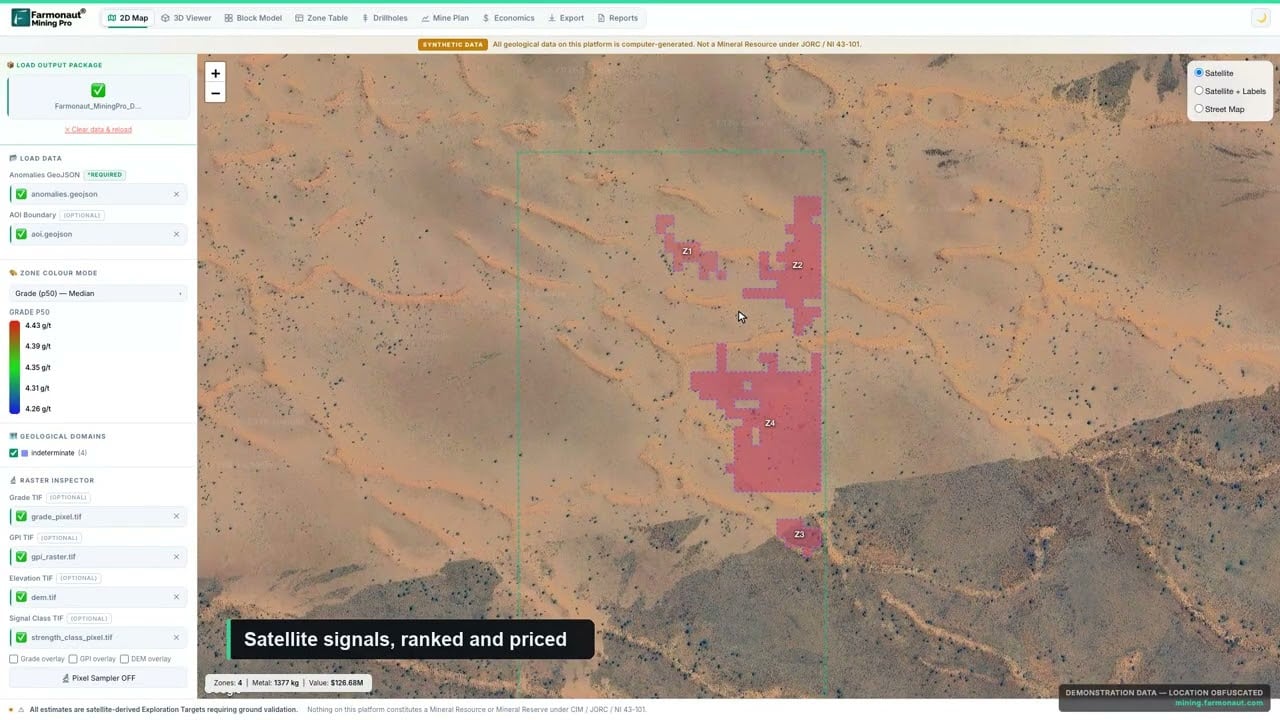
▶ A short look at Farmonaut Mining Pro, which turns a licence boundary into a satellite-based geological picture. · 4:56
Frequently asked questions
How much does it cost to mine one ounce of silver?
Primary silver mines averaged an AISC of US$12.21 an ounce and a total cash cost of US$5.21 in 2025, on a by-product basis (Metals Focus, in the Silver Institute World Silver Survey 2026). Single companies reported between minus US$10.71 and US$52.31 per ounce in 2026 depending on the mine and the accounting basis.
What is the all-in sustaining cost of silver mining?
AISC is the total cash cost of producing silver plus community costs, sustaining capital, corporate overhead and exploration, divided by the ounces sold. It shows what a mine must earn per ounce to keep operating without growth spending.
Why do some silver miners report a negative cost per ounce?
Because revenue from by-products such as gold, lead and zinc is deducted from silver’s cost. At Greens Creek, those credits exceeded the whole AISC, giving minus US$10.71 an ounce in the second quarter of 2026.
Which region has the cheapest silver mining?
On the Silver Institute figures, North America had the lowest primary-silver AISC in 2025 at US$10.28 an ounce, followed by Asia at US$10.74 and Central and South America at US$13.98. Regional averages depend on a few large mines.
How does the cost of mining silver compare with the silver price?
The 2025 average London price of US$40.03 an ounce was about US$27.81 above the average AISC of primary mines. On 26 October 2026, spot was US$54.08, against US$64.30 a month earlier and US$46.90 a year earlier (Fortune).
Is most silver mined as a by-product?
Yes. Primary silver mines supplied 26.1% of 2025 mine output; the rest came from lead-zinc, copper and gold mines (Metals Focus).
What is a silver equivalent ounce?
It is a unit that converts a mine’s gold, lead, zinc and copper output into silver ounces using fixed metal prices, so one cost per ounce can cover a polymetallic mine. First Majestic and Fresnillo report this way.
What does Americas Gold and Silver pay per ounce of silver?
It reported an AISC of US$40.63 and a cash cost of US$25.68 per silver ounce sold in the second quarter of 2026, and guides to US$30 to US$35 AISC for 2026.
Does a higher silver price raise mining costs?
Partly. Royalties and some taxes are a share of revenue and rose with prices in 2025, and equivalent-ounce costs rise when the assumed silver price rises. Metals Focus also expects higher energy and inflation costs in 2026.
How much silver does the United States mine?
The USGS estimates about 1,100 tonnes of US mine production in 2025, valued at about US$1.4 billion, from four silver mines and 31 by-product operations, with Alaska the leading state.
How can I estimate the cost of my own silver project?
Start with tonnes milled, head grade, recovery, operating cost per tonne, by-product credit per tonne and sustaining capital, then use the calculator above to get the cash cost and AISC per ounce; the AISC is also your break-even silver price.
This page is for information only. It is not investment advice. Company figures are non-GAAP measures on different bases; read each filing before comparing them.
Farmonaut mining
Get a quote to map your silver ground from space
Mining business owners can send a boundary as KML, KMZ or polygon and request a quote for a satellite-based exploration report.
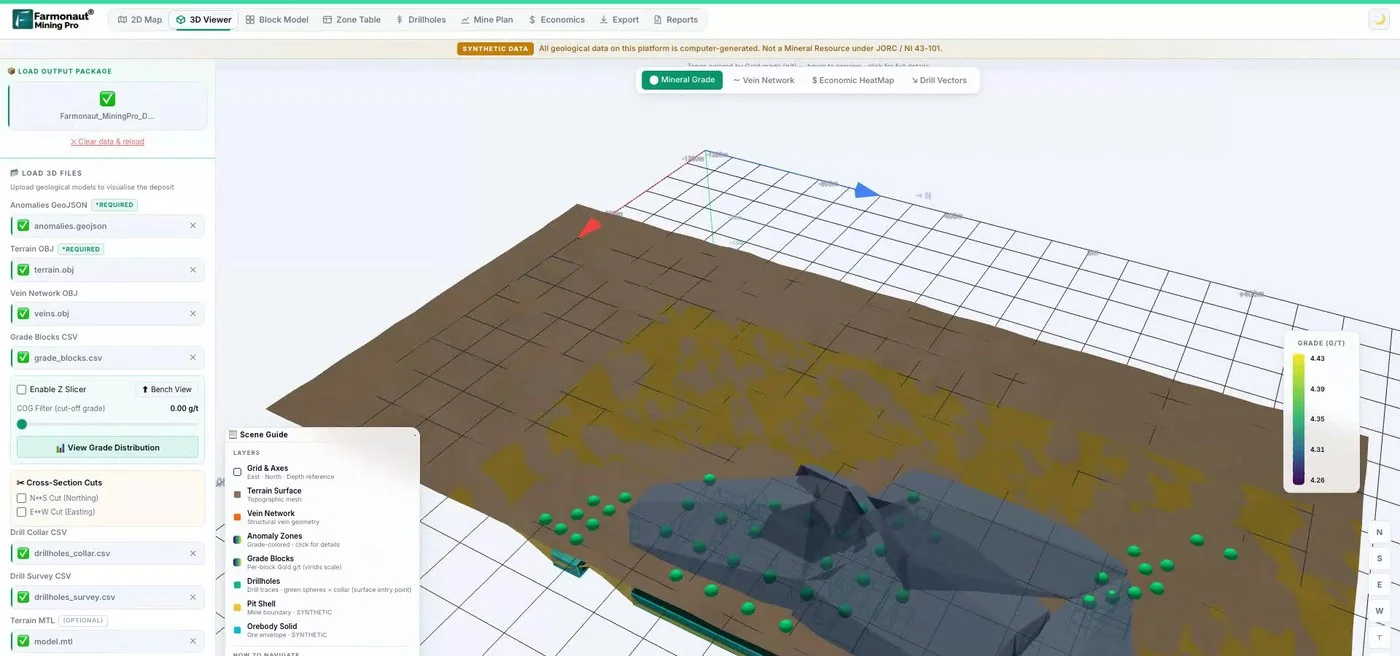
Mining Pro sample view, synthetic data
Keep reading
Sources
- Silver Institute / Metals Focus, World Silver Survey 2026: silverinstitute.org
- USGS, Mineral Commodity Summaries 2026: Silver: pubs.usgs.gov
- Hecla Mining Company, Second Quarter 2026 results (4 August 2026): finance.yahoo.com
- Pan American Silver, Q2 2026 results report: panamericansilver.com
- Fresnillo plc, Interim results for the six months to 30 June 2026: investegate.co.uk
- First Majestic, Q2 2026 production results and updated 2026 guidance: newsfilecorp.com
- First Majestic, Q3 2026 production results (8 October 2026): theglobeandmail.com
- Americas Gold and Silver, Q2 2026 financial results: finviz.com
- Americas Gold and Silver, Q1 2026 results: americas-gold.com
- Fortune, Current price of silver (26 October 2026): fortune.com
- Alaska DGGS, Alaska’s Mineral Industry: dggs.alaska.gov
Discussion
Questions, corrections or field experience? Share them below. First-time comments are reviewed before they appear, and your email is never published.
No comments yet. Be the first to add a question or your experience.

 Mwerezi Minerals Company Limited
 Congo Mining Solutions
 Mining SARL
 SenGold Invest SAS
 Sania Corporation
 Sean Mining Limited
 NTS Group (Pty) Ltd
 Mine4Africa
 Lithspo Minerals Limited
 Tintina Mining Group
 Dalgety Minerals Pty Ltd
 Vortex Minerals Pty Ltd
 Faith At Work (Pty) Ltd
 Geotech Mining Solutions plc
 Vulcan International Limited
 Kidepo Associates
 GKY Mining
 Alkimy SARL
 Double A Trading

 Licence holder · Nigeria · Gold + lithium










