

Diamond and silver miners · Output ranking
Largest Diamond Mining Companies and Top Silver Miners
ALROSA reported 29.8 million carats for 2025 and De Beers 21.7 million; Fresnillo led the silver miners with 48.7 million ounces. Ranked on each company’s own basis, with the 2026 changes.
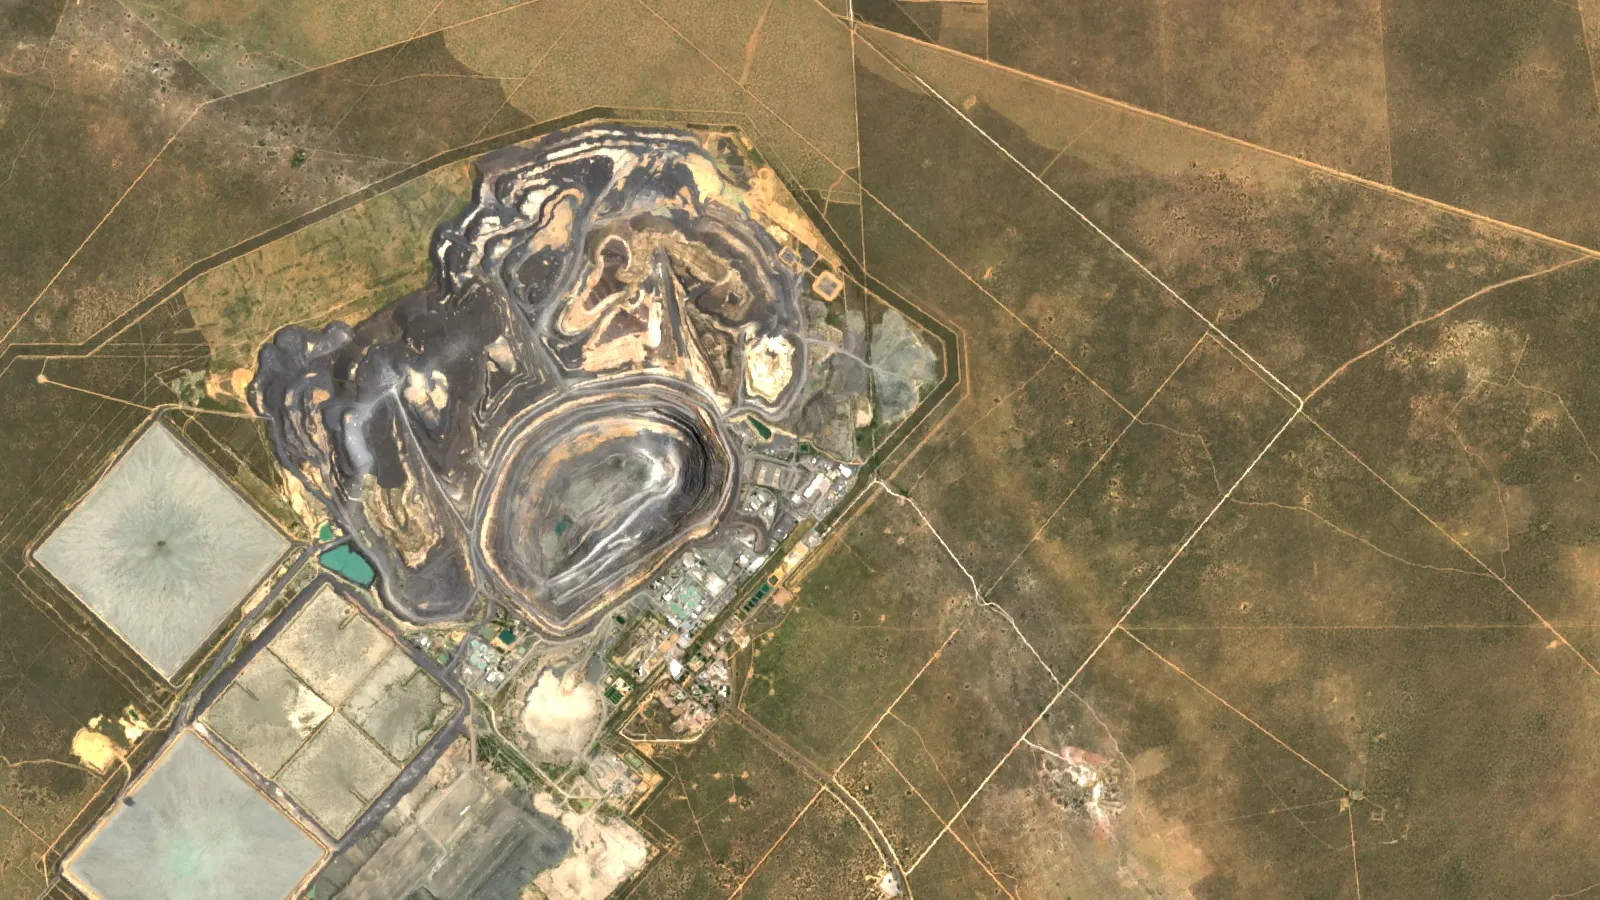
Key takeaways
- ALROSA mined 29.8 Mct of diamonds in 2025 (ALROSA, July 2026); De Beers produced 21.7 Mct, down 12% (Anglo American, February 2026).
- Rio Tinto’s Diavik, 4.43 Mct in 2025, stopped production on 26 March 2026; Petra’s Finsch mine is in business rescue (company reports, 2026).
- World rough output fell to 98.8 Mct in 2025 from 107.9 Mct, yet value held at US$9.23 billion (Kimberley Process data via GJEPC, 2026).
- Fresnillo produced 48.7 Moz of silver in 2025, KGHM 43.3 Moz and Newmont’s Peñasquito 28 Moz (company results, 2026).
- Mexico mined about 6,300 t of silver in 2025, ahead of Peru (3,600 t) and China (3,400 t) (USGS, 2026).
In this article
- Largest diamond mining companies by carats produced
- Where the carats come from: Russia, Botswana and Angola
- Industrial diamond: a different market
- The largest diamonds ever found
- Largest silver mining companies by ounces produced
- Which countries mine the most silver
- Output value calculator for diamond and silver miners
- What satellite images add at a mine
- Frequently asked questions
ALROSA of Russia is the largest diamond miner by volume: it reported 29.8 million carats for 2025 (ALROSA, July 2026). De Beers comes second at 21.7 million carats (Anglo American, February 2026), and Rio Tinto’s Diavik mine in Canada, at 4.43 million carats, closed in March 2026. On silver, Fresnillo plc led the companies below with 48.7 million ounces (Fresnillo, March 2026). This page ranks both groups on reported output, says which basis each company uses, and shows what changed in 2026.
A carat is 0.2 grams. A “Mct” is one million carats. For silver, “Moz” means million troy ounces, and one troy ounce is 31.1035 grams. Company figures are not always on the same footing, so each row below states its basis.
Largest diamond mining companies by carats produced
The table ranks the main producers that publish their own carat counts. All figures are the latest full financial year available, and each company’s source is linked in the text under the table.
Chart
Diamond output of four producers, latest year
Million carats; ALROSA and De Beers 2025, Rio Tinto Diavik 2025 (100%), Petra year to June 2026
| Company | Output | Period and basis | Main operations | Position in late 2026 |
|---|---|---|---|---|
| ALROSA (Russia) | 29.8 Mct | 2025, whole company | Yakutia and Arkhangelsk Region | Shut some low-margin sites |
| De Beers (Anglo American) | 21.7 Mct | 2025, 100% basis (Gahcho Kué at 51%) | Botswana, Namibia, South Africa, Canada | For sale; 2026 guidance 21 to 26 Mct |
| Rio Tinto (Diavik) | 4.43 Mct | 2025, 100% basis | Northwest Territories, Canada | Production ended 26 March 2026 |
| Petra Diamonds | 2.34 Mct | Year to 30 June 2026 | Cullinan and Finsch, South Africa | Finsch in business rescue |
| Lucara Diamond | 0.35 Mct sold | 2025, carats sold | Karowe, Botswana | Underground expansion |
For scale, the Kimberley Process, the government-backed scheme that tracks rough diamonds, counted 98.8 Mct of world rough production in 2025, down from 107.9 Mct a year earlier (Kimberley Process figures, reported by GJEPC, July 2026). On that count De Beers’ 21.7 Mct is about 22% of the world total. That share is our own arithmetic, and the two bases differ slightly.
ALROSA: the volume leader
ALROSA is Russian and describes itself as the world’s leading natural diamond producer by volume. Its 2025 output was 29.8 million carats (ALROSA, 16 July 2026), a fall of about 10% on 2024, and Reuters put its share at around a third of world output (Reuters via Kitco, December 2025). The company works under Western sanctions and shut some low-margin sites that make under 1 Mct a year. Our page on the Mir diamond mine covers one of its best-known pits.
De Beers: second by volume, now for sale
Anglo American owns 85% of De Beers (Miningmx, July 2026). Its rough production fell 12% to 21.7 Mct in 2025, a cut the company tied to weak demand, with an average realised price of US$142 per carat (Anglo American Q4 2025 production report). Output in the fourth quarter alone was 3.8 Mct after maintenance stops at Jwaneng and Orapa in Botswana. Anglo American is selling the business. In late July 2026 its chief executive said talks were in their final stages but not exclusive to one buyer (Miningmx, 30 July 2026). The second-quarter 2026 report shows 7.8 Mct for the quarter and guidance of 21 to 26 Mct for the year (Anglo American Q2 2026 production report).
Rio Tinto: Diavik has closed
Diavik produced 4.43 Mct on a 100% basis in 2025, up 61% on 2024 on improved operational performance (GJEPC Solitaire, 2026). Production ended on 26 March 2026 after 23 years and more than 150 Mct, because the economic reserves were used up. Diavik was Rio Tinto’s last diamond mine, after Argyle in Australia closed in November 2020 (IDEX Online, March 2026). Older lists that still show Rio Tinto as an active diamond miner are out of date.
Petra Diamonds: Cullinan stays, Finsch is in rescue
Petra recovered 2.34 Mct in the year to 30 June 2026, 4% less than the year before (Cullinan 1.40 Mct, the rest from Finsch), and sold 2.29 Mct for US$206 million. Finsch entered business rescue, South Africa’s court-supervised process for companies in financial distress, (announced 29 May 2026), and its production is suspended. Net debt stood at US$322 million (Petra Diamonds, Q4 and FY 2026 update, July 2026). Cullinan, near Pretoria, was formerly known as the Premier mine. See also our page on the Premier mine. Cullinan’s average price rose to US$106 per carat in the year, while Finsch fell to US$64.
Lucara and the Karowe mine
Lucara is small by volume but known for very large stones. It sold 353,302 carats for US$159.7 million in 2025, which works out to about US$452 per carat on our arithmetic, and recovered 31 stones above 100 carats, three of them above 1,000 carats (Lucara, year-end 2025 results, March 2026).
Angola and Catoca
Angola produced about 15.2 Mct in 2025 at an average of US$101.94 per carat, with the Catoca and Luele kimberlites supplying roughly 90% of the national total (Miningmx, citing Angola’s mining regulator). The national figure is the clearest measure for Angola, so it appears with the countries below rather than in the company table.
Where the carats come from: Russia, Botswana and Angola
Russia mined 31.5 Mct in 2025, down 15.6% from 37.3 Mct, worth US$2.72 billion at about US$86 per carat. Botswana mined 15.5 Mct, down 14.5%, yet its value rose 45.5% to US$1.98 billion, or about US$128 per carat. Russia, Botswana and Angola together made close to 63% of world value (GJEPC Solitaire, Kimberley Process 2025 data, July 2026). Fewer carats at a higher price per carat is the pattern for the year: world value fell only 3.15%, to US$9.23 billion, while volume fell 8.4%.
Chart
Rough diamond output, 2024 and 2025
Million carats; Kimberley Process totals, De Beers and Diavik from company reports
Industrial diamond: a different market
Gem and industrial stones are counted separately. The USGS estimates world natural industrial diamond mine output at 38 Mct in 2025, led by Russia (16 Mct), Congo (Kinshasa) (7 Mct), Botswana (5 Mct) and Zimbabwe (5 Mct). Natural stones are under 1% of all industrial diamond used, and about 97% of US apparent industrial consumption was synthetic (USGS Mineral Commodity Summaries 2026: Diamond). So the companies above matter mainly for gem-quality supply and for jewellery prices.
The largest diamonds ever found
The largest rough diamond on record is the Cullinan, 3,106 carats, found in 1905 at the Premier mine near Pretoria. Karowe in Botswana has since produced a 2,492-carat stone, the largest since Cullinan, plus the 1,758-carat Sewelo and the 1,109-carat Lesedi La Rona (Miningmx on Lucara’s Karowe mine). Lucara found large stones intact because it uses X-ray transmission sorting, which spots big diamonds before the crusher can break them.
Largest silver mining companies by ounces produced
Silver is mostly a by-product. The USGS says it is mainly taken from lead-zinc, copper and gold mines, in that order, and that those polymetallic deposits hold more than two-thirds of world resources (USGS Mineral Commodity Summaries 2026: Silver). So the ranking mixes pure silver miners with copper and gold groups. Our page on lead-zinc ore explains why those mines carry so much silver.
Chart
Silver output of eight producers, 2025
Million troy ounces; bases differ (attributable, group, mine total)
| Company | Silver, 2025 | Basis | Main silver sources |
|---|---|---|---|
| Fresnillo plc (London-listed) | 48.7 Moz | Attributable, including Silverstream | Fresnillo, Saucito, Juanicipio (Mexico) |
| KGHM Polska Miedź | 43.3 Moz (1,347 t) | Group silver production | Copper mines in Poland |
| Newmont, Peñasquito only | 28 Moz | Mine total reported by Newmont | Peñasquito (Mexico) |
| Pan American Silver | 22.8 Moz | Attributable | Mexico, Peru, Bolivia and others |
| Glencore | 20.4 Moz | Group production | Base-metal mines |
| Coeur Mining | 17.9 Moz | Company total | Rochester, Las Chispas and others |
| Hecla Mining | 17.0 Moz | Consolidated | Greens Creek, Lucky Friday |
| First Majestic Silver | 15.4 Moz | Company total | Mexican mines |
Sources: Fresnillo preliminary results, March 2026; KGHM Q4 2025 presentation; Newmont Q4 2025 operating statistics; Pan American Silver, January 2026; Glencore full-year 2025 production report; Coeur Q4 2025 results; Hecla 2025 results; First Majestic Q4 2025 results.
What the table shows
Fresnillo’s 48.7 Moz was down 13.5% from 56.3 Moz in 2024, mainly because mining stopped at the San Julián disseminated ore body and grades were lower. For 2026 it expects 42.0 to 46.5 Moz, and its first half came in at 22.0 Moz, 11.4% lower than a year before (Fresnillo interim results, 2026). Fresnillo is listed in London and its mines are in Mexico; older pages that call it a Mexican company are wrong on the listing. Pan American Silver took over MAG Silver in September 2025 and with it MAG’s 44% of Juanicipio, which added 2.5 Moz to its 2025 total. Peñasquito’s silver fell from 33 Moz to 28 Moz.
Polymetal International no longer appears in silver rankings built on Russian mines. After selling its Russian business, the company became Solidcore Resources, a Kazakhstan-focused gold and silver miner, as Interfax described it in September 2024 (Interfax). For a wider table that also covers gold and copper, see our comparison of gold, silver and copper miners by output. Other pages go deeper on the top ten silver producers, the best silver mines and silver mining firms and trends. If you track listed names, see silver mining stocks; that page is information only.
Which countries mine the most silver
The USGS puts 2025 world mine output at about 26,000 tonnes. Mexico leads with 6,300 tonnes, then Peru (3,600) and China (3,400), and the United States mined 1,100 tonnes at 4 silver mines plus 31 base- and precious-metal operations (USGS Mineral Commodity Summaries 2026: Silver). The Silver Institute, working with Metals Focus, put 2024 world mine production at 819.7 Moz and said Mexico’s output recovered as Peñasquito returned to full production (Silver Institute, World Silver Survey summary). Country estimates from the two bodies use different bases, so compare like with like.
Chart
Silver mine output by country, 2025 estimate
Metric tons of contained silver; the eight largest producing countries
Output value calculator for diamond and silver miners
The calculator below turns an annual diamond and silver output into revenue at prices you choose, which is a quick way to size a company or a licence. Use the table above for realistic inputs: De Beers’ 2025 average realised price was US$142 per carat, Petra’s Cullinan averaged US$106 per carat in its year to June 2026, and Kitco showed a silver bid of US$56.98 per ounce on 15 October 2026.
Calculator
What is a year of diamond and silver output worth?
Enter your own output and prices.
- Diamond revenue: $200,000,000
- Silver revenue: $275,000,000
- Diamond output as % of 98.8 Mct world total: 2.0
Example values only, not a benchmark or a forecast. Prices are inputs: use today’s price. For reference, De Beers’ 2025 average realised price was US$142 per carat (Anglo American), Petra’s Cullinan averaged US$106 per carat in its year to June 2026, and Kitco showed a silver bid of US$56.98 on 15 October 2026. World rough output was 98.8 Mct in 2025 (Kimberley Process). Amounts are in US dollars and ignore costs, tax and royalties.
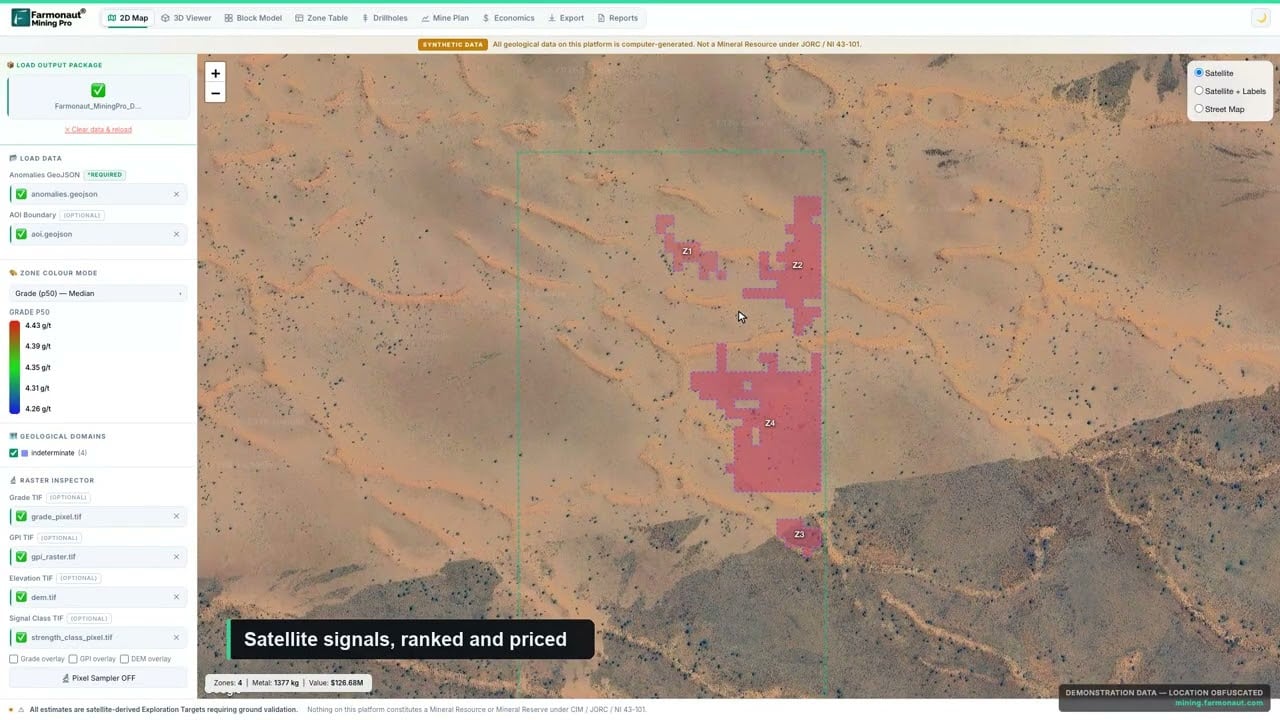
▶ A short look at Farmonaut Mining Pro, which turns a licence boundary into a geological and economic picture. · 4:56
What satellite images add at a mine
Company reports tell you how many carats or ounces were recovered. Satellite images show the ground: pit growth, new waste dumps, stockpiles and tailings, and whether a pit has stopped working. That is how an analyst can check a closure such as Diavik or a suspended site such as Finsch against what the company says. Our page on drill and blast monitoring software covers the on-site side of monitoring.
For earlier stages, Farmonaut screens an area of interest from satellite data for silver and diamond-related targets. These are exploration targets that sit ahead of any resource estimate, and the screening is not an environmental clearance.
▶ Explains in three minutes what remote sensing is and how it is used in mining, without jargon. · 2:01
Frequently asked questions
Who is the largest diamond mining company in the world?
ALROSA, with 29.8 million carats in 2025, ahead of De Beers at 21.7 million carats. ALROSA is Russian and works under Western sanctions.
Who is the second-largest diamond miner?
De Beers, 85% owned by Anglo American. Its 2025 output was 21.7 million carats, and Anglo American is selling it.
Which country mines the most diamonds?
Russia, with 31.5 million carats in 2025, then Botswana at 15.5 million carats, per Kimberley Process figures. Angola produced about 15.2 million carats by its regulator’s count.
Is Rio Tinto still mining diamonds?
No. Diavik stopped producing on 26 March 2026, after Argyle closed in 2020.
What is the largest diamond ever found?
The 3,106-carat Cullinan, found in 1905. The largest since then is a 2,492-carat stone from Karowe in Botswana.
Who is the largest silver mining company?
Among the companies compared here, Fresnillo plc, with 48.7 million ounces attributable in 2025. KGHM follows at 43.3 million ounces, mostly as a by-product of copper.
Which country produces the most silver?
Mexico, at about 6,300 tonnes in 2025 on the USGS estimate, ahead of Peru and China.
Is Polymetal still a top silver miner?
Not under that name. It became Solidcore Resources and now operates in Kazakhstan after selling its Russian business.
Why does a diamond producer report carats and a silver producer ounces?
Diamonds are sold by weight and quality in carats, while silver is priced by the troy ounce. Silver output is often reported attributable, meaning the share the company owns, so check the basis before comparing.
Can satellites find diamonds or silver?
They can flag alteration and structure that often go with silver and kimberlite targets, but only drilling confirms a deposit.
This page is for information only. It is not investment advice. It gives no share prices or targets, and company figures are on the bases each company reports.
Farmonaut mining
Get a quote for satellite screening of your licence area
Send us your area of interest as a KML, KMZ or polygon and ask for a quote on screening it for silver or diamond-related targets.
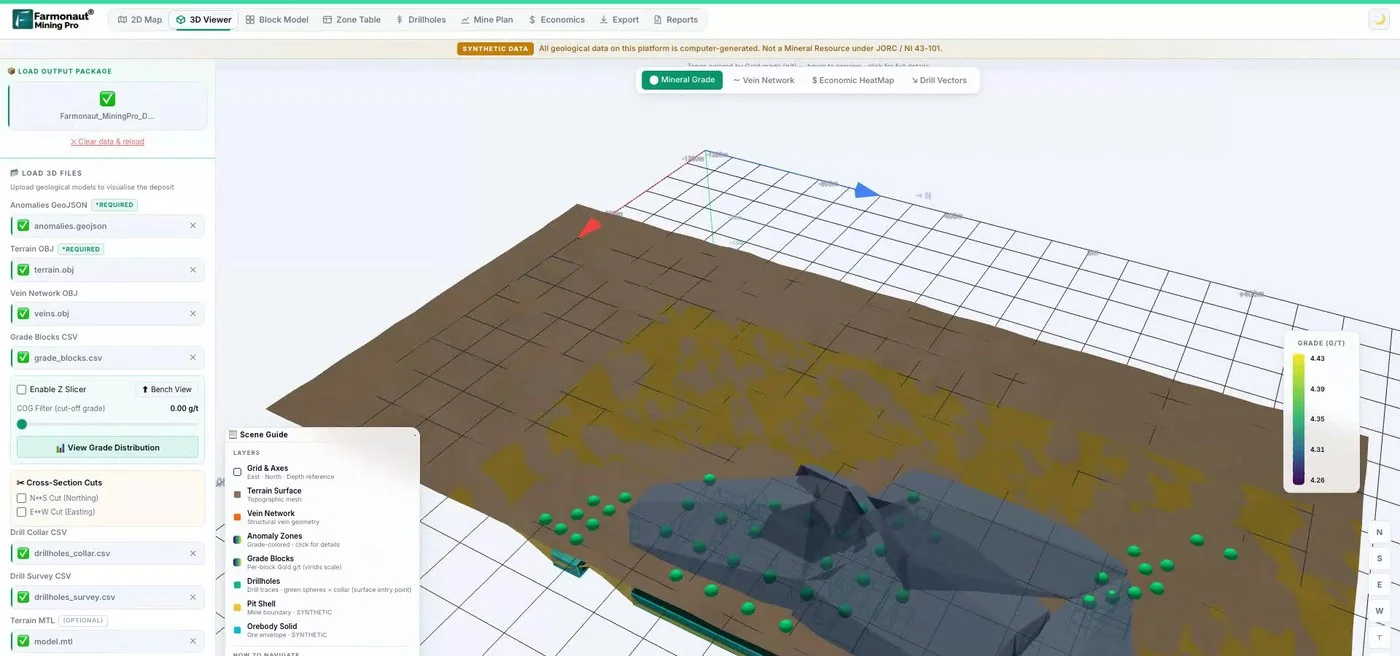
Mining Pro sample view, synthetic data
Keep reading
Sources
- ALROSA, Carbon neutrality confirmation, 2025 output of 29.8 Mct (16 July 2026): alrosa.ru
- Reuters via Kitco, Alrosa flags smaller-than-expected decline in annual diamond output (23 December 2025): kitco.com
- Anglo American, Q4 2025 Production Report (5 February 2026): angloamerican.com
- Anglo American, Q2 2026 Production Report (23 July 2026): angloamerican.com
- Miningmx, Anglo not exclusive with any buyer for De Beers (30 July 2026): miningmx.com
- GJEPC Solitaire, Rio Tinto’s Diavik diamond output climbs 61% in 2025: gjepc.org
- IDEX Online, Production ends at Diavik after 23 years (March 2026): idexonline.com
- Petra Diamonds, Q4 and FY 2026 Operating and Business Update (July 2026): investegate.co.uk
- Lucara Diamond, Year-end 2025 results (3 March 2026): lucaradiamond.mediaroom.com
- Miningmx, Angola targets 7% diamond output rise amid price slump: miningmx.com
- GJEPC Solitaire, Kimberley Process 2025 data: Russia still leads in rough diamond output (July 2026): gjepc.org
- Miningmx, Lucara recovers 2,492 carat diamond from Karowe: miningmx.com
- USGS, Mineral Commodity Summaries 2026: Diamond (Industrial): pubs.usgs.gov
- USGS, Mineral Commodity Summaries 2026: Silver: pubs.usgs.gov
- Fresnillo plc, Preliminary Results for the year to 31 December 2025 (March 2026): investegate.co.uk
- Fresnillo plc, Interim Results for the six months to 30 June 2026: investegate.co.uk
- KGHM, Q4 2025 results presentation (March 2026): kghm.com
- Newmont, Q4 2025 Operating Statistics: s24.q4cdn.com
- Pan American Silver, Achieves 2025 Production Guidance (January 2026): s202.q4cdn.com
- Glencore, Full Year 2025 Production Report: glencore.com
- Coeur Mining, Fourth Quarter and Full-Year 2025 Results: s201.q4cdn.com
- Hecla Mining, 2025 and Q4 earnings release: s29.q4cdn.com
- First Majestic Silver, Q4 and full-year 2025 results (19 February 2026): firstmajestic.com
- Interfax, Solidcore Resources (formerly Polymetal) (September 2024): interfax.com
- Kitco, Live silver price (15 October 2026, 14:50 New York time): kitco.com
- The Silver Institute, Silver supply and demand (World Silver Survey summary): silverinstitute.org
Discussion
Questions, corrections or field experience? Share them below. First-time comments are reviewed before they appear, and your email is never published.
No comments yet. Be the first to add a question or your experience.

 Alkimy SARL
 Double A Trading
 GemSprout Metals Limited
 Qader Group
 Ileys General Trading
 SG Gold Mining LLC
 VRV Global Pte Ltd
 Omsri International FZE
 G.I.T.T.
 Jaunita Erss Ltd
 Almosi SARL
 SRK Consulting
 Berks Gold Limited
 Mwerezi Minerals Company Limited
 Mining SARL
 SenGold Invest SAS
 Sean Mining Limited
 NTS Group (Pty) Ltd











