

GPS Farm Mapping Apps: How 7 Tools Compare on Accuracy, Price and Fit
Reviewed August 2026 against USDA Economic Research Service, the U.S. Government Accountability Office, and Penn State Extension.
Try it: Run your own numbers →
A GPS farm mapping app uses your phone’s or tractor’s satellite receiver to draw exact field boundaries, then feeds that boundary data into guidance, spraying, and yield-tracking tools. As of the 2023 Agricultural Resource Management Survey, autosteer guidance ran on 70% of large-scale U.S. crop farms and 52% of midsize crop farms, per the USDA Economic Research Service — yet only 27% of all U.S. farms and ranches used any precision agriculture practice at all as of the 2022 Census of Agriculture, according to the U.S. Government Accountability Office. That gap between “the biggest farms already do this” and “most farms don’t” is the real story behind farm gps mapping, tractor gps mapping, and every other variant of this search.
This guide separates what those terms actually mean, compares seven farm mapping software tools on technology and fit rather than invented star ratings, and ends with a calculator for what field overlap is costing you before you buy anything.
Table of Contents
- What “GPS Farm Mapping” Actually Covers
- How Many US Farms Actually Use It
- Why Fewer, Bigger Farms Make Mapping Necessary
- 7 Farm Mapping Apps Compared
- Farmonaut in Depth
- GPS Accuracy Tiers Explained
- Calculate Your Overlap Savings
- Farm Mapping in Forestry
- Challenges and Considerations
- What Could Change These Numbers
- FAQ: Farm Mapping Apps
- Conclusion
What “GPS Farm Mapping” Actually Covers
Searches for farm gps mapping, farm gps app, and gps farming app usually mean one of three distinct things, and mixing them up is why so many buyers end up with the wrong tool:
- Field boundary mapping (the “farm mapping app” core): drawing, walking, or importing the exact polygon of a field so its acreage and shape are recorded once and reused everywhere else.
- Tractor GPS mapping (guidance/auto-steer): using that same satellite signal to keep machinery on straight, non-overlapping passes during planting, spraying, or harvest. This is what people mean by tractor gps mapping specifically — it is about the machine’s path, not the field’s shape.
- Farm mapping software (the full platform): boundary maps plus crop records, task assignments, input tracking, and often satellite or drone imagery layered on top — what most people mean when they search farm mapping software or best farm mapping software.
- Try it: Run your own numbers
The underlying mechanics are the same across all three: a GPS or GNSS receiver reads satellite coordinates, and the app either imports existing coordinates, lets you draw a boundary manually on a satellite basemap, or logs your walked or driven path. Sensor inputs, drone scans, and satellite imagery layer on top to add crop type, soil moisture, or vegetation health to that boundary. Farmonaut’s own field-mapping walkthrough covers the boundary-drawing step specifically: Walk, Map, Grow — precision field mapping for small farmers.
Most modern tools run this on a phone or in a browser rather than dedicated survey hardware, which is why the category has moved from a handful of expensive proprietary systems to a wide field of Android, iOS, and web-based options — the seven compared below are drawn from that field.
How Many US Farms Actually Use It
The honest adoption numbers matter more than any vendor’s marketing copy, because they tell you whether GPS mapping is mainstream in your segment or still a minority practice. Per the 2023 ARMS-based figures from the USDA Economic Research Service, guidance autosteering ran on 52% of midsize crop-producing farms and 70% of large-scale crop-producing farms, and 68% of large-scale crop farms used yield monitors, yield maps, or soil maps. Zoom out to every U.S. farm and ranch, though, and the GAO’s January 2024 report puts overall precision agriculture adoption at just 27%, citing 2023 USDA reporting on the 2022 Census of Agriculture.
Adoption also varies by crop, and the survey years differ because USDA rotates which commodity ARMS covers each cycle: guidance systems ran on 58.4% of corn acres (2016), 55.9% of winter wheat acres (2017), 54.5% of soybean acres (2018), and 64.5% of cotton acres (2019), per the same ERS chart of note. None of these are a single “current” number — they are each a snapshot from a different survey year, which is exactly why the chart below plots them against the year they were actually measured rather than treating them as simultaneous.
Beyond adoption rates, Penn State Extension lists GPS guidance and auto-steer among its top ten field-crop energy-saving measures, noting that eliminating skips and overlaps also concentrates wheel traffic into a consistent pattern, which reduces scattered soil compaction and can improve fuel efficiency on the compacted travel lanes. Extension doesn’t attach a single national percentage to that saving because it depends on field shape, pass width, and current overlap — which is exactly what the calculator further down this page lets you work out for your own acres.
Why Fewer, Bigger Farms Make Mapping Necessary
The adoption skew toward large farms tracks a broader structural shift: U.S. farms are getting fewer and bigger. There were 1.88 million U.S. farms in 2024, down 8% from 2.04 million in 2017, while total land in farms fell only 3%, from 900 million to 876 million acres, according to the USDA Economic Research Service. Average farm size sits at 466 acres as of 2024. Fewer operators are now responsible for a similar amount of land, and covering more acres per person is precisely the problem a boundary map, once drawn, solves by turning “walk the fence line to check” into “open the app.”



7 Farm Mapping Apps Compared
Star ratings on comparison pages are usually invented, so this table compares the seven tools on what’s actually verifiable: the technology stack, how each one builds its map, and who it fits — the kind of side-by-side an AI-generated summary won’t do for you.
| Tool | Core Technology | Primary Mapping Method | Best Suited For |
|---|---|---|---|
| Farmonaut | Satellite + AI + Blockchain | Satellite field polygons with drawn/imported boundaries | Farms wanting crop-health monitoring and traceability alongside mapping |
| FarmSage | AI + GPS + Satellite | GPS-recorded boundaries with AI yield modeling | Mixed crop-and-livestock operations wanting yield prediction |
| AgriWebb | GPS + Weather Integration | Custom drawn field maps with task tagging | Livestock and mixed farms needing daily task records |
| FieldBee | GPS + Tractor Guidance Hardware | GPS boundary import plus auto-steer lines | Owner-operators who want tractor guidance, not just maps |
| FarmPortal | Drone + Satellite + GPS | Drone/satellite imagery overlaid on GPS boundaries | Row-crop farms wanting high-resolution imagery layers |
| FarmBooker | GPS + Cloud + Analytics | Cloud-synced field records and cost logs | Multi-user teams needing shared records across devices |
| Farm Forestry Toolbox | GIS + Forestry-specific tools | Plot and stand boundary GIS layers | Foresters tracking timber volume and stand growth |
1. Farmonaut — Satellite and AI-Based Farm Mapping
Farmonaut pairs GPS/manual field-boundary drawing with multispectral satellite monitoring, so the same map that defines your field also tracks vegetation index and soil moisture inside it. The Jeevn AI Advisory layer turns that data into weather and input-timing guidance, blockchain recording adds product traceability, and fleet management tools extend the same boundary data to machinery and logistics. Carbon footprinting is built in for farms tracking environmental compliance. It runs on Android, iOS, and web, and developers can pull the same satellite and weather data into their own systems via the Farmonaut API and developer docs.
2. FarmSage — AI-Driven Mapping and Livestock Tracking
FarmSage combines GPS boundary mapping with AI yield prediction and livestock movement tracking, aimed at mixed operations that need both crop and animal records in one map.
3. AgriWebb — Real-Time, Custom Field Mapping
AgriWebb lets you draw custom field maps and assign tasks directly from the field, with weather integration for daily planning — see Farmonaut’s related roundup of agribusiness monitoring technologies for how this compares to satellite-first approaches.
4. FieldBee — GPS Tractor Guidance and Field Mapping
FieldBee is the most guidance-focused entry here: it pairs boundary mapping with tractor auto-steer lines, so it answers the tractor gps mapping side of this search directly rather than just the field-boundary side.
5. FarmPortal — Drone and Satellite Field Mapping
FarmPortal layers drone and satellite imagery over GPS-mapped boundaries for closer crop monitoring and digital record-keeping.
6. FarmBooker — Cloud Records and Field Mapping
FarmBooker combines mapping with cost calculations and digital records synced across devices, useful where several people need to see the same field data.
7. Farm Forestry Toolbox — Forestry-Specific Mapping
Farm Forestry Toolbox is built for forest managers rather than row-crop farms, offering plot mapping alongside timber volume and carbon sequestration estimation.
Farmonaut in Depth
Farmonaut’s mapping sits inside a wider platform rather than as a standalone tool, which matters if you want one login instead of five:
- Satellite multispectral analysis: vegetation index, soil moisture, and crop vigor tied to the field boundary you mapped.
- Jeevn AI Advisory: weather-driven task suggestions inside the same app.
- Blockchain traceability: recorded stages from planting to sale via product traceability.
- Fleet and logistics: machinery tracking through fleet management.
- Carbon tracking: emissions measurement via carbon footprinting.
- Large-scale operations: multi-field administration through the agro-admin app.
For plantation and forest-specific advisory built on the same satellite base, see Farmonaut’s crop, plantation and forest advisory. This is also worth revisiting in the forestry section below.
GPS Accuracy Tiers Explained
Not every app that says “GPS” measures a field the same way, and this is the durable question to ask regardless of which vendor you’re evaluating next year:
- Standard GPS/WAAS receivers (the chip in most phones) hold a position to roughly 1–3 meters. Fine for drawing a field boundary or estimating acreage; not tight enough for keeping tractor passes from overlapping.
- Sub-meter correction narrows that to roughly 10–30 centimeters — adequate for most guidance tasks and a common mid-tier offering on dedicated guidance hardware.
- RTK (Real-Time Kinematic) correction uses a base station or network correction signal to bring pass-to-pass accuracy down to about 2.5 centimeters (roughly one inch) — the tier that actually eliminates overlap on planting and spray passes.
A boundary-mapping app only needs the first tier to be useful. A tractor gps mapping or auto-steer setup needs the second or third tier to deliver the overlap reduction that Penn State Extension lists as a fuel- and input-saving measure. Ask any vendor which tier their app or hardware actually delivers before assuming “GPS-enabled” means sub-meter or better.
Calculate Your Overlap Savings
Use your own overlap estimate and input cost below — not a marketing average — to see what tighter GPS-guided passes are worth on your acres.
Run your own numbers
Assumes the overlap reduction applies evenly across your mapped acres and that input cost per acre is constant across the field. Excludes equipment financing, RTK subscription fees, and yield effects, which depend on your soil, crop, and region.
Farm Mapping in Forestry
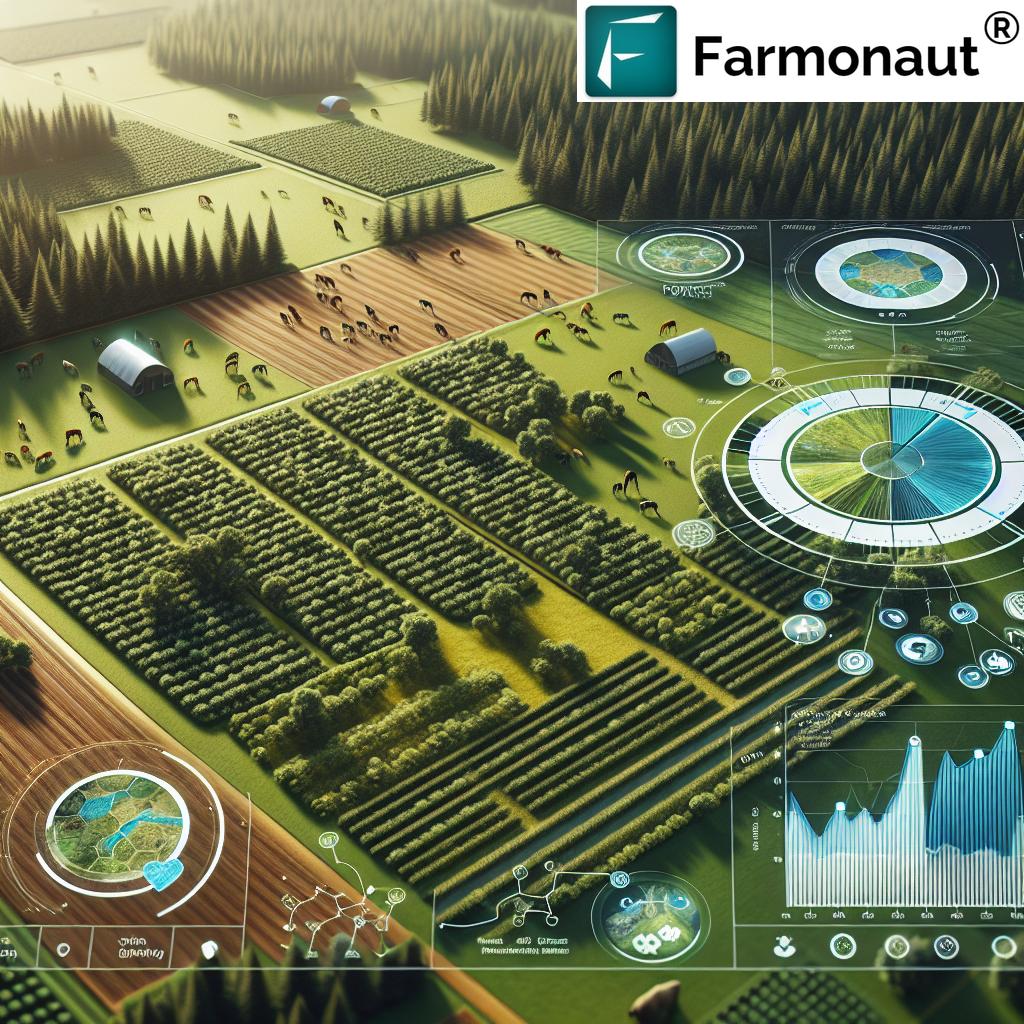
Forest managers use the same boundary-mapping mechanics for plots and stands instead of row-crop fields: delineating plot boundaries, tracking growth stages and pest or disease signs, and estimating timber volume for harvest planning. Farm Forestry Toolbox (in the table above) is built specifically for this; Farmonaut’s satellite layer extends the same crop-health logic to plantation and forest monitoring at sat.farmonaut.com.
Challenges and Considerations
The GAO’s January 2024 report names the real barriers plainly: acquisition costs can be prohibitive for farmers with limited resources or access to capital, uncertainty over who owns and can share farm data slows broader use, and a lack of standardization limits interoperability between different vendors’ systems. On the funding side, USDA and the National Science Foundation put nearly $200 million into precision agriculture research and development between fiscal years 2017 and 2021 — a sign the gap is recognized at the federal level, not that it’s closed. On the practical side, a mapped boundary is only as good as the signal that drew it: weak connectivity in remote fields and insufficient onboarding are the two most common reasons a purchased mapping tool goes unused.
What Could Change These Numbers
These adoption figures are not static, and here is exactly how to get a fresher one instead of trusting this page indefinitely. USDA’s Census of Agriculture runs every five years — the last full count was 2022, so the next is expected around 2027 and will update the 27% overall precision-agriculture figure. USDA’s Agricultural Resource Management Survey rotates which crop it covers each year, so a newer corn-, wheat-, soybean-, or cotton-specific guidance number will appear on the ERS charts of note page as each survey cycle publishes. What would actually move the underlying trend: RTK correction networks getting cheaper and denser in rural areas, and vendors agreeing on shared data formats — the exact interoperability gap the GAO flagged.
FAQ: Farm Mapping Apps
-
What is a farm mapping app?
A digital tool that creates, stores, and reuses a field’s exact boundary and area, usually alongside crop, task, or infrastructure records. -
What’s the difference between a farm GPS app and tractor GPS mapping?
A farm GPS app maps what a field looks like; tractor GPS mapping (guidance/auto-steer) controls how a machine moves inside it. You can have either without the other, though most full platforms now bundle both. -
What is the best farm mapping software for a US farm?
It depends on scale and what else you need: FieldBee if tractor guidance is the priority, AgriWebb or FarmSage for mixed livestock-and-crop task tracking, FarmPortal for drone/satellite imagery, and Farmonaut where satellite monitoring, traceability, and mapping need to live under one login. The comparison table above breaks this down by technology and fit. -
How accurate does GPS farm mapping need to be?
For boundary mapping and acreage, standard GPS (1–3 meters) is enough. For guided planting or spray passes, you need sub-meter or RTK correction — see the accuracy tiers section above. -
Are farm mapping apps worth it for small farms?
Adoption is lowest among the smallest farms, per USDA ERS data, largely on cost and connectivity grounds the GAO also documents. Free or low-cost boundary-mapping tiers exist specifically to lower that barrier before you commit to a paid guidance tier. -
Can I integrate mapping data with tractor guidance hardware?
Yes — platforms like FieldBee are built around that integration; others export boundary files that guidance hardware from other manufacturers can import. -
How does blockchain-based traceability work in agriculture?
Each stage of planting, growing, harvesting, and transport is recorded in a way that can’t be quietly altered afterward, which is what gives buyers and auditors confidence in the record. -
Where can I download a farm mapping app?
Download Farmonaut’s farm mapping app for Android, iOS, or web. -
What’s the best app for forestry mapping?
Farm Forestry Toolbox and Farmonaut both offer forestry-specific mapping, timber and carbon estimation, and plantation monitoring. -
Is there a Farmonaut API for custom integrations?
Yes — the Farmonaut API and its developer docs expose the same satellite, weather, and boundary data used in the app.
Further reading:
Conclusion
GPS farm mapping, tractor GPS mapping, and farm mapping software are related but different tools solving different parts of the same problem: knowing exactly where your field is, keeping machinery inside it without overlap, and turning both into records you can act on. USDA’s own numbers show the largest farms have mostly already adopted this — 70% of large-scale crop farms use autosteer guidance — while adoption across all U.S. farms and ranches sits at 27%, so there is real room to close that gap on a mid-sized or smaller operation.
Compare the seven tools above against what you actually need — boundary mapping, tractor guidance, or a full platform — run your own numbers through the overlap calculator, and read further on 10 powerful ways to start a farm if you’re building this into a new operation rather than retrofitting an existing one.
Discussion
Questions, corrections or field experience? Share them below. First-time comments are reviewed before they appear, and your email is never published.
No comments yet. Be the first to add a question or your experience.

 Green Bite Farm
 FCF India
 Unifrutti Gulf
 Deluxe Conseil
 TVS Electronics
 BW Pipelines
 WICO
WICO Gen Chayat
 Chimera Innovation
 SkyHarvest
 Polaris Digitech
 Teledarbas
 Wild Oak Farm
 SFX
SFX Doodlakine
 Licence holder · Niger · Gold










