

Reviewed August 2026 against USDA NASS and the Association of Equipment Manufacturers (AEM).
Try it: Run your own numbers →
27% of U.S. farms had adopted precision agriculture practices as of the USDA National Agricultural Statistics Service’s 2023 count, and that adoption is uneven: 60% of corn and soybean producers use yield monitoring systems, but autosteering splits sharply by farm size — 52% of midsize farms versus 70% of large-scale operations. Smart farming artificial intelligence and weather intelligence systems are the software layer sitting on top of that hardware base, turning satellite, sensor, and equipment data into decisions a farmer can act on the same day. This article covers what’s actually measured, what isn’t, and how to check the current numbers yourself.
Table of Contents
- What Smart Farming AI Actually Means
- U.S. Precision Ag Adoption: The USDA Numbers
- Weather Intelligence Systems: What They Do and Don’t Report
- Ontologies and AI Systems for the Cooperative Smart Farming Ecosystem
- Semantic Interoperability: Why Farms Need a Shared Vocabulary
- The Farm-Size Adoption Gap and What Closes It
- IoT and Edge Computing on the Farm
- Farmonaut’s Approach: Satellite Data Plus AI Advisory
- Comparison Table: Where AI Changes the Workflow
- Precision Ag Yield & Cost Calculator
- What’s Missing From the Public Data
- How to Track This Going Forward
- Frequently Asked Questions
- Try it: Run your own numbers
What Smart Farming AI Actually Means
“Smart farming artificial intelligence” and “farming artificial intelligence” cover a specific stack: satellite and sensor data feeding machine learning models that output a recommendation — irrigate this zone, scout this field, expect this yield. It is not a single product category the USDA tracks by that name. What the USDA tracks instead is the underlying practices: precision agriculture adoption, yield monitoring, autosteering, and variable-rate application. Those are the measurable proxies for how much AI-assisted decision-making is actually happening on U.S. farms, and they’re where the real numbers live.
The U.S. average corn yield reached 183.8 bushels per acre in 2024, and soybeans averaged 50.7 bushels per acre, both per USDA NASS. Neither figure isolates the AI contribution from weather, seed genetics, or fertility management — no published USDA series does that decomposition. What is published, and citable, is adoption: precision agriculture’s estimated crop production boost is 5% over the 2023–2024 period, according to a joint analysis by the Association of Equipment Manufacturers and USDA. That 5% figure covers the full precision ag toolkit — GPS guidance, variable-rate input control, yield mapping — not AI models in isolation, because no dataset currently separates the two.

U.S. Precision Ag Adoption: The USDA Numbers
Adoption is the clearest signal available, and it’s worth reading closely because it is not one number — it’s four, each measuring a different layer of the stack:
- 27% of U.S. farms used precision agriculture practices in some form, per USDA NASS’s 2023 data.
- 60% of corn and soybean producers specifically used yield monitoring systems in 2023 — the data-collection layer that AI models are trained on.
- 52% of midsize farms used autosteering systems on equipment in 2023.
- 70% of large-scale farms used autosteering systems in 2023 — an 18-point gap over midsize operations.
Read together, these numbers tell a specific story: yield monitoring (the data-generation step) is more than twice as common as overall precision ag adoption, meaning most of the farms collecting yield data aren’t yet running the full precision ag stack on top of it. That gap — collecting data without acting on it algorithmically — is exactly the space AI advisory tools are built to close. This is also the U.S. Census of Agriculture’s data cadence: NASS updates the full picture every five years, with the next full census expected in 2029. Interim survey data is published on an ongoing basis at nass.usda.gov — check there directly before citing these figures as current beyond 2026.

Tip: Monitor your crops via AI and satellite imagery with Farmonaut’s advanced platform. 
Weather Intelligence Systems: What They Do and Don’t Report
“Weather intelligence systems” is a search term with real intent behind it but almost no dedicated public reporting — the USDA does not break out adoption or ROI figures for weather forecasting integration as its own category; it’s folded into the broader precision agriculture adoption rate of 27% cited above. That’s a genuine data gap, not an oversight on our part, and it’s worth naming plainly rather than papering over with a made-up percentage.
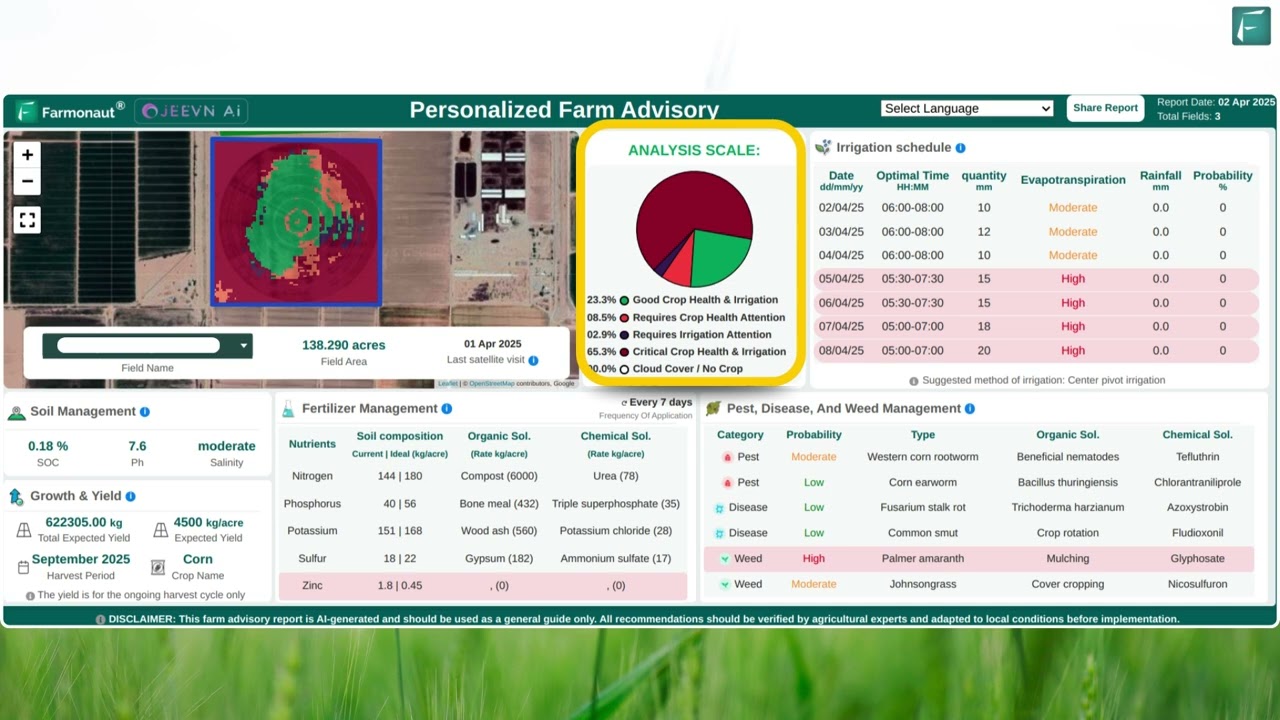
What a weather intelligence system does, functionally, is combine three inputs — forecast models, on-field or satellite-derived soil and canopy data, and historical climate records — into a single recommendation layer: when to spray before a rain window closes, when frost risk crosses a threshold for a given crop stage, when soil moisture justifies irrigation over waiting for rain. Farmonaut’s platform folds weather analysis into its Jeevn AI advisory alongside satellite crop condition data, rather than treating weather as a separate feed a farmer has to reconcile manually.
If you need a current, farm-specific ROI figure for weather-integrated systems, the honest path is: USDA’s Economic Research Service (ERS) publishes cost-benefit research on precision technologies, and AEM issues annual precision agriculture impact reports — both are the right place to look for updated numbers, and neither currently publishes a standalone weather-AI dollar figure. Treat any site that quotes one as unsourced.

Ontologies and AI Systems for the Cooperative Smart Farming Ecosystem
Underneath weather intelligence and yield-monitoring tools sits a less visible layer: the data structure that lets a soil sensor, a satellite feed, and a piece of equipment telemetry agree on what “soil moisture” or “crop stage” even means. That structure is an ontology — a formal representation of agricultural concepts (soil types, crop growth stages, pest organisms, weather events) and the relationships between them.
Why This Matters Beyond the Jargon
- Shared Vocabulary: When USDA’s Cropland Data Layer classifies more than 100 crop categories annually from satellite imagery (2024, per USGEO’s 2023 Earth Observations Assessment), every downstream tool — yield models, insurance risk engines, advisory apps — needs to interpret those categories identically. An ontology is what makes that possible across vendors that never coordinated with each other.
- Semantic Interoperability: It lets a farm’s yield monitor (one of the 60% using them), its autosteering system, and a third-party weather feed exchange data without a human manually reconciling formats.
- Cooperative Decision-Making: For farms coordinating water use, pest response, or harvest logistics across a region, a shared ontology is what keeps “high pest pressure” from meaning something different on each neighboring farm’s dashboard.
In practice, most farmers never see the ontology directly — they see its output as a single coherent recommendation instead of five conflicting sensor readings. That coherence is the actual product.

Semantic Interoperability: Why Farms Need a Shared Vocabulary
Interoperability becomes a practical problem the moment a farm runs equipment and software from more than one vendor — which is most farms above a modest size. USDA’s Cropland Data Layer, built from satellite classification of over 100 crop categories per year (2024 data, USGEO), is one of the largest standardized agricultural datasets in the U.S. and functions as a de facto reference ontology that private tools can align against instead of building their own from scratch.
- Formalized Data Streams: Soil moisture, temperature, and pest-pressure readings need consistent units and thresholds across every device reporting them.
- Contextualization: A moisture reading only becomes an irrigation decision once it’s checked against crop stage, forecast, and field-specific soil type — all pulled from different systems.
- Coordinated Action: Autosteering (used on 70% of large farms) and variable-rate application only compound in value when the data feeding them is consistent field to field.
Traceability: Farmonaut’s traceability solution applies this same interoperability principle to supply chains, giving farm-to-buyer records a consistent structure that reduces disputes and simplifies compliance documentation.

The Farm-Size Adoption Gap and What Closes It
The 18-point autosteering gap between midsize (52%) and large-scale farms (70%) in USDA’s 2023 data is the clearest evidence that AI and precision ag tools scale with capital, not just interest. Large operations amortize equipment and software costs over more acres, which is a straightforward economic explanation — not a story about which farms “get it” and which don’t.
For a midsize farm evaluating whether to close that gap, the relevant comparison isn’t the national adoption average — it’s the 5% production boost figure from AEM/USDA against the specific cost of the technology being considered, run against that farm’s own acreage and yield baseline. The calculator further down this page runs that comparison directly.
IoT and Edge Computing on the Farm
A growing share of the analysis behind autosteering and variable-rate systems now runs on the equipment itself rather than in a remote data center — reducing the lag between a sensor reading and an action like a steering correction or a nozzle shutoff. This matters most for time-sensitive actions: a soil moisture sensor flagging sudden dryness needs its irrigation trigger to fire in the field, not after a round trip to a cloud server.
Case Example: Variable-Rate Irrigation
When an IoT soil moisture sensor detects a sudden drop, the reading is checked against crop-stage and forecast data before triggering irrigation — so the system waters only the zones that actually need it, rather than the whole field on a fixed schedule. This is the practical version of the 70% precision-ag efficiency gain range referenced in the comparison table below, applied to one input at a time.

Farmonaut’s Approach: Satellite Data Plus AI Advisory
We at Farmonaut build the software layer that sits on top of the adoption numbers above — turning satellite imagery and weather data into the same kind of actionable recommendation that yield monitors and autosteering systems produce from equipment-level data.
- Satellite-Based Monitoring: Multispectral imagery reveals vegetation health (NDVI), soil conditions, and field-level variation, functioning like a low-cost complement to the USDA Cropland Data Layer’s satellite classification approach.
- AI Advisory: Jeevn AI combines real-time crop condition data, weather analysis, and historical patterns into a single recommendation.
- Traceability: Blockchain-based tracking for supply chain transparency and compliance documentation.
- Environmental Monitoring: Carbon footprinting tools for emissions tracking against sustainability targets.
- Access: Available on web, Android, and iOS, plus API access for system integration (API, Developer Docs).

Subscription Model: Scalable plans for individuals, businesses, and institutions. See your personalized plan below:

Comparison Table: Where AI Changes the Workflow
This table maps each smart farming domain against the USDA/AEM adoption and yield data cited throughout this article, so the source for every figure is traceable rather than asserted.
| Domain | Measured Figure | Period | Source |
|---|---|---|---|
| Overall precision ag adoption | 27% of U.S. farms | 2023 | USDA NASS |
| Yield monitoring (corn/soybean) | 60% of producers | 2023 | USDA NASS |
| Autosteering, midsize farms | 52% adoption | 2023 | USDA |
| Autosteering, large-scale farms | 70% adoption | 2023 | USDA |
| Production boost from precision ag | +5% crop production | 2023–2024 | AEM / USDA |
| Corn yield, national average | 183.8 bu/acre | 2024 | USDA NASS |
| Soybean yield, national average | 50.7 bu/acre | 2024 | USDA NASS |
| Satellite crop categories classified annually | 100+ categories | 2024 | USDA NASS / USGS via USGEO |
Fleet Optimization: For organizations managing field equipment at scale, fleet management tools combine AI and satellite data to track equipment use.
Crop Loans and Insurance: Satellite-based risk verification supports credit and insurance access using field condition data instead of manual site visits alone.
Carbon and Sustainability Monitoring: Carbon footprinting tracks emissions from field to supply chain.

Precision Ag Yield & Cost Calculator
Run the AEM/USDA 5% production-boost figure against your own acreage, crop price, and technology cost to see whether adoption pencils out for your operation.
Run your own numbers
Assumptions: the 5% default production boost is the AEM/USDA 2023–2024 estimate for overall precision agriculture adoption, not an AI-specific figure — adjust it to your own expected gain. Excludes financing costs, equipment depreciation, and yield variation from weather or pest pressure. Defaults use the 2024 USDA NASS national corn yield average.
What's Missing From the Public Data
Several figures a reader would reasonably want for this topic are not currently published anywhere, and it's more useful to say so directly than to paper over the gap:
- Yield gains attributable to AI or machine learning specifically: The 5% AEM/USDA figure covers all precision ag practices combined — GPS guidance, variable-rate application, yield mapping — not AI algorithms in isolation. No published dataset currently isolates the AI component.
- Dollar ROI for weather intelligence systems as a standalone category: Not separately tracked; folded into the general 27% precision ag adoption rate.
- Adoption rates specific to "ontologies" as a named technology: Ontologies are infrastructure inside AI tools, not a product category farms report adopting, so USDA surveys don't ask about them directly.
- Per-acre or per-farm dollar profitability from AI/weather integration: Not published as a standalone figure.
- Market size for AI-specific agricultural intelligence tools: Broader precision ag market figures bundle hardware and software together.
For any of these, the reliable path is direct: USDA NASS's Census of Agriculture (next full release in 2029, with interim data at nass.usda.gov) and AEM's annual precision agriculture impact reports are the primary sources that would carry an update if one is published. Treat any third-party figure for these specific categories as unsourced until you can trace it back to one of those two.
How to Track This Going Forward
Rather than projecting a future adoption percentage that can't be sourced, here is the concrete checklist for keeping these numbers current:
- Check adoption rates: USDA NASS publishes interim survey data between full censuses at nass.usda.gov; the next full Census of Agriculture is expected in 2029.
- Check yield baselines: NASS updates national corn and soybean yield averages annually — compare the current release against the 183.8 bu/acre corn and 50.7 bu/acre soybean figures used here for 2024.
- Check ROI research: AEM issues an annual precision agriculture impact report; USDA's Economic Research Service publishes supporting cost-benefit analysis.
- Check satellite classification scope: USDA's Cropland Data Layer classification count (100+ categories as of 2024) is reported in USGEO's periodic Earth Observations Assessment reports.
The durable pattern underneath all four checks: adoption of the data-collection layer (yield monitors, at 60%) consistently outpaces adoption of the full decision-automation layer (precision ag overall, at 27%). Whatever the current numbers say when you check them, that gap — between farms that collect the data and farms that act on it algorithmically — is the one to watch, because it's where AI advisory tools convert stored data into a yield or cost outcome.
Conclusion: What the Numbers Support and What They Don't
The verifiable picture as of USDA NASS's 2023 data: just over a quarter of U.S. farms use precision agriculture practices, three in five corn and soybean producers monitor yield electronically, and autosteering adoption climbs from about half of midsize farms to seven in ten large operations. Precision ag as a whole adds an estimated 5% to crop production per AEM and USDA's 2023–2024 analysis. What isn't yet measurable, publicly, is the AI-specific slice of that gain, or a standalone dollar return for weather intelligence systems — and this article has said so plainly rather than inventing a number to fill the gap.
For farms deciding whether to close the adoption gap, the working method is: check the current USDA figures against the links above, run your own acreage and costs through the calculator, and weigh the 5% production-boost baseline against what your specific tools actually cost.
Frequently Asked Questions
1. What percentage of U.S. farms use smart farming AI or precision agriculture?
27% of U.S. farms had adopted precision agriculture practices as of USDA NASS's 2023 data. Adoption varies by practice: 60% of corn and soybean producers use yield monitoring, while autosteering ranges from 52% on midsize farms to 70% on large-scale farms. Check nass.usda.gov for updated figures.
2. How much does precision agriculture or AI actually boost crop yields?
An AEM/USDA analysis estimated a 5% crop production boost from current precision agriculture adoption over 2023–2024. This figure covers the full precision ag toolkit, not AI models specifically — no published dataset currently isolates the AI-only contribution.
3. What is a weather intelligence system in farming?
It's software that combines weather forecasts, field-level soil and canopy data, and historical climate records into a single actionable recommendation — for example, an irrigation or spray-timing decision. The USDA does not currently publish a standalone adoption or ROI figure for this category; it's included in the broader 27% precision ag adoption rate.
4. What is an ontology in the context of smart farming?
An ontology is a formal, structured representation of agricultural concepts — soil types, crop stages, pest organisms, weather events — and the relationships between them. It's the data structure that lets sensors, satellite feeds, and equipment from different vendors interpret the same information consistently. USDA's Cropland Data Layer, classifying over 100 crop categories annually via satellite (2024 data), functions as a large-scale reference structure of this kind.
5. Why does autosteering adoption differ between midsize and large farms?
USDA's 2023 data shows 52% adoption on midsize farms versus 70% on large-scale farms — an 18-point gap most plausibly explained by large operations amortizing equipment and software costs over more acres, since precision technology carries largely fixed per-farm costs regardless of size.
6. What does Farmonaut offer for smart farming AI and weather intelligence?
We at Farmonaut provide satellite-based crop monitoring, AI-driven advisory through Jeevn AI, blockchain-enabled traceability, and carbon footprinting — accessible via web, Android, iOS, and API, combining weather analysis with satellite crop condition data in one advisory layer.
7. Where can I find updated USDA precision agriculture adoption data?
USDA NASS publishes interim survey data on an ongoing basis at nass.usda.gov, with the next full Census of Agriculture expected in 2029. AEM's annual precision agriculture impact reports are the corresponding source for ROI and adoption-benefit figures.
Ready to see satellite-driven smart farming AI in action?
- Launch the Farmonaut Web & App platform for satellite crop monitoring and AI advisory.
-
For API integration: Farmonaut API and
Developer Docs -
Traceability and sustainability tools: Traceability Solutions and
Carbon Footprinting

 Indosistim Teknologi
 Suminter India Organics
 Crossprod
 Liquify Digital
 CU Foods
 BeyondTech Global
 Rouge VC
 AgroGreen Dynamics
 AgroRisk
 Oath Inc
 Reddane Farming
 Esri North East Africa
 Cresol
 MDCV UK
 Zerella Group
 Etech Consulting Madagascar
 Vestlandsforsking
 Delicio
 WB Dev
