

Farm machinery · Telematics guide
Telematics in Agriculture: Uses, Benefits and Costs
Telematics in agriculture is the wireless link between farm machines and the cloud: location, engine hours, fuel and field maps go out, and prescriptions come back. In 2025, 22% of US farms used precision agriculture practices and 74% had cellular internet (USDA NASS).
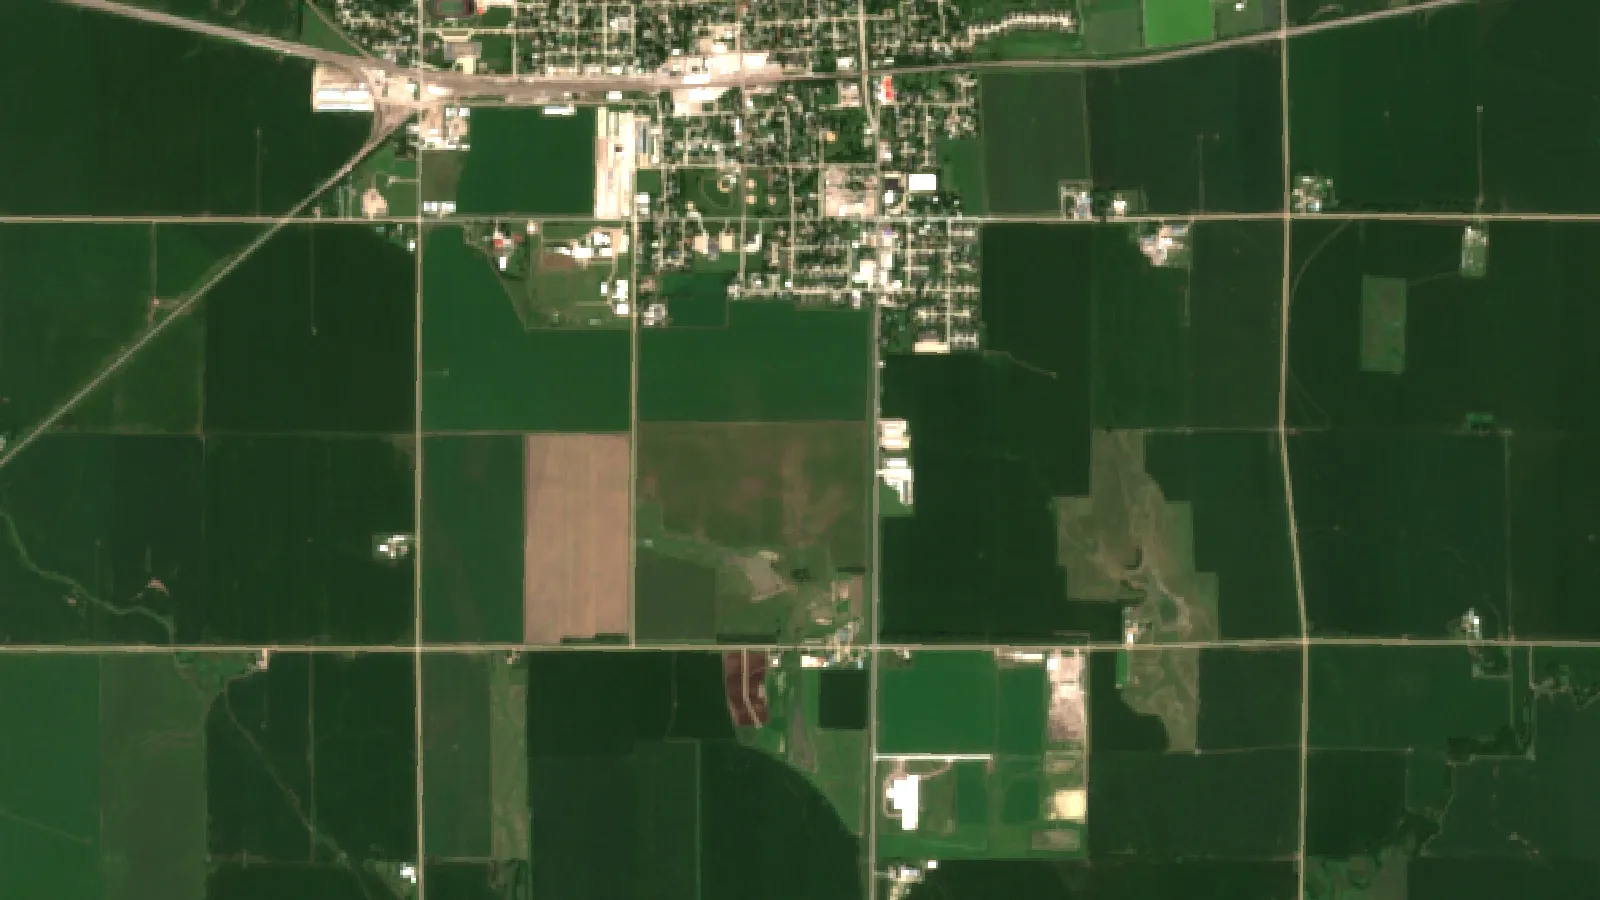
Key takeaways
- Telematics sends machine location, engine, fuel and field data over cellular, Wi-Fi or satellite links; USDA ERS dates the first farm units to 2002.
- 22% of US farms used precision agriculture practices in 2025, down from 27% in 2023; shares top 40% in Iowa, Illinois, Nebraska and North Dakota (USDA NASS, August 2025).
- Guidance auto-steering was used by 70% of large-scale US crop farms and 52% of midsize farms in 2023 (USDA ERS).
- AEM’s 2021 study credits precision tools as a group with a 6% cut in fossil fuel use; it names auto guidance and telematics as the big drivers of further fuel savings.
- Before buying, check field coverage, data ownership terms, mixed-fleet support and who can use the diagnostic tools.
In this article
- What is telematics in agriculture?
- How farm equipment telematics works
- Key parts of an agricultural telematics setup
- Advantages of telematics in agriculture
- How many farms use precision tools
- Connectivity: the first thing to check
- Costs and payback: is telematics worth it?
- How to choose a telematics system
- Challenges: data, repair access and skills
- Where farm telematics is heading
- Telematics and satellite crop monitoring
- FAQ
Telematics in agriculture is the wireless transfer of data between farm machines, connected devices and the cloud. A tractor, combine or sprayer sends its location, engine hours, fuel use, fault codes and field maps over a cellular, Wi-Fi or satellite link, so a farm manager can see the fleet on a phone or computer without walking to the shed.
The USDA Economic Research Service gives this plain definition in its report on precision agriculture in the digital era (February 2023). This guide explains how farm equipment telematics works, the main benefits and limits, what share of farms use precision tools, how to check your connectivity, and how to work out if a subscription pays for itself on your farm.
What is telematics in agriculture?
The word joins telecommunications and informatics. On a farm it means sensors and GPS receivers on machines, a modem that sends their data, and software that turns the data into maps, alerts and reports. The same link can also carry data the other way, for example a variable-rate prescription map sent from the office to a planter or spreader.
According to the USDA Economic Research Service, the first telematics devices for farm equipment were on sale as early as 2002, and at least one major equipment maker made them standard in 2011. Before telematics, yield and as-applied data moved on flash cards carried from the cab to the office, and lost cards meant lost data.
What data a farm telematics system sends
- Machine status: engine hours, speed, working or idle state, and diagnostic trouble codes.
- Location and movement: GPS position, routes, and which parts of a field have been covered.
- Fuel: fuel level and burn rate, which shows time lost to idling.
- Field records: as-applied maps of seed, fertilizer and spray, and yield monitor data.
- Security events: alerts when a machine leaves a set boundary (a geofence) or runs outside work hours.
- Environment: some systems also log weather station or soil moisture probe readings next to machine data.
How farm equipment telematics works
Most systems follow the same chain from the machine to the screen:
- Sensors and the machine bus: the controller reads engine and implement data from the tractor’s internal network.
- A GNSS receiver: GPS or another satellite system gives the position several times a second.
- A modem: a cellular or satellite modem sends the data, or stores it until the machine is back in coverage.
- A cloud platform: the maker’s or a third party’s portal stores the records and builds maps, logs and alerts.
- Apps and data sharing: managers, agronomists and dealers view the data on a phone or computer, or pull it into farm software through an application programming interface (API).
Mixed fleets are common, so standards matter. The ISO 11783 standard, known as ISOBUS, defines how tractors, implements and farm software talk to each other. The Agricultural Industry Electronics Foundation (AEF) explains that ISOBUS aims at plug and play between any tractor, terminal and implement, and it writes guidelines and conformance tests so buyers can check which functions work together.
Key parts of an agricultural telematics setup
1. GPS tracking and fleet management
A GPS unit on each tractor, harvester and truck shows where machines are and what they are doing. Managers use this to plan who goes where, cut empty road trips between fields, and send a grain cart to the combine that is about to fill. Fleet records also show which machines sit unused, which helps decide whether to sell, share or rent equipment.
- Best for: farms with several machines working in fields far apart.
- Watch for: plans that charge per machine, which add up on a large mixed fleet.
2. Remote monitoring and predictive maintenance
Engine hours, coolant temperature, oil pressure and fault codes reach the dealer or the farm office as they happen. A service reminder can be set by real engine hours instead of the calendar, and a fault code can be read before a technician drives out, so the right part comes on the first visit. Our guide to farm tool maintenance steps covers the routine checks that telematics alerts support.
- Best for: farms that lose money when a harvester or planter stops in a short weather window.
- Watch for: whether remote diagnostics are open to your own mechanic or only to an authorised dealer.
3. Geofencing, security and theft alerts
A geofence is a virtual boundary drawn on a map around a yard, a field or a farm. The system sends an alert when a machine crosses it or starts at night. This helps recover stolen equipment and stops machines from being used where they should not be, such as a sprayer entering a field with a sensitive crop next door.
- Best for: farms with machines parked in remote fields or yards.
- Watch for: alert settings, so staff are not flooded with false alarms at the start of each shift.
4. Field data, analytics and decision support
The real value comes from what you do with the records. As-applied and yield maps sent through telematics can be compared field by field, so you can see where a pass overlapped, where seed rate changed, and which zones gave the best return. With a link to a variable-rate controller, the same channel carries the next season’s prescription back to the machine.
- Best for: farms that already use yield monitors or variable-rate equipment.
- Watch for: export formats; ask whether you can download raw files, not only reports.
5. Connectivity and system integration
Data moves over cellular networks, low-power wide-area networks or satellite links to a cloud platform. From there, an API lets other software read it, for example a farm management system, an accounting package or a crop monitoring service. If you build your own dashboards, check the vendor’s API terms. For weather and satellite data feeds, see the satellite and weather API developer documentation and the satellite data API.
Advantages of telematics in agriculture
The benefits fall into five groups. Results depend on the farm, the crop and how the data is used, so treat any single figure as a guide, not a promise.
Operational efficiency
Live positions and work logs help managers plan field order, cut waiting time at the cart and the truck, and spot machines that sit idle with the engine running. The USDA chart on precision agriculture use by farm size (December 2024) lists saving labour time and reducing operator fatigue among the most common reasons farmers give for adopting precision technology.
Cost savings
Savings come from less fuel burned while idling, fewer overlapping passes, fewer emergency repairs and less time spent on paper records. Overlap is easy to measure. In an Iowa State University study of two Iowa farms (2012), planting without precision tools showed an average 3.3% overlap, and the author estimated that cutting tillage overlap by 7% saves about US$1 per acre at prices of that time.
Safety and security
Fault alerts can warn of overheating or low oil pressure before a failure. Location data helps find a lone operator after hours, and geofence alerts make theft harder. Work logs also show who ran which machine and when.
Environmental results
Fewer passes and less overlap mean less fuel, seed, fertilizer and spray per acre. The Association of Equipment Manufacturers (AEM) study of precision agriculture (2021) estimated that US farmers using precision tools at that time achieved a 6% cut in fossil fuel use and a 9% cut in herbicide and pesticide use. AEM named auto guidance and machine telematics as the big drivers of further fuel savings with full adoption. These figures cover precision agriculture as a group, not telematics alone.
Better decisions
Several seasons of machine and field records show trends that memory misses: which fields cost the most to farm, which machines break down most, and whether a change in practice paid off. For more on turning farm records into choices, see our guide on how to use AI in farm management.
Chart
Estimated gains from precision agriculture in the US
% change at 2021 adoption levels, all precision tools combined
How many farms use precision tools
No national survey counts farms using telematics on its own. The USDA Economic Research Service notes that adoption data are not collected for telematics, and cites a survey that found less than 40% of agricultural service providers used telematics in their business in 2020. The closest broad measure comes from the USDA NASS Technology Use report (August 2025), which asks whether a farm used precision agriculture practices such as GPS guidance, yield mapping, variable-rate inputs or drones.
Chart
Farms using precision agriculture practices
% of all farms, 2023 and 2025, US and selected states
Nationally, 22% of farms said yes in 2025, down from 27% in 2023. Shares are far higher in the row-crop states of the Plains and Midwest, where large fields and big machines give more acres to spread the cost over. The NASS figures count all farms, including many small livestock and hobby farms, so they sit well below the share of crop acres managed with these tools.
Acre-based data show how far guidance has spread on large crop farms. Auto-steer guidance was used on 5.3% of planted corn acres in 2001 and 58% in 2016, according to the ERS report. By 2023, guidance auto-steering was used by 52% of midsize farms and 70% of large-scale crop-producing farms, the ERS chart shows.
Connectivity: the first thing to check
Telematics only works as well as the link from the field. The ERS report notes that wireless coverage in crop regions can be weak or missing away from highways and towns, and that home internet plans favour downloads while field machines need to upload large files.
The NASS report shows that 85% of US farms had internet access in 2025. 74% of farms had access through a cellular data plan and 55% through a broadband connection. Satellite internet is a larger share in some western states; in California it was 44% of farms with internet. Before you buy, drive your fields with a phone and note where data drops out, and ask the vendor how the modem stores and forwards data when it loses signal.
Chart
How US farms connect to the internet
% of farms by access method, 2025; a farm can use more than one
Costs and payback: is telematics worth it?
Costs have three parts: hardware (a modem and sometimes a display), a yearly data or software plan, and staff time to set up and use the system. Many new machines from major brands ship with a modem fitted, so the main cost is the plan. Older or mixed fleets need retrofit units. Prices change often and depend on the dealer and the plan, so get written quotes for your fleet size.
A quick way to test payback is to look at idle fuel alone, one of the easiest savings to measure. Engine dashboards and most telematics portals show idle hours. If cutting idle time covers the plan fee, everything else, such as fewer breakdowns and better records, is a bonus. Use the calculator below with your own numbers.
Try the numbers for your own farm below.
Calculator
Does cutting idle time cover a telematics plan?
Enter your own fleet, idle hours, fuel price and plan fee.
- Fuel saved per year: 360 gal
- Value of fuel saved (US$): $1,350
- Total plan fees (US$): $1,360
- Idle cut needed to break even: 20.1 %
Example values only, not a benchmark or forecast; every number is your input. Idle fuel burn differs by engine; read it from your machine display or dealer. Diesel price: example, use today’s price. The calculator counts idle fuel only; repair, labour and record-keeping savings are not included.
How to choose a telematics system
- List your fleet: brand, model and year of each machine. Check which already have a modem.
- Decide what you need first: location and security, maintenance alerts, field records, or all three.
- Check mixed-fleet support: ask if the platform reads other brands through ISOBUS or retrofit units, and test it on one machine.
- Read the data terms: who owns the data, who can see it, and whether you can export it in an open format.
- Check repair access: ask whether your own mechanic or an independent shop can use the diagnostic tools.
- Test the coverage: run a trial in your weakest signal area before signing a multi-year plan.
- Plan training: name one person to own the system and set up alerts that staff will actually read.
Challenges: data, repair access and skills
Data ownership and privacy
Telematics sends detailed records about your farm to a third party. Several farm bodies have written rules on this. The Ag Data Transparent core principles, first set out with the American Farm Bureau Federation in 2014 and updated in 2024, start from the view that farmers should own data from their own operations. In Australia, the National Farmers’ Federation’s Australian Farm Data Code gives farmers a yardstick to judge a provider’s data terms. In the European Union, the EU Data Act gives users of connected products, including those who lease or rent them, more control over the data the products create. Data contracts are legal documents; read them in full and get legal advice if the terms are unclear.
Repair access
Remote diagnostics only help if someone can act on them. In July 2026, Farm Policy News at the University of Illinois reported a Federal Trade Commission settlement with John Deere that requires the company to make repair resources available beyond its authorised dealers. Rules differ by country and brand, so check what tools your own mechanic can use.
Skills and technician supply
More connected machines need more trained technicians. A farmdoc daily article from the University of Illinois (January 2026) cites a US Bureau of Labor Statistics estimate of about 36,830 farm equipment mechanics and service technicians employed in 2023, and industry reports of a shortage of qualified staff. On the farm, someone also needs time to read alerts and keep the system set up.
Cost and connectivity
Plan fees, retrofit units and weak signal are the other common barriers. Small farms have fewer acres and machine hours over which to spread a fixed fee, which helps explain why adoption rises with farm size in the USDA data.
Best practices
- Use strong passwords and two-factor sign-in on telematics portals and apps.
- Choose modems that store data offline and send it when the signal returns.
- Prefer vendors that let you export raw data in open formats.
- Review the return each season: idle hours, repair costs, and how often the data changed a decision.
Telematics data can also support record-keeping for buyers and lenders. See our pages on supply chain traceability and satellite checks for crop loans and insurance.
Where farm telematics is heading
- More automation: guidance, section control and automated steering already depend on the same GNSS and data links, and machine makers are adding more autonomous functions.
- Machine data plus remote sensing: machine records show what was done; satellite and drone images show how the crop responded. Joining the two helps explain yield differences within a field.
- Better rural links: the ERS report notes an open debate on whether 5G will reach farm fields and whether satellite internet will have low enough delay for field work.
- Emissions records: fuel logs from telematics can feed farm carbon accounts. See our page on carbon footprint tracking.
- Open data rules: data laws and right-to-repair settlements are pushing makers to share more machine data with owners.
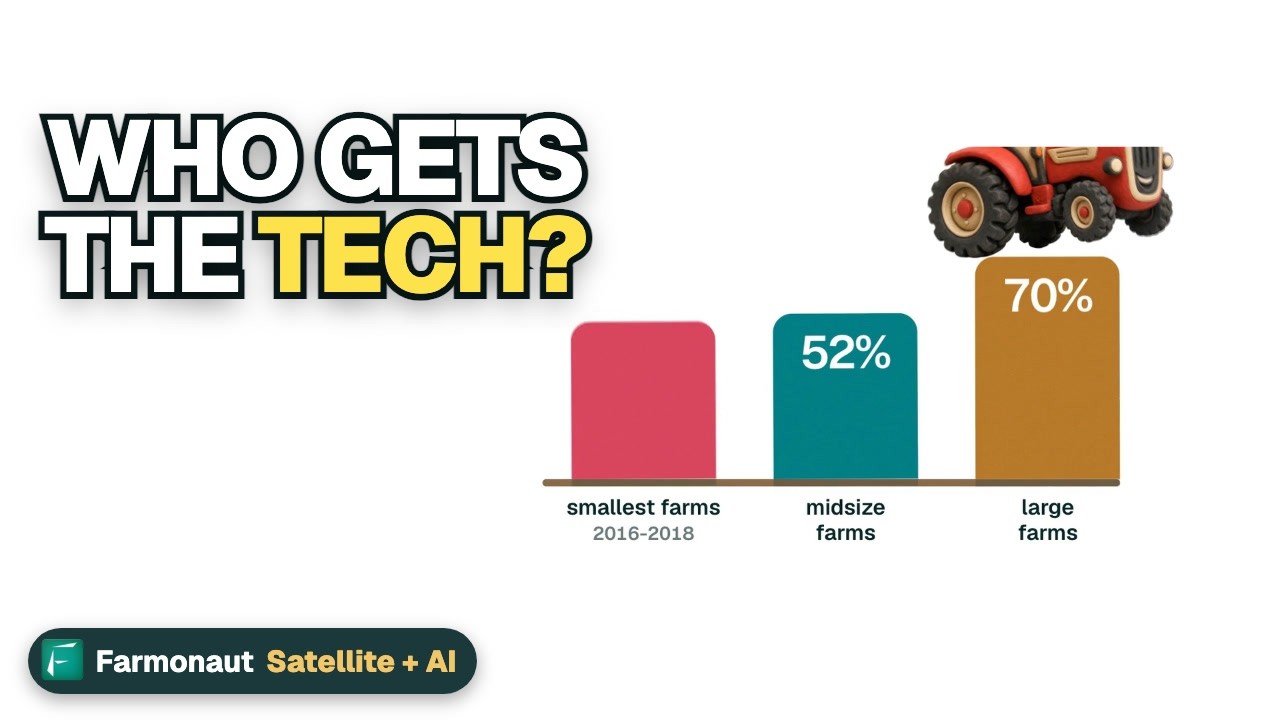
▶ How new farm technology, from self-driving tractors to rural internet, affects farms and rural towns. · 3:50
Telematics and satellite crop monitoring
Telematics tells you where machines went and what they applied. It does not show how the crop is growing between passes. Satellite crop monitoring fills that gap with regular vegetation index maps of each field, which can point a scout to a weak patch before the next pass. The Farmonaut Satellite + AI Farm Monitoring System gives field-level crop health maps on web, Android and iOS through the monitoring app, and the maps can sit next to your machine records when you review a season.
For large farm groups and agencies there is a separate admin dashboard for many farms, and for vehicle tracking a fleet management module.
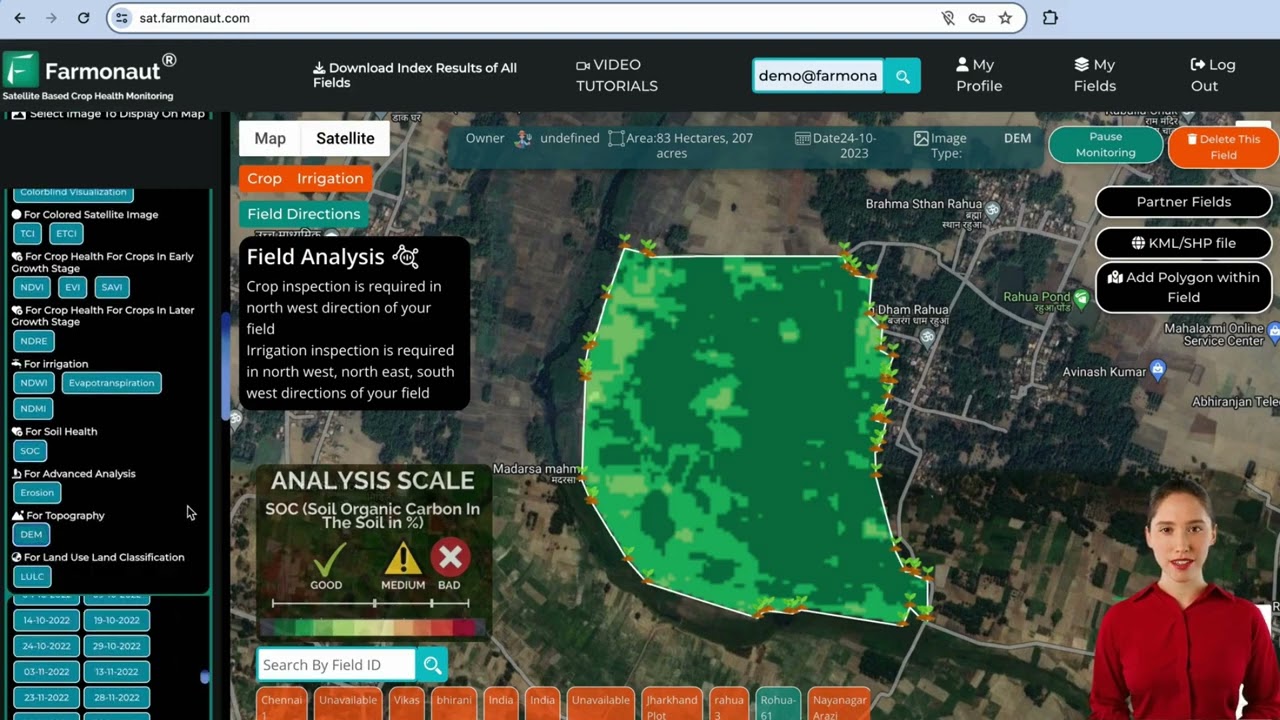
▶ A walk-through of a web app for satellite crop monitoring, from adding a field to reading crop health maps. · 8:02
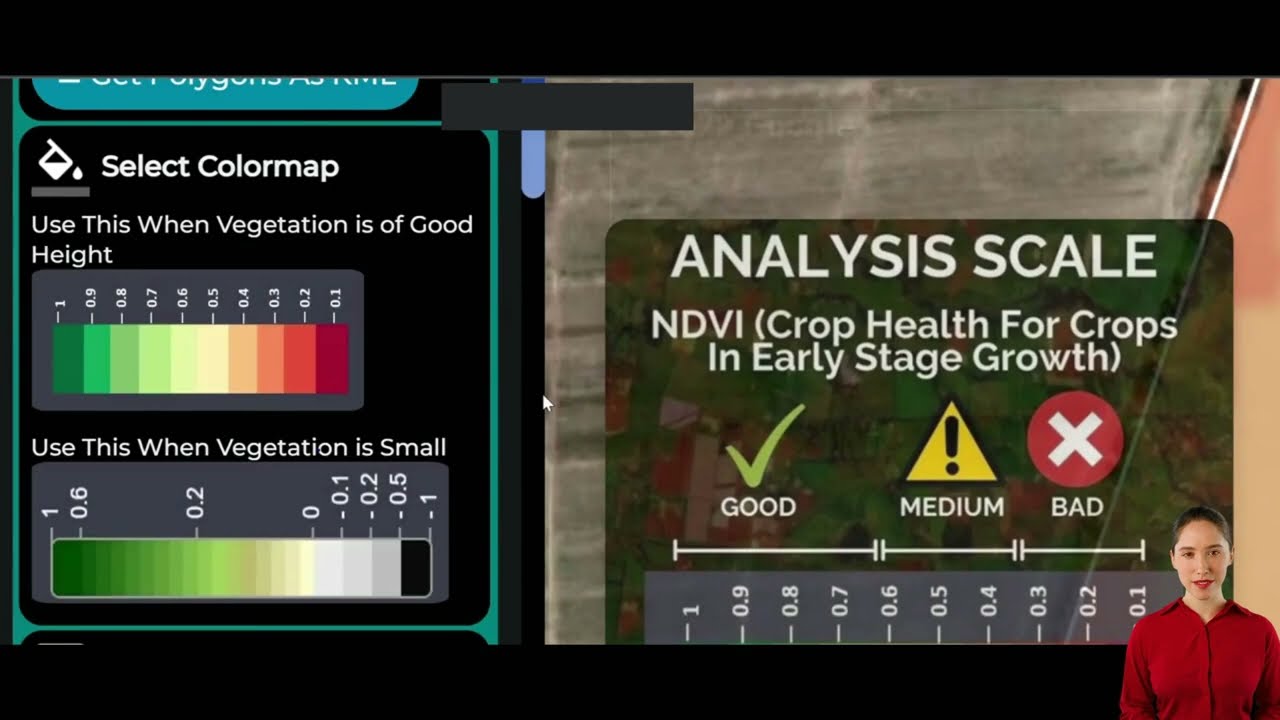
▶ How to read satellite vegetation, water and soil index maps for your fields. · 10:16
FAQ
What is telematics in agriculture?
It is the wireless transfer of data between farm machines, connected devices and the cloud. Machines send location, engine, fuel and field data, and managers view it on a phone or computer. Prescription maps can also be sent back to the machine.
What are the main advantages of telematics in agriculture?
Less idle time and fuel, maintenance by real engine hours, faster repairs because fault codes are read remotely, theft alerts through geofencing, and digital field records without carrying flash cards. Results depend on fleet size and how the data is used.
How does GPS help in farming?
GPS gives the position of each machine. It drives auto-steer guidance, section control and yield maps, and it lets telematics show where machines are. ERS data show guidance auto-steering on 70% of large-scale crop farms in 2023.
Do I need a strong mobile signal for farm telematics?
A signal is needed to send data, but many modems store records and send them later. Check coverage in your fields first. In 2025, 74% of US farms had internet through a cellular plan and 24% through satellite, according to NASS.
Who owns the data from my tractor?
It depends on your contract and local law. The Ag Data Transparent principles say farmers should own data from their own operations, and the EU Data Act gives users of connected products more control. Read the data terms and get legal advice if needed.
Related pages on our site: smart tractors and their uses, sustainable resource management steps and climate-smart farming tips for Australia.
Farmonaut crop monitoring
See your own fields from space
Add satellite crop health maps to the machine records you already keep.




Keep reading

Sources
- USDA ERS, Precision Agriculture in the Digital Era: Recent Adoption on U.S. Farms, EIB-248 (February 2023): ers.usda.gov
- USDA ERS, Precision agriculture use increases with farm size and varies widely by technology (Chart of Note, December 2024): ers.usda.gov
- USDA NASS, Technology Use (Farm Computer Usage and Ownership) (August 2025): esmis.nal.usda.gov
- Association of Equipment Manufacturers, The Environmental Benefits of Precision Agriculture Quantified (2024 article on 2021 study): aem.org
- Iowa State University Extension, Precision Ag Technology Savings (Darr, 2012): crops.extension.iastate.edu
- AEF, ISOBUS (ISO 11783) overview: aef-online.org
- Ag Data Transparent, Core Principles (updated 2024): agdatatransparent.com
- National Farmers’ Federation, Australian Farm Data Code: nff.org.au
- European Commission, Data Act explained: digital-strategy.ec.europa.eu
- Farm Policy News, University of Illinois, FTC Settlement Secures Right to Repair for Farmers (July 2026): farmpolicynews.illinois.edu
- farmdoc daily, University of Illinois, The People Behind the Machines (January 2026): farmdocdaily.illinois.edu
Discussion
Questions, corrections or field experience? Share them below. First-time comments are reviewed before they appear, and your email is never published.
No comments yet. Be the first to add a question or your experience.

 Mobitech Wireless
 FCF India
 Unifrutti Gulf
 Deluxe Conseil
 TVS Electronics
 BW Pipelines
 WICO
 Gen Chayat
 Chimera Innovation
 SkyHarvest
 Polaris Digitech
 Teledarbas
 Wild Oak Farm
 SFX
 Doodlakine
 Exurbia Geospatial

 Licence holder · Niger · Gold
 Client · Tanzania · Gold
 Client · Somalia · Gold
 Client & affiliate partner · Ghana · Gold










