2025 US Land Use & Cost Per Acre: Dept. of Agriculture Insights
Meta Description: Discover 2025 U.S. land use trends and average cost per acre of land in the United States 2025. Learn which land types constitute the lowest percentage, and where farmland values are highest. Updated with Department of Agriculture insights, regional trends, and an annual comparison table.
“In 2025, urban land makes up less than 3% of total U.S. land use, per Department of Agriculture data.”


Introduction: U.S. Land Use and Value Trends in 2025
Understanding land use patterns and the average cost per acre of land in the United States 2025 is vital for policymakers, investors, environmentalists, and farmers alike. With shifting agricultural practices, evolving economic conditions, and ongoing demographic changes, the distribution and value of land across the country are in constant flux. According to the Department of Agriculture, urban land—despite its visible presence in many regions—remains the land type that constitutes the lowest percentage of land use in the United States. What drives this ongoing trend, how do varying land types compare in terms of area and value, and what are the implications for the future? In this comprehensive 2025 analysis, we dive deep into the portions of land dedicated to agriculture, forestry, and other key sectors, while investigating price trends that are shaping U.S. landscapes for years to come.
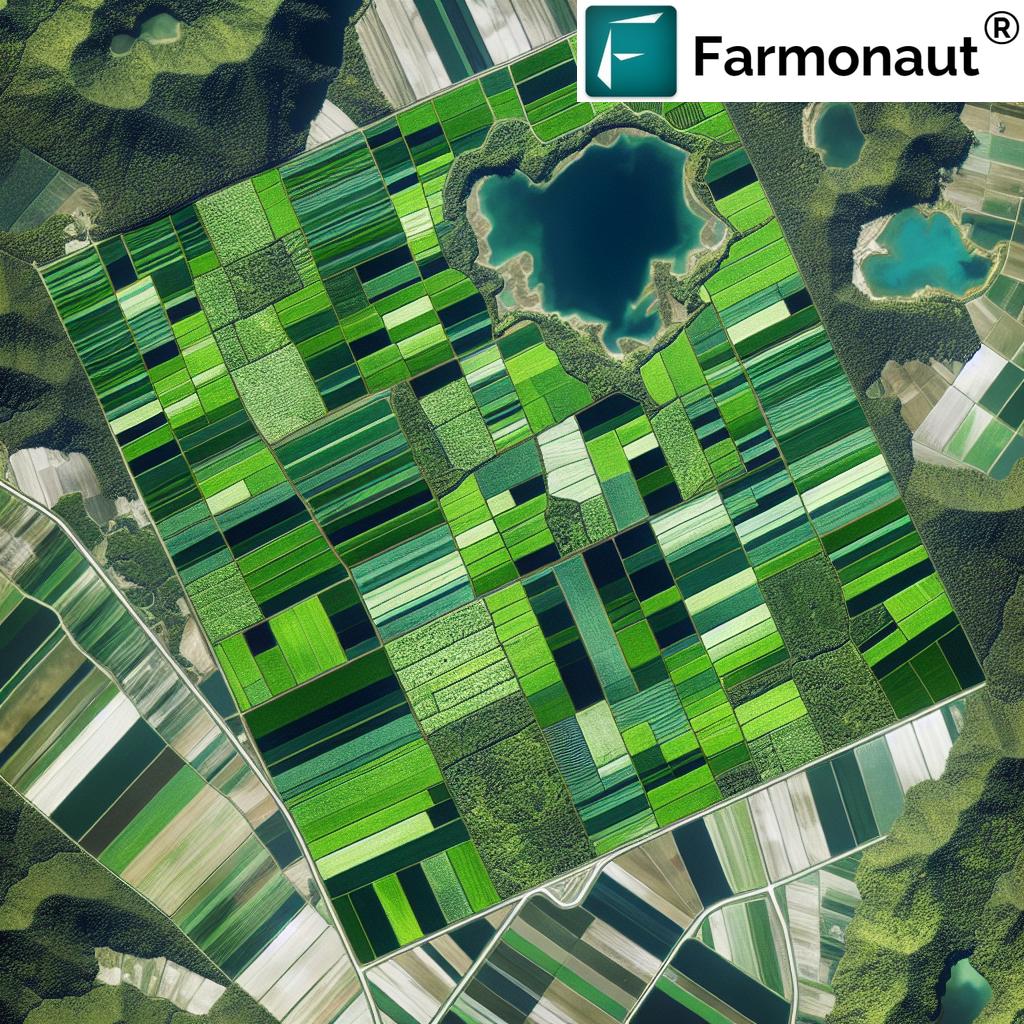
Current Land Use Distribution in the United States
To comprehend the 2025 landscape, we must first understand how land is allocated among various types—from cropping and pasture to forestry and development. The straightforward answer to the question, “according to the Department of Agriculture, which of the following land types constitutes the lowest percentage of land use in the United States?” is urban (built-up) land.
- The total land area of the United States encompasses over 2.3 billion acres.
- Urban land covers less than 5% of the overall land (about 3% as of 2025), making it the smallest major category compared to farmland, pasture, and forests.
- Agricultural land (farmland and pastureland combined) remains the single largest land category.
- Forest land occupies another massive swath of the country, especially in the Southeast, Pacific Northwest, and New England.
- Pastureland and rangeland are significant in the Midwest, Texas, the Rocky Mountains, and certain Western states.
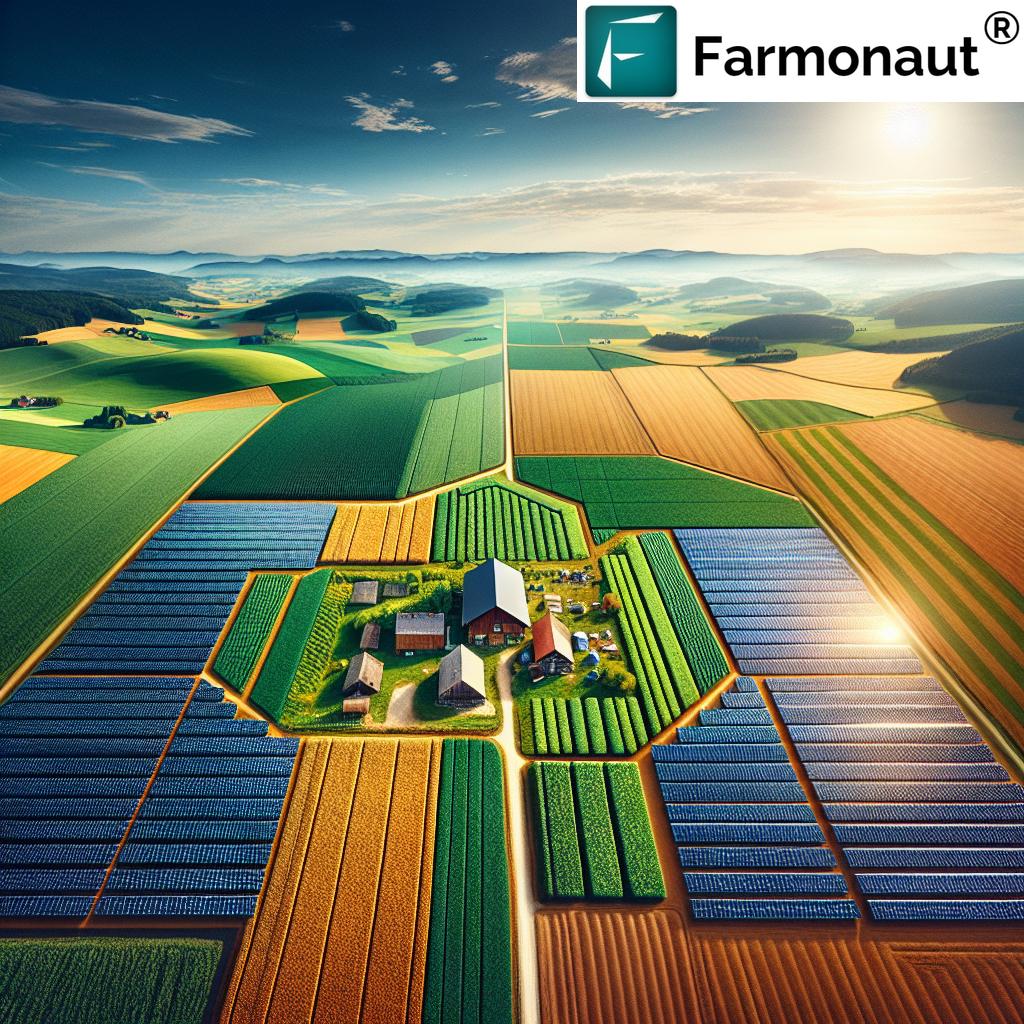
This distribution highlights the U.S. reliance on land-based primary sectors—agriculture, livestock, forestry, and natural ecosystems. Urban areas are densely concentrated but only a minor fraction of the nation’s physical footprint. The vast expanses of rural and semi-rural America are the daily reality outside the concentrated urban corridors.
- Despite rapid growth in cities like Dallas-Fort Worth (Texas), Los Angeles (California), and Chicago (Illinois), urban and built-up land continues to cover the lowest percentage of total U.S. land use.
- The majority of U.S. land remains dedicated to natural resources, farming, forestry, and open range.
Annual U.S. Land Use & Average Farmland Value by State (2025 Estimate)
Below is a detailed state-wise table that compares land areas, urban land percentages, farmland proportions, and the 2025 estimated farmland value per acre. These numbers are particularly vital for grasping where urban land remains lowest and farmland values are highest, especially in iconic agricultural states in the US like Iowa, California, Texas, Nebraska, Illinois, and national averages.
| State | Total Land Area (Acres) | % Urban Land | % Farmland | 2025 Estimated Farmland Value per Acre (USD) | Change vs. 2024 (%) |
|---|---|---|---|---|---|
| Iowa | 35,750,000 | 2.4% | 74.8% | $10,200 | +9.2% |
| Illinois | 36,060,000 | 2.6% | 72.4% | $9,850 | +8.7% |
| California | 99,900,000 | 4.1% | 25.2% | $12,000 | +6.0% |
| Nebraska | 49,480,000 | 1.8% | 46.6% | $5,050 | +5.9% |
| Texas | 171,000,000 | 2.0% | 79.4% | $4,350 | +7.3% |
| National Average | 2,303,600,000 | 3.0% | 43.1% | $4,600 | +6.8% |
Source: Department of Agriculture, 2025 Estimates. Data reflect latest surveys and economic modeling for primary agricultural states and U.S. averages. Urban land percentages are rounded to the nearest 0.1%.
A quick glance confirms that urban land constitutes below the 5% threshold in even the most developed states, often dipping well beneath 3%. Conversely, farmland makes up the lion’s share of land use in many regions, especially Texas, Iowa, Nebraska, and Illinois. Farmland values are especially high in Iowa and California due to prime acre quality, productivity, and local demand.
“Farmland value in Iowa reached over $10,000 per acre in 2025—one of the highest rates among U.S. states.”
Understanding Farmland Value Increases in 2025
Let’s take a closer look at the average cost per acre of land in the United States 2025. In 2025, the nationwide average price per acre is around $4,600. However, this figure varies widely—and often dramatically—by intended use, land quality, regional economic conditions, and prevailing market demand.
- Prime cropland in Iowa, Illinois, and Nebraska can fetch prices exceeding $10,000 per acre.
- California’s high value reflects its dominance in fruits, nuts, and vegetable production, unique climate, and demand for specialty commodities.
- Pastureland and range land (especially in less fertile, remote, or arid regions) may be valued much lower, from $1,200–$1,800 per acre.
- Grazing lands in the western states, often with poor water access, typically command some of the lowest rates.
The cost per acre continues to rise, propelled by:
- Inflation—pushing up nominal land values across all regions.
- Rising global and domestic demand for food—fueling fierce competition for quality farmland and making agricultural production a central economic priority.
- Shifting patterns in land use, urban development pressure, and water shortages (especially in the West).
A Closer Look: Prime vs. Low-Value Acreage
-
Prime farmland enjoys higher prices due to:
- Greater productivity (high yields, modern irrigation, favorable climatic conditions).
- Access to infrastructure (roads, processing plants, storage).
- Proximity to major markets (Midwestern Corn Belt, Central Valley California, etc.).
- Remote or non-irrigated grazing/range land is valued considerably lower, especially if soil is thin or water is scarce.
This disparity in land values underscores the enduring significance of agricultural states in the US like Iowa (corn and soybeans), California (specialty crops), and Nebraska—regions where productive output remains vital for national and export markets.
Regional Land Use Trends: Midwest, West, South & Northeast
America’s land use patterns aren’t uniform; they reflect local geography, climate, historical settlement, and modern economic drivers. In 2025, the following regional differences are especially pronounced:
Midwest: The Cropland Heartland
- Iowa, Illinois, and Nebraska sit at the center of U.S. agricultural production.
- Corn and soybean output drive both domestic food supply and export markets.
- Land quality here is among the most productive per acre globally, with some of the world’s richest soils.
- Urban land stays at the lowest percentage despite visible city clusters (e.g., Chicago).
West: Diversity, Specialty Crops & Scarcity
- California is the powerhouse for fruits, nuts, vegetables, and wine.
- Diverse climate zones and scarce arable land drive high prices for both cropland and urban parcels.
- Much of the West is range, desert, or mountainous forest—less suited to intensive agriculture.
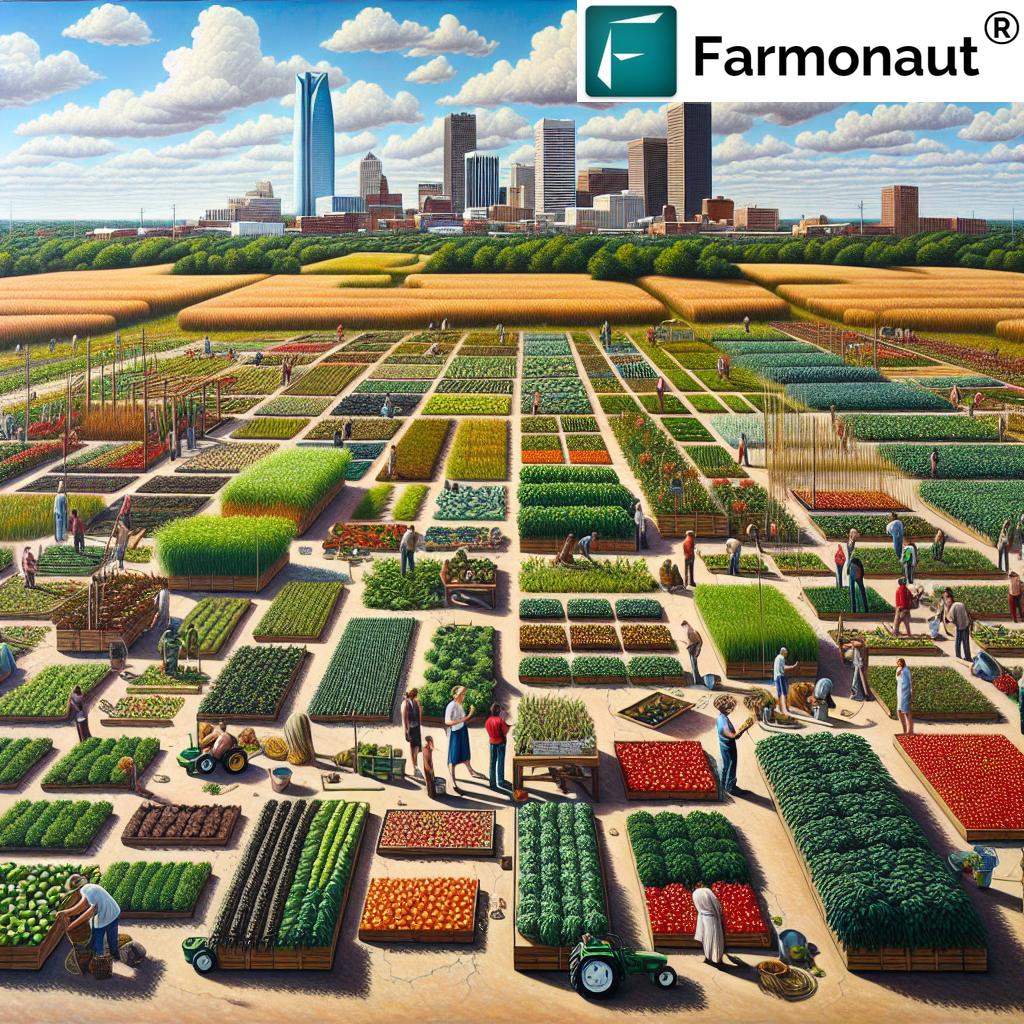
South and Southeast: Mixed Farming & Forestry
- Texas leads in livestock, rangeland, and large-scale farming.
- Forestry becomes more important in Georgia, Alabama, and neighboring states—forests cover significant portions, supporting both timber and bioresource sectors.
- Pasture expansion and commodity cropping vary depending on proximity to urban growth centers.
Northeast: Limited Space, High Pressure
- Land is tightly held; urban land percentage is below average but rising.
- Higher population densities mean more pressure on farmland conservation and higher urban prices per acre.
These regional differences highlight the dynamic interplay between economic drivers, environmental conditions, and long-term management strategies in 2025 and beyond.
Urban vs. Rural Land Use: Economic and Environmental Impacts
The U.S. has long been recognized as a nation predominantly rural or semi-rural in terms of land use. This fundamental distribution has critical economic, environmental, and social implications:
- Urban land, while highly visible in media/transportation maps, tends to sprawl less than 5% of the total U.S. area.
- Rural and natural areas (agriculture, pastureland, forest, range) continue to dominate, covering significant portions of the United States.
- Land conversion for urban growth: Ongoing population growth, particularly in the South and West, increases pressure on farmland near cities, posing threats to local food production.
-
Land management challenges persist:
- Biodiversity loss: Encroachment on forests/pastures for development.
- Environmental concerns: Water shortages, soil erosion, and pollution increase with poorly planned urban expansion.
- Infrastructure demands: New highways, utilities, and logistics must balance efficiency with environmental protection.
This persistent need to balance developed, visible infrastructure with the vast natural and productive areas is one of the defining challenges of U.S. land use in 2025.
Key Drivers of Agricultural Land Values and Use
In 2025, several major factors jointly drive farmland value increases and land use patterns:
- Production Levels and Commodity Prices: Surging demand for corn, soybeans, wheat, fruits, nuts, specialty vegetables, and livestock boosts land value in major agricultural states in the US.
- Climate Conditions & Water Resources: Reliable rainfall, aquifer access, and minimal drought risk enhance acre quality (Iowa, Illinois). Scarcity (esp. in parts of California) increases value for high-quality, irrigated parcels.
- Technological Innovation: Adoption of precision agtech, remote monitoring, and resource management tools (large scale farm management, AI-driven advisory, etc.) makes farming more efficient and sustainable.
- Policy and Subsidies: Government policies (crop insurance, farm bill subsidies, conservation programs) can influence land value directly.
As a result, states that dominate U.S. farming output—Iowa, Nebraska, Illinois, California, and Texas—continue to see competitive bidding, high production, and long-term appreciation for high-quality land.
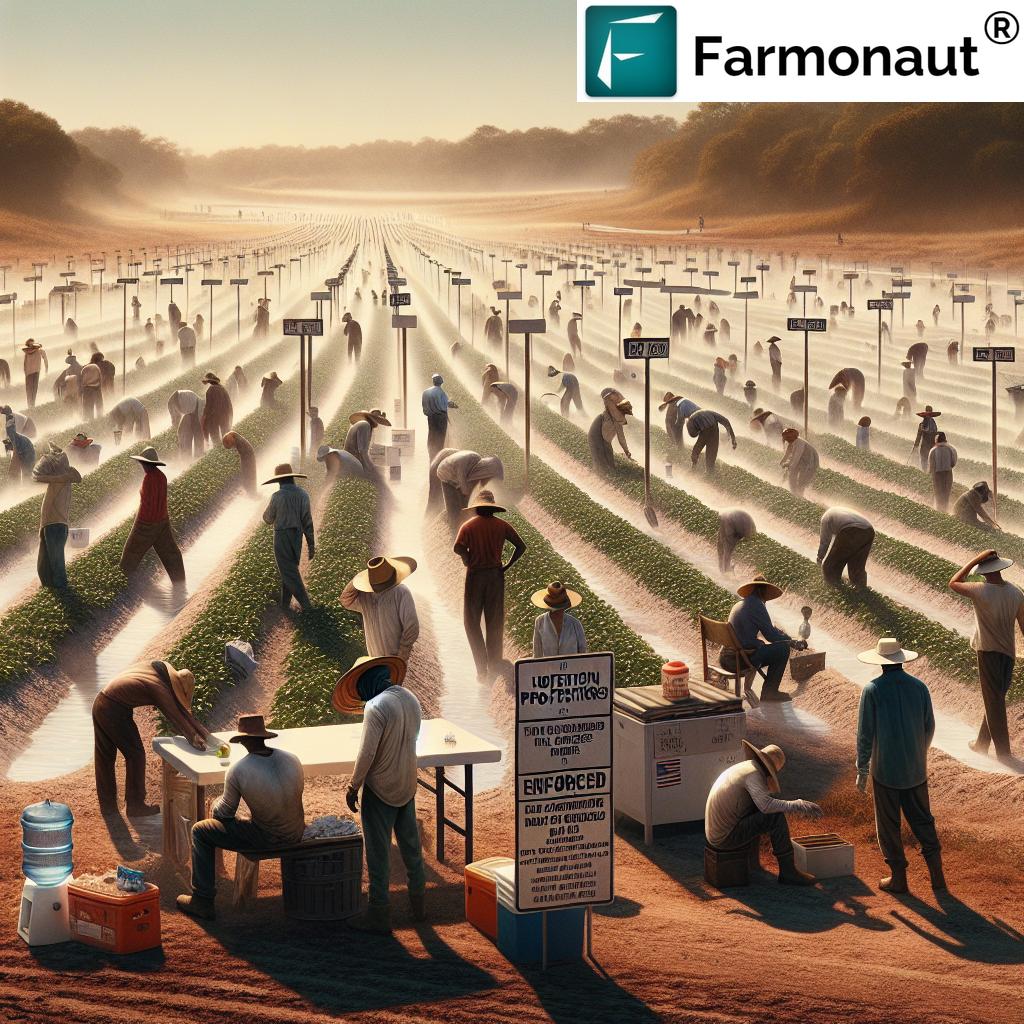
Impact on Farmers, Food Supply, and Sustainability
- Rising land prices can challenge beginning farmers but offer strong returns to established operators.
- Pressure to maintain domestic food security and sustainable production is growing in response to both environmental and geopolitical uncertainties.
For those managing large-scale agricultural operations, tools such as Farmonaut’s environmental impact tracking and fleet management systems can help drive efficiency, compliance, and sustainability.
Forestry and Pastureland: Roles in U.S. Land Use and Economy
Beyond farming, forest land and pastureland cover significant portions of the U.S.—especially in the Pacific Northwest, Southeast, and Mountain West. Forestry and pasture/range support vital economic sectors and offer major environmental services.
- Forest land: Oregon, Washington, and the Southeast (Georgia, Alabama) produce substantial timber output while actively managing forest ecosystems for sustainability. These states hold a considerable proportion of national forest assets.
- Pasture and rangeland: Particularly in Texas, Nebraska, the Rockies, and parts of the West, open range supports the livestock industry.
Why Do Forest & Pastureland Values Remain Relatively Lower?
- Lower values per acre are typical for heavily forested or rangeland parcels due to limited “productive output” per acre compared to cropland.
- Lack of access to infrastructure, remote locations, and limited marketability for rapid resale often keep prices down.
- However, sustainable management practices and carbon credit markets are starting to enhance value in select cases—see solutions like Farmonaut’s carbon footprinting to support these efforts.
Land Cost Patterns: Grazing, Cropland, and Specialty Commodities
The cost of land in 2025 isn’t just about corn and soybeans. The following patterns also play key roles:
- Grazing/rangeland: Priced considerably lower, with parcels in western states sometimes available in the $1,000–$2,500/acre range. Often remote, semi-arid, and dependent on rainfall variability.
- Cropland (fit for row crops like corn, wheat, soybeans): Higher value per acre, especially in the Midwest, where productivity and infrastructure converge.
- Specialty commodity land (California, Florida, Pacific Northwest): Facing unique valuation factors (climate, water rights, demand for wine grapes or tree crops) often resulting in some of the highest prices per acre anywhere in the country.
As production patterns, climatic conditions, and consumer tastes continue to evolve, land values will reflect this shifting demand—rewarding productive, accessible, and sustainably managed acres more than ever before.
Farmonaut: Satellite-Driven Solutions for Modern Land Management
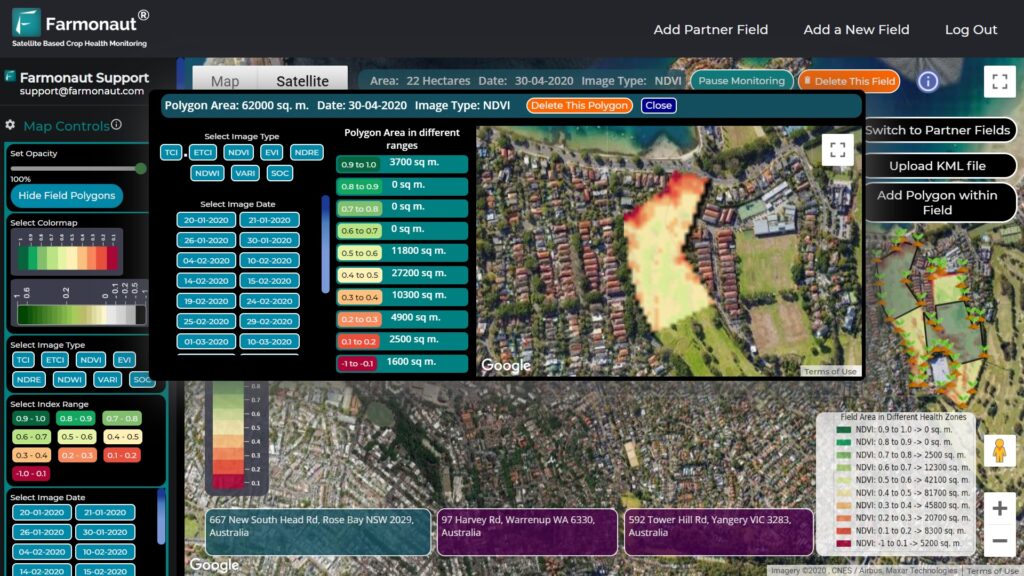
Faced with rising complexity and volatility, data-driven land management solutions are no longer optional—they’re essential for resilience and profitability. This is where we at Farmonaut step in, offering a flexible, affordable, and scalable suite of satellite-based advisory and monitoring services for the modern era.
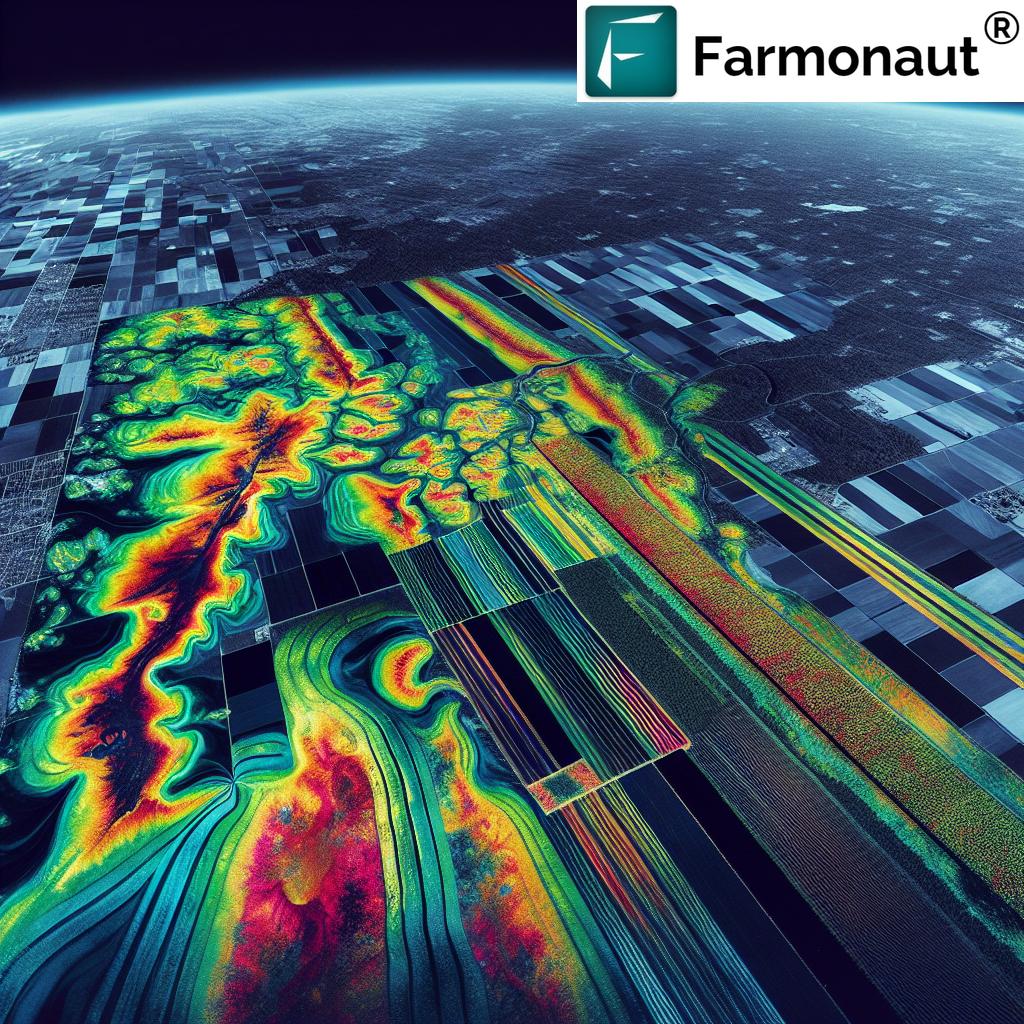
- Through our web and mobile apps, users can monitor real-time vegetation health (NDVI), analyze soil/climate conditions, and receive tailored recommendations for agriculture, forestry, mining, and infrastructure.
- Our carbon footprinting tools allow agribusinesses and foresters to track emissions, optimize sustainability, and enhance compliance with evolving environmental standards.
- With our fleet and resource management solutions, agriculture and infrastructure enterprises can reduce operating costs and boost efficiency across their assets.
- For those needing satellite-based verification for crop loans and insurance, we provide robust support to banks and insurers, improving access to capital and reducing risk for the sector as a whole.
- If you want to ensure the traceability and transparency of produce and resources, tools like our blockchain-enabled traceability solution help strengthen trust throughout the value chain.
- For developers and businesses keen to integrate satellite insights at scale, our APIs and API documentation provide access to weather, vegetation, and resource data for seamless integration.
By leveraging satellite and AI-driven data, we empower stakeholders to maximize land productivity, minimize waste, and ensure operational sustainability even as demand, inflation, and climate risks accelerate in 2025 and beyond.
Sustainability and Future Directions in U.S. Land Use
In 2025 and beyond, the challenge for The United States is twofold:
- How to accommodate expanding cities and infrastructure without sacrificing critical productive lands or forests.
- How to ensure long-term sustainable management of the vast acreage dedicated to agriculture, forestry, and pastureland for continued food security, biodiversity, and economic prosperity.
Key Strategies for the Road Ahead
- Smart land-use planning: Emphasizing compact urban growth, protecting prime cropland, and incentivizing the conservation/restoration of forest and rangelands.
- Sustainable intensification: Improving yields and resource-optimization on existing acreage using technology (satellite monitoring, AI-driven advisory from providers such as Farmonaut).
- Supporting rural economies: Providing tools, education, and finance to keep rural communities viable while innovating for the future.
- Emphasizing supply chain transparency: Ensuring consumers and businesses can trust the origins and sustainability of agricultural products (see Farmonaut’s traceability solution).
- Climate adaptation: Investing in carbon monitoring, water management, and climate-resilient crop systems.
Frequently Asked Questions (FAQ)
Which land type constitutes the lowest percentage of land use in the United States as of 2025?
According to the Department of Agriculture, urban (built-up) land constitutes the lowest percentage of total land use in the United States, falling below 5% including all cities, towns, roads, and infrastructure combined.
What is the average cost per acre of land in the United States in 2025?
The average cost per acre of land in the United States in 2025 is approximately $4,600 nationwide. However, prices vary considerably depending on the state, land use type, quality, and proximity to infrastructure or markets—as detailed extensively in the table above.
Which American states have the highest farmland values in 2025 and why?
Iowa and California have some of the highest farmland values per acre in 2025.
Iowa benefits from prime soil quality, favorable climatic conditions, and high productivity for corn/soybeans. California’s high price is driven by the production of specialty commodities, fruits, nuts, and vegetables in an environment of limited arable land and robust market demand.
How does Farmonaut assist with land management across diverse U.S. regions?
We at Farmonaut provide satellite-based monitoring, resource management, AI-based advisory, blockchain traceability, and environmental impact tracking via web and mobile apps, as well as APIs. Our solutions are used by individual farmers, businesses, and governments to maximize agricultural productivity, reduce risks, and achieve sustainability—no matter the region or land type.
What’s driving the continued rise in U.S. land prices in 2025?
Multiple factors, including inflation, heightened demand for food/agricultural exports, limited supply of high-quality land, and increased investment in sustainable/technology-driven practices, are driving up costs. Urban expansion also creates added competition for prime lands near major markets.
Where can I access Farmonaut’s solutions or integrate with its API?
You can download our web, Android, or iOS application via the links above, and access our API at https://sat.farmonaut.com/api. For developers, full documentation is available at this page.
Conclusion
Land use in the United States as of 2025 is still characterized by the overwhelming dominance of agricultural, forest, and pastureland—with urban land accounting for the lowest percentage of total land use according to the Department of Agriculture. The average cost per acre of land nationwide continues to rise, reflecting the high economic value and global significance of America’s farmland, especially in powerhouse states like Iowa and California. To safeguard food security, rural prosperity, and environmental integrity, stakeholders must embrace sustainable, technology-centric management—precisely what we offer at Farmonaut through our satellite analytics, advisory, traceability, and resource optimization solutions.
The future of land use and value in the U.S. will depend on our shared capacity to innovate, plan wisely, and steward our vast landscape for generations to come.