

US farming · State facts
Agriculture in Georgia: Top Crops, Poultry and Key Facts
Georgia’s food and fiber production was worth $18.03 billion at the farm gate in 2024, and broilers made up 36.1% of it (UGA). With related industries, UGA reports $100.4 billion in output and 370,400 jobs. Georgia also grew about half of US peanuts.
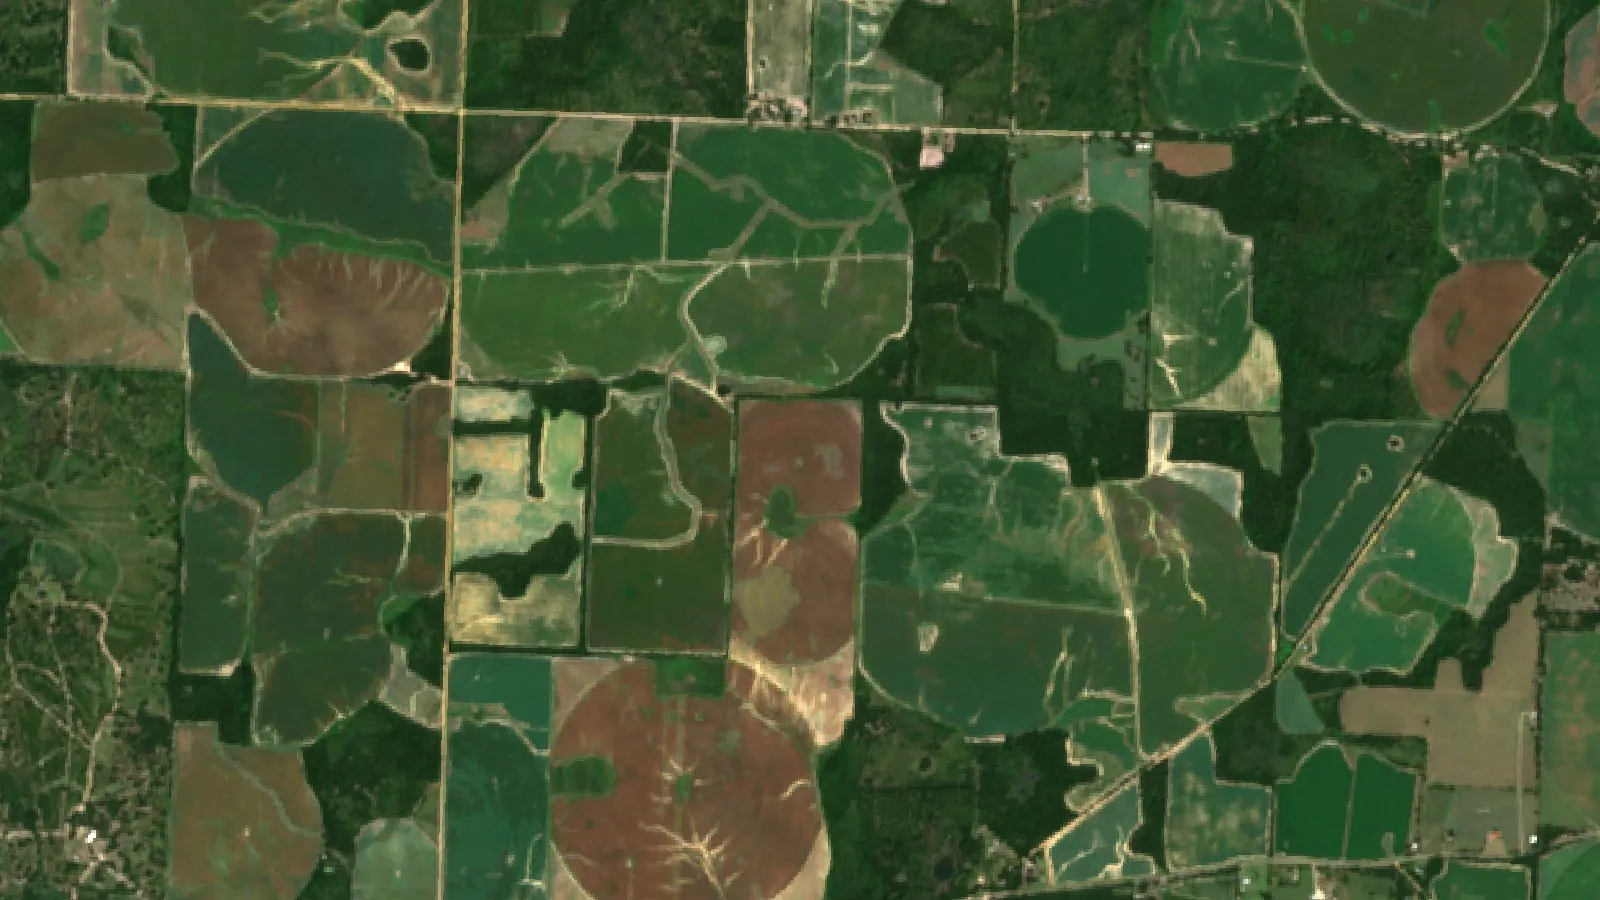
Key takeaways
- Farm gate value was $18.03 billion in 2024; output with related industries was $100.4 billion, supporting 370,400 jobs (UGA).
- Georgia raised the most US broilers in 2025, at 1.317 billion, but North Carolina led on pounds and value (USDA NASS).
- Georgia grew about 52% of US peanuts in 2025, worth $870.9 million (USDA NASS).
- USDA’s October 2026 forecast shows harvested peanut acres down 27% and cotton acres up 25% in Georgia.
- NOAA counts 13 billion-dollar weather events affecting the state in 2024, against a 1980-2024 average of 3.0 a year.
In this article
- 5 facts about Georgia agriculture
- How big is agriculture in Georgia?
- Main crops and livestock grown in Georgia
- Is Georgia the top poultry state?
- Peanuts and cotton: the big acreage swing
- Fruit, nuts, vegetables and timber
- Technology on Georgia farms
- Conservation and soil health
- Challenges facing Georgia agriculture
- Farm jobs and careers
- What this means for farm owners and managers
- FAQ
Agriculture in Georgia, the US state, produced food and fiber worth $18.03 billion at the farm gate in 2024, and broilers made up 36.1% of it, according to the University of Georgia’s Georgia Ag Impact Report. With related industries, the same report puts the total at $100.4 billion in economic output and 370,400 jobs. Georgia also grew about half of the nation’s peanuts.
This guide gives the facts behind those headline numbers: what Georgia grows, how much land it uses, where it leads the country and where it does not. It also covers the large shift out of peanuts and into cotton that USDA forecast for 2026, and it includes a calculator for comparing the two crops on your own numbers. All figures carry their year and source. This page covers the US state, not the country of Georgia.
5 facts about Georgia agriculture
If you only need the short version, start with these five points. Each has more detail further down the page.
- Chickens come first. Broilers were worth $6.1 billion in 2024, more than the next five commodities combined (UGA Ag Impact Report).
- Georgia grows half of US peanuts. It produced 3.67 billion of the 7.10 billion pounds grown nationally in 2025, or about 52% (USDA NASS).
- The sector is large in land terms. USDA counts 38,000 farms and 9.9 million acres, an average of 261 acres per farm, in its 2025 overview.
- The total depends on what is counted. Farm gate value was $18.03 billion in 2024, and output including related industries was $100.4 billion. These are different measures.
- Forests count too. UGA calls Georgia the top forestry state in the nation, and timber was worth $655.6 million at the farm gate in 2024.
Students often meet this topic as a quiz question: “Which statement regarding Georgia agriculture in the early 21st century is most accurate?” The answer options vary, so check your own list. The numbers support this statement: Georgia farming is led by poultry, with cotton, peanuts, fruit, nuts, vegetables and timber adding a wide spread of other income. A statement that row crops alone drive the state’s farm economy does not fit the data.
How big is agriculture in Georgia?
Several different measures get quoted, and they are easy to mix up. Some older pages quote $74.3 billion. The current UGA report uses 2024 data and a total of $100.4 billion.
| Measure | Latest figure | What it counts | Source |
|---|---|---|---|
| Farm gate value | $18.03 billion (2024) | County-level value of food and fiber production, including timber | UGA |
| Cash receipts | $12.6 billion (2024) | Money from commodity sales, as reported by USDA | UGA outlook, citing USDA |
| Net cash income | $4.6 billion (2024) | Farm income after cash expenses; eighth among states | UGA outlook |
| Economic output | $100.4 billion (2024) | Food and fiber production plus related industries, from an IMPLAN model | UGA |
| Jobs supported | 370,400 (2024) | Jobs in production and related industries | UGA |
The farm gate figure is built from estimates by county UGA Extension agents, then refined by analysts at the university. It rose from $17.6 billion in 2023. Farm income moved more sharply: the 2026 Georgia Ag Economic Outlook reports that net cash income rose by $1.3 billion in 2024, which lifted the state from 17th to eighth among US states.
Output is not the same as profit, and it is not a share of the state’s economy that a farmer earns. UGA sets the $100.4 billion against $1.5 trillion of total state output, which works out at about 6.7%. It also calculates a contribution of more than $8,987 per person. Trucking is the largest of the linked employers it lists, with 6,045 jobs, followed by wholesale trade and company management.
Jobs need the same care. The 2023 estimate was 381,200 jobs on $91.4 billion of output, and the 2024 figure is 370,400 on $100.4 billion. So output rose while estimated jobs fell. If you quote either number, give its year.
Main crops and livestock grown in Georgia
The top of the list is mostly animals, greenhouse plants and two row crops. Poultry and eggs reach far beyond one region, as UGA reports that nearly 75% of the state’s counties were involved in them in 2024. It also lists dairy, corn and blueberries in the top ten, at $469.3 million, $382.8 million and $382.7 million.
Chart
Georgia’s top farm commodities by farm gate value
US$ million, 2024 (top eight; broilers, beef and eggs rounded by the source to the nearest $0.1 billion)
USDA’s own crop data use a different basis, so the dollar values differ from UGA’s. The table below uses the USDA NASS 2025 State Agriculture Overview for Georgia. The last column is our own calculation of yield times the listed price. It shows gross income only, before any costs, and it leaves out cottonseed income. It will not always match value divided by acres: for peanuts, USDA’s listed value is higher than yield times price.
| Crop | Harvested acres | Yield per acre | Value (2025) | Gross per acre |
|---|---|---|---|---|
| Peanuts | 910,000 | 4,030 lb | $870.9 million | About $903 |
| Upland cotton lint | 825,000 | 1,033 lb | $548.6 million | About $675 |
| Corn for grain | 505,000 | 187 bu | $458.2 million | About $916 |
| Blueberries | 23,200 | 5,100 lb | $224.6 million | About $9,800 |
| Pecans | 145,000 | 768 lb | $209.6 million | About $1,440 |
| Sweet corn | 27,400 | 140 cwt | $144.6 million | About $5,280 |
| Watermelon | 18,900 | 430 cwt | $141.4 million | About $7,480 |
| Soybeans | 145,000 | 49 bu | $78.6 million | About $544 |
High gross income per acre does not mean high profit. Blueberries, pecans and vegetables usually carry higher costs for planting, picking and packing, and an orchard takes years to bear a crop. Use the table to compare the scale of each crop, not to choose one.
UGA’s 2026 report, using USDA data, ranks Georgia first by production value for broilers and peanuts; second for pecans, watermelon and cotton; and third for bell peppers, cantaloupe, onions, peaches and sweet corn. USDA’s 2025 broiler value puts North Carolina ahead, as the poultry section shows. For more on the row crops, see our guides to when cotton is harvested and corn yield per acre by state.
Peaches are a useful reminder that a state’s nickname and its farm data can tell different stories. The “Peach State” produced 31,310 tons worth $52.1 million in 2025 (USDA NASS). That is less than a tenth of the value of its peanuts.
Is Georgia the top poultry state?
By the number of birds, yes. By weight and value in 2025, no. USDA’s Poultry Production and Value 2025 Summary shows Georgia raised 1.317 billion broilers, 14% of the US total and more than any other state. North Carolina raised fewer birds, but they were heavier, so it led on pounds and value.
Chart
Broilers raised by state
Million birds, 2025, six largest states shown in the USDA table
| Measure (2025) | Georgia | North Carolina |
|---|---|---|
| Broilers raised | 1.317 billion | 985 million |
| Live weight | 8.17 billion lb | 8.27 billion lb |
| Value of production | $5.85 billion | $5.92 billion |
The lead was narrow and it is recent. In 2024, the same USDA report shows Georgia ahead on both birds and pounds, with 8.19 billion pounds against 8.10 billion for North Carolina. Note that UGA’s $6.1 billion farm gate value for broilers is a 2024 estimate on a different basis, so it should not be compared directly with USDA’s 2025 value.
Poultry’s weight in farm sales is even larger than its farm gate share. The UGA outlook, citing USDA, puts poultry at 48% of the state’s commodity cash receipts and eggs at 8%. Cotton and peanuts stand at about 7% each.
Most of this production runs on contracts. Nationally, the National Chicken Council’s key facts say about 25,000 family farmers hold contracts with chicken companies, and that these farms raise about 95% of broilers. These national figures are several years old and are not specific to Georgia. A grower on contract usually supplies the houses and labor, so income depends on the contract as much as on the market price. Get contract terms reviewed by a professional adviser before you borrow to build houses.
UGA economists expected stable, incremental growth for broilers in 2026, after strong production growth weighed on prices in late 2025, according to the 2026 Georgia Ag Forecast.
Peanuts and cotton: the big acreage swing
The largest recent change in Georgia’s row crops is a swap between these two. USDA’s October 2026 Crop Production report forecasts harvested peanut area down 27%, from 910,000 acres to 660,000. Cotton is forecast up 25%, from 825,000 acres to 1.03 million. These are forecasts, and the final numbers may differ.
Chart
Georgia harvested acres: 2025 vs 2026 forecast
Thousand acres, USDA forecast as of 1 October 2026
The same report forecasts Georgia’s peanut crop at 2.67 billion pounds, down from 3.67 billion in 2025. National output is also forecast to fall, to 5.11 billion pounds, so Georgia would still hold about 52% of it. Cotton is forecast at 2 million bales, up from 1.775 million, even though the expected yield falls from 1,033 to 932 pounds per acre.
The move followed a hard market for peanuts. Early in 2026, UGA’s forecast warned that oversupply would keep pressure on prices, with prices that may stay around $350 to $475 per ton without a major trade breakthrough. It expected high acreage to continue, and growers then planted far less than that. The USDA overview shows a 2025 average price of 22.4 cents per pound, which is about $448 per ton.
Moving to cotton is not an easy win either. The same forecast describes US cotton growers as financially strained, with high input costs, higher interest rates and weak prices. The 2025 average price in the USDA overview was 65.3 cents per pound. Corn, soybeans and wheat are also tight: UGA projected prices near or below the breakeven cost of production for 2026.
Peanut yields have held up well against the national average. Georgia’s 2023 to 2025 yields were between 3,850 and 4,080 pounds per acre, based on the Crop Production 2025 Summary and the later October revision for 2025. Cotton growers can read our guide to soil types for cotton before adding acres on new ground.
Chart
Peanut yield: Georgia vs US
Pounds per acre; 2025 uses the revised October 2026 figures
Try the numbers for your own farm below.
Calculator
Peanuts or cotton: which leaves more per acre on your farm?
Enter your own yields, prices and costs for each crop.
- Peanut margin per acre (US$): $0
- Cotton margin per acre (US$): $0
- Difference on your acres (US$): $0
Example values only, chosen so both crops break even; they are not benchmarks or forecasts. Prices and costs are your inputs, and yields should be your own. For reference, USDA NASS reports 2025 Georgia yields of 4,030 lb of peanuts and 1,033 lb of cotton per acre. Cottonseed income, crop insurance and rotation effects are not included. Get professional advice before making planting decisions.
Fruit, nuts, vegetables and timber
Fruit, nuts and vegetables use far less land than row crops, yet they bring in a large share of crop income. They also spread risk, because a poor year for one market does not always hit the others.
Blueberries and pecans
Blueberries now lead the state’s fruit and nut group, and UGA expects them to keep that place in 2026 and beyond barring a major shock. Georgia’s utilized crop was 116.7 million pounds in 2025. About 83 million pounds went to the fresh market at $2.48 per pound, and about 34 million pounds went to processing at 56 cents (USDA NASS Noncitrus Fruits and Nuts summary). The price gap shows why fresh-market quality matters so much to growers.
Blueberry income also swings. Utilized value was $158 million in 2024 and $224.6 million in 2025, while the crop itself shrank. Pecans produced 111.5 million pounds in 2025, worth $209.6 million, and USDA’s October report forecasts 110 million pounds for 2026. UGA says it would be hard for pecans to regain the lead in this group, though it expects the industry to remain strong.
Vegetables
USDA’s 2025 overview lists sweet corn, watermelon, bell peppers, cabbage, squash, cucumbers and snap beans among the state’s vegetable and melon crops. Sweet corn was the largest of these at $144.6 million, just ahead of watermelon at $141.4 million. Bell peppers came to $45.7 million and cabbage to $33.4 million.
Timber
Timber was worth $655.6 million at the farm gate in 2024, which placed it seventh among the state’s commodities. UGA’s 2026 forecast expects sawtimber prices to stay stable across most of the state. It also points to weak housing demand, mill closures and labor shortages. Supplies of sawtimber are tighter in areas hit by Hurricane Helene.
Technology on Georgia farms
Claims of a rapid switch to drones, sensors and artificial intelligence are common, but national data give a more measured picture. USDA’s Economic Research Service report on precision agriculture in the digital era tracked adoption from 1996 to 2019. Automated guidance was used on well over 50% of acres planted to corn, cotton, rice, sorghum, soybeans and winter wheat. Yield maps, soil maps and variable rate technology were used on only 5% to 25% of US acres for winter wheat, cotton, sorghum and rice, and much more on corn and soybeans. These figures are national, so a Georgia farm may differ.
In practice, these are the tools a Georgia grower is most likely to compare:
- Guidance and auto-steer. Cuts overlap and missed rows when planting and spraying. It suits large row-crop fields.
- Yield maps and soil maps. Show which parts of a field pay and which do not. They need a few seasons of records to be useful.
- Variable rate application. Changes seed or fertilizer rates across a field. It is most likely to pay where the field is truly uneven. Follow product labels and local rules.
- Satellite vegetation maps. Show where plant growth differs across a field, so you know where to walk first. They show a change in the crop, not its cause, so you still need to scout.
- Soil moisture sensors and irrigation scheduling. Help decide when to run a center pivot. Readings apply near the sensor, so placement matters.
- House controllers in poultry. Manage temperature and ventilation in broiler houses. Your integrator’s contract may set the requirements.
Before you buy anything, name the decision that the tool will change, and work out what that change is worth per acre. If no decision changes, the data will not pay for itself.
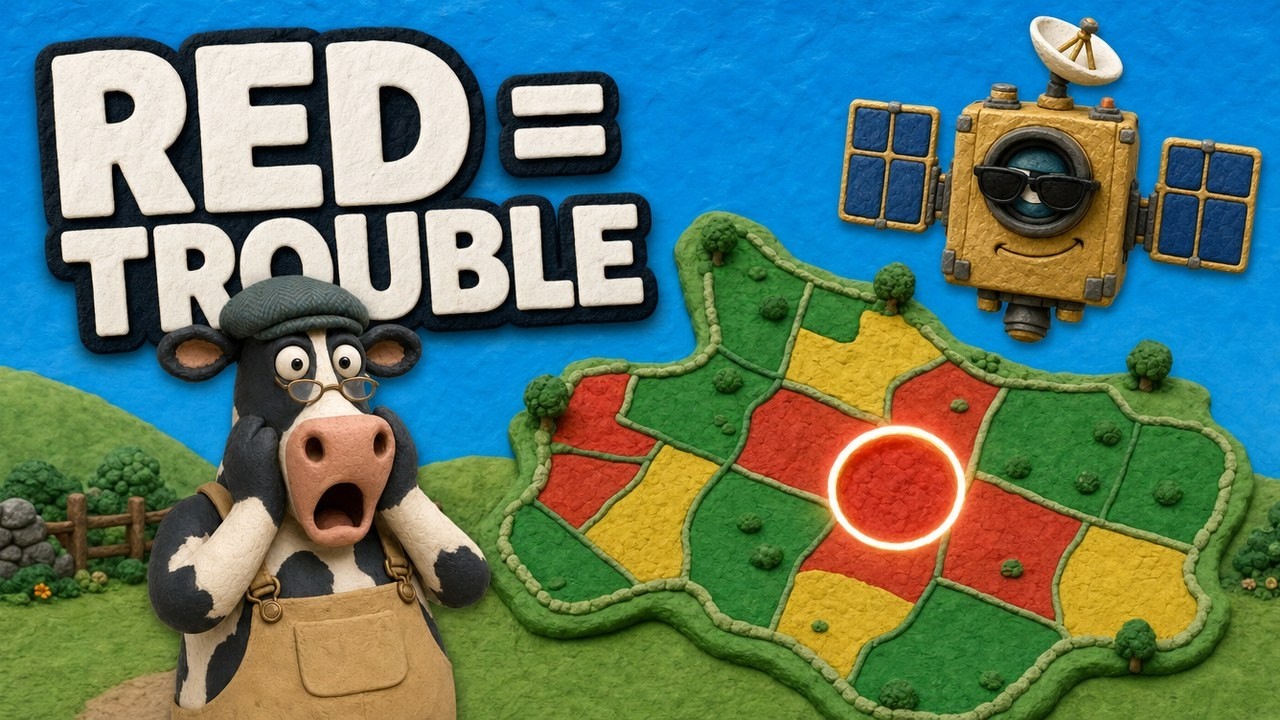
▶ How satellite NDVI maps show crop stress across a large farm, explained with humor. · 4:09
Conservation and soil health
Cover crops, no-till and careful irrigation all aim to protect soil and water. Nationally, the 2022 Census of Agriculture counted 18.0 million acres of cover crops, 17% more than in 2017, according to an analysis by farmdoc daily at the University of Illinois. Growth slowed compared with the 50% rise between 2012 and 2017.
Cover crops can slow erosion and build soil health, as USDA’s SARE program explains, though the payback varies by farm and may take time. For a Georgia row-crop grower, the sensible test is a strip trial on one field, with yield and cost records kept for several seasons. Local UGA Extension agents can advise on species and planting dates for your county. Check the label on any herbicide you use to end a cover crop, including its plant-back limits.
Challenges facing Georgia agriculture
UGA’s 2026 forecast and NOAA’s data through 2024 point to these pressures on Georgia farms: weather, costs, prices, trade and labor.
- Weather disasters. NOAA counts 134 billion-dollar weather and climate events that affected the state from 1980 to 2024, including 27 tropical cyclones and 17 droughts. These figures cover all sectors, not only farms.
- Input costs. UGA’s forecast expected fertilizer spending to increase in 2026, while interest and H-2A labor categories were forecast to move lower. Production expenses were expected to have risen in 2025.
- Oversupply and prices. Peanuts, cotton and grains all entered 2026 with weak or volatile prices.
- Exports and trade. UGA named trade outcomes as a key factor for peanut prices, and rising Brazilian output and lower Chinese buying as pressures on cotton.
- Labor. UGA lists labor shortages among the factors for timber markets and rising labor costs among the 2025 expense increases.
The trend in weather events is steep. According to NOAA’s state summary for Georgia, the long-run average was 3.0 events per year, after adjusting for inflation. The 2020 to 2024 average was 9.8 per year, and 2024 alone had 13. Tropical cyclones made up more than half of the total cost over the full period.
For a farm manager, this points to simple steps: review crop insurance before the deadline, keep dated field records and photos, and hold enough cash to get through a bad harvest. A licensed crop insurance agent or financial adviser can check these plans against your own farm’s position.
Farm jobs and careers
Food and fiber production and related industries supported 370,400 jobs in 2024, according to UGA. That covers much more than farm work. It includes trucking, wholesale, insurance, rail and more. Students and people changing careers should look well beyond the farm itself, at roles in logistics, processing, equipment and agronomy.

▶ Twenty careers in agriculture, what each job involves and its typical US pay. · 7:04
What this means for farm owners and managers
Georgia’s numbers point to a few practical lessons for anyone running or starting a farm in the state.
- Plan for acreage swings. A 27% fall in peanut area in one year shows how fast the crop mix can change. Run the budget for both crops before you book inputs or contracts.
- Know which number you are using. A farm gate value, a USDA value and a contract price are not interchangeable.
- Watch your own yield gap. Compare your fields with the state average of 4,030 pounds of peanuts or 1,033 pounds of cotton per acre for 2025, and find out why any field falls short.
- Check fields in a planned order. On large farms, map the areas that changed most and walk those first.
Farmonaut’s satellite maps can help with that last step. You draw your fields once, then see vegetation maps through the season on the web, Android or iOS. A field visit is still needed to find the cause of any change.
Related pages on our site: best farming states in the US; farming and climate change; large farm administration; carbon footprint tracking; crop loan and insurance checks; farm fleet management; product traceability; satellite and weather data documentation; satellite field maps; satellite data API.

▶ A step-by-step tutorial on monitoring crops in the Farmonaut web system. · 8:43
FAQ
What is the main agricultural product in Georgia?
Broilers, the chickens raised for meat. They were worth $6.1 billion in 2024, which is 36.1% of the state’s farm gate value (UGA). Peanuts are the largest crop on USDA’s 2025 list, at $870.9 million.
What are the main crops grown in Georgia?
By 2025 value, the largest crops were peanuts, cotton, corn, blueberries, pecans, sweet corn, hay and watermelon (USDA NASS). Soybeans, peaches, bell peppers and other vegetables follow.
How much does agriculture contribute to Georgia’s economy?
UGA reports $18.03 billion in farm gate value for 2024. With related industries, it reports $100.4 billion in output and 370,400 jobs, based on an IMPLAN economic model.
How much of Georgia is farmland?
USDA’s 2025 overview counts 9.9 million acres on 38,000 farms, an average of 261 acres. UGA reports 9,953,730 acres, a 235-acre average farm and 3,628,707 acres of harvested cropland. The averages differ because the sources use different data.
Why is agriculture so important in Georgia?
UGA calls it the state’s No. 1 industry. It supports jobs in rural counties and in linked trades such as trucking and wholesale, and nearly 75% of counties had poultry or egg production in 2024.
Does Georgia lead the US in peanuts and pecans?
Georgia ranks first for peanuts, with about 52% of US output in 2025. For pecans, UGA ranks it second by production value.
Farmonaut crop monitoring
See your own fields from space
Draw your fields once and Farmonaut shows satellite vegetation maps for them through the season, on web, Android or iOS.




Keep reading

Sources
- University of Georgia CAES, Georgia Ag Impact Report 2026 (2024 data): discover.caes.uga.edu
- UGA CAES, 2026 Georgia Ag Economic Outlook (AP 130-4-02, January 2026): fieldreport.caes.uga.edu
- UGA CAES, 2026 Georgia Ag Forecast (AP 130-4, February 2026): fieldreport.caes.uga.edu
- USDA NASS, 2025 State Agriculture Overview for Georgia: nass.usda.gov
- USDA NASS, Poultry Production and Value 2025 Summary (April 2026): release.nass.usda.gov
- USDA NASS, Crop Production (October 2026): release.nass.usda.gov
- USDA NASS, Crop Production 2025 Summary (January 2026): release.nass.usda.gov
- USDA NASS, Noncitrus Fruits and Nuts 2025 Summary (May 2026): release.nass.usda.gov
- NOAA NCEI, Billion-Dollar Weather and Climate Disasters: Georgia summary (1980-2024): ncei.noaa.gov
- USDA ERS, Precision Agriculture in the Digital Era: Recent Adoption on U.S. Farms (EIB-248): ers.usda.gov
- farmdoc daily, University of Illinois, Cover Crops and Covered Cropland: 2022 US Census of Agriculture (2024): farmdocdaily.illinois.edu
- USDA SARE, Cover Crops: sare.org
- National Chicken Council, Broiler Chicken Industry Key Facts: nationalchickencouncil.org
Discussion
Questions, corrections or field experience? Share them below. First-time comments are reviewed before they appear, and your email is never published.
No comments yet. Be the first to add a question or your experience.

 Pixxel
 Sapoznick Farms
 Agrotoken
 Blue BearX
 Insignito
 Croptimum
 DnCubed
 Field Capacity
 Indosistim Teknologi
 Liquify Digital
 CU Foods
 BeyondTech Global
 Rouge VC
 AgroGreen Dynamics
 AgroRisk
 Oath Inc
 Reddane Farming
 Esri North East Africa

 Licence holder · Niger · Gold
 Client · Tanzania · Gold
 Client · Somalia · Gold










