
Land Use Color Codes: 5 Top California Mapping Systems — Unlocking Sustainable Agricultural and Forestry Land Management with GIS Technology


Table of Contents
- Introduction: The Role of Land Use Color Codes
- Understanding Land Use Color Codes
- Why Land Use Color Codes Matter in Sustainable Land Management
- The Top 5 California Land Use Color Code Mapping Systems
- Comparative Feature Table: Leading Mapping Systems
- Applications in Agriculture and Forestry
- Technological Innovations in Land Use Mapping and Management
- Challenges and Considerations in Land Use Classification
- Farmonaut: Powering Precision Agriculture With Cutting-Edge Land Use Data
- The Future of GIS Land Use Analysis & Sustainable Management
- Frequently Asked Questions
- Farmonaut Subscription & Access
Introduction: The Role of Land Use Color Codes
In a state as diverse and agriculturally productive as California, effective land use classification is indispensable. Whether we are evaluating urban land use mapping in Los Angeles, monitoring agricultural land in the Central Valley, or guiding conservation in Sierra Nevada forests, standardized land cover categories are crucial for enabling sustainable land management practices.
At the heart of this process lie land use color codes—the vibrant language that transforms dense, complex spatial data into easily interpretable maps. These color-coded systems convert raw GIS information into actionable intelligence for farmers, foresters, policymakers, and researchers alike.
In this comprehensive guide, we delve deep into the evolution, standards, and modern applications of five leading California land use mapping systems, showing how they empower stakeholders to make informed decisions and optimize resource management in agricultural, forestry, and urban contexts.
Understanding Land Use Color Codes
Land use color codes are the backbone of land use/land cover (LULC) mapping. By assigning distinct color values to various land use categories, these codes enhance the clarity and effectiveness of spatial representation within GIS and other geographic information systems.
What Are Land Use Color Codes?
A land use color code system is a standardized set of colors—often defined in RGBA or HEX formats—assigned to represent different land use or land cover categories on maps. For example, a “pastures” field might be shown in bright green, while “rice” could be pink or lavender, and “urban areas” depicted in shades of grey or purple.
- Clarity: Assigning colors makes map interpretation fast and intuitive, even for non-specialists.
- Consistency: Standardized codes facilitate data exchange between agencies, researchers, and practitioners.
- Comparability: Uniform codes help in analysis and monitoring across regions, scales, and timeframes.
Modern GIS land use analysis depends on these visual standards to optimize resource allocation, tracking, planning, and development.
Why Land Use Color Codes Matter in Sustainable Land Management
- Enhancing Sustainable Practices: Accurate color-coded classification helps us balance conservation goals with agricultural and urban needs.
- Boosting Resource Management: By visualizing various patterns, we identify optimal areas for crops, forests, urban expansion, or conservation.
- Supporting Policy and Zoning: Urban planners and lawmakers utilize these codes for land use planning and development that’s both ecologically and economically sound.
- Monitoring Change: Color codes are pivotal for environmental monitoring with GIS—detecting shifts caused by climate, urbanization, or changes in agricultural practices.
With more than 80% of California’s land use maps relying on standardized color codes, as noted above, these systems have become integral to sustainable resource management and informed decision-making.
The Top 5 California Land Use Color Code Mapping Systems
Let’s explore the five systems that shape California’s approach to land use classification, fostering sustainable agricultural land mapping, urban planning, and forestry resource management:
- CORINE Land Cover (CLC) (European Model, Global Applicability)
- Australian Land Use and Management Classification (ALUMC) (Reference for Comparative Studies)
- California Land Use Classification System (Primary system for Californian mapping agencies)
- Delaware Land Use Land Cover Classification (US Benchmark, enables cross-comparison)
- Hawaii Agricultural Land Use Classification (Specialized tropical agriculture/forestry mapping)
Each system is unique in its color codes, classification hierarchy, and its methods for assigning distinct categories to land types—whether croplands, forests, irrigated pastures, or urban surfaces.
1. CORINE Land Cover (CLC): The Benchmark of Standardization
Developed by the European Environment Agency, the CORINE Land Cover (CLC) system serves as a global model. It classifies land cover into dozens of essential categories. For instance, “Pastures” are represented by the RGBA color [230, 230, 77, 255], offering tremendous clarity in distinguishing pasture areas. “Annual crops associated with permanent crops” are shown as [255, 230, 166, 255].
- Widely used in comparative environmental monitoring and agricultural land mapping efforts worldwide.
- Strengths: High standardization, internationally recognized.
2. Australian Land Use and Management Classification (ALUMC): Unique Codes for Unsurpassed Detail
The ALUMC system, refined for Australia, assigns nuanced color codes to categories like “Irrigated plantation forests” ([236, 255, 224, 255]) and “Grazing irrigated modified pastures” ([255, 170, 0, 255]).
- Key in resource and forestry management, serving as inspiration for Californian adaptations.
- Category diversity enables advanced spatial analysis in sustainable land management practices.
3. California Land Use Classification System: The Home Standard
California’s own system is tailored to local geography. For example, “Rice” fields appear in [205, 102, 153, 255] and “Pasture” in [74, 148, 135, 255].
- Covers extensive agricultural landscapes, forestry regions, and urban land use zones.
- Primary tool for local authorities and agencies involved in sustainable management, spatial analysis, and urban expansion planning.
4. Delaware Land Use Land Cover Classification: U.S. Comparative Context
Delaware’s mapping system offers valuable benchmarks. “Rangeland” appears as [255, 170, 0, 255], “Orchards/Nurseries/Horticulture” as [102, 204, 170, 255].
- Facilitates regional comparisons and the analysis of cross-border land use patterns.
- Highlights the importance of assigning unique codes for local ecological or agricultural features.
5. Hawaii Agricultural Land Use Classification: Insights for Specialty Crops
In Hawaii, aquaculture is shown in [40, 146, 199, 255] and “Seed Production” in [0, 168, 132, 255].
- Specialized for tropical agriculture and forestry, supporting effective planning in unique environments.


Comparative Feature Table: Leading Mapping Systems in California
To help stakeholders quickly compare these major mapping systems, here is a detailed table emphasizing color codes, GIS technologies utilized, application areas, regional scope, and innovation highlights.
| Mapping System Name | Standardized Color Codes Used | Key GIS Technologies | Primary Application Areas | Year Introduced (Estimated) | Coverage (Approximate Sq. Miles/Acres) |
|---|---|---|---|---|---|
| CORINE Land Cover (CLC) | International RGB/RGBA standards (e.g., Pastures: 230,230,77,255) | ArcGIS, Remote Sensing, Satellite Imagery | Agriculture, Forestry, Urban, Environmental Monitoring | 1985-1990 | All Europe (& adopted globally; California use for comparison: ~164,000 sq mi) |
| ALUMC (Australia) | Unique RGB codes (e.g., Irrigated Forest: 236,255,224,255) | ESRI ArcGIS, Remote Sensing, Digital Cartography | Agriculture, Forestry, Urban, Grazing, Environmental Impact | 2000s | ~2,969,907 sq mi (Australia); California using adapted classes: 155,000 sq mi |
| California Land Use Classification System | Customized RGB codes (e.g., Rice: 205,102,153,255; Pasture: 74,148,135,255) | CA State GIS; Remote Sensing; Satellite APIs | California Agriculture, Forestry, Urban Growth, Water Resource Planning | 2003 | ~155,000 sq mi |
| Delaware LULC System | Distinct US RGB codes (e.g., Rangeland: 255,170,0,255) | Statewide GIS, ESRI Extensions | Agriculture, Urban Planning, Environmental Monitoring, Horticulture | 2010 | Delaware: 2,491 sq mi; Reference for comparative projects |
| Hawaii Agricultural LULC System | Specialized RGB (e.g., Aquaculture: 40,146,199,255; Seed Production: 0,168,132,255) | Island GIS, Satellite Digital Mapping | Tropical Agriculture, Aquaculture, Seed Farms, Conservation | 2016 | 10,931 sq mi (Hawaii statewide); reference for specialty crop areas in California |
Applications of Land Use Color Codes in Agriculture and Forestry
The real strength of land use color codes lies in their practical applications—empowering every level of management, from county planners to family-run farms. Let’s review the core benefits for agricultural and forestry professionals.
Resource Management & Optimization
- Precise resource allocation: By identifying areas suitable for specific crops, pastures, or forest management, we minimize waste and optimize inputs like water, fertilizer, and energy.
- Fleet and Logistics: Digital maps with color-coded zones help manage machinery movement and reduce inefficiencies.
Farmonaut’s Fleet Management solution (Fleet Management page) provides centralized oversight, ensuring safety, cost savings, and on-time agricultural operations.
Environmental Monitoring and Conservation
- Track Land Cover Changes: By comparing color-coded maps from different years, we quickly identify deforestation, urban sprawl, or expansion of irrigated fields, crucial for forestry resource management.
- Carbon Footprint Tracking: Transparent mapping supports carbon accounting. With Farmonaut’s Carbon Footprinting tools, users receive real-time reports on agricultural emissions—streamlining compliance and sustainability efforts.
- Disaster Management: Planners use these systems to allocate resources effectively before and after wildfires, floods, or droughts.
Policy, Zoning, and Planning
- Urban Expansion: Standardized land cover categories ensure that expansion plans respect agricultural and environmental priorities (urban land use mapping).
- Development Approvals: Agencies utilize the California system to validate applications, protecting wetlands and prime farmland.
- Access to Finance: With Farmonaut’s crop loan and insurance verification, banks can confidently support farmers using satellite-verified, color-coded evidence, reducing risk and fraud.
Technological Innovations in Land Use Mapping and GIS Land Use Analysis
The latest advances in technology are revolutionizing how we develop, assign, and use land use color codes for resource management and sustainable land planning.
Remote Sensing & Satellite Data
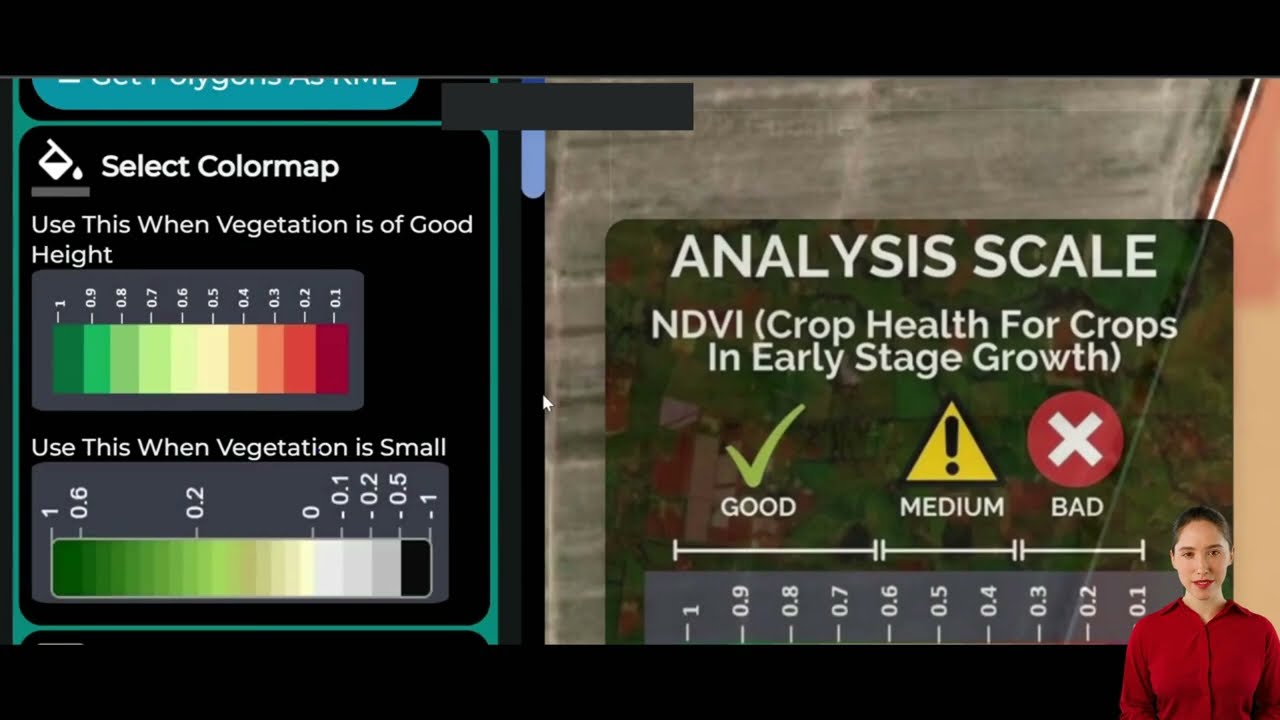
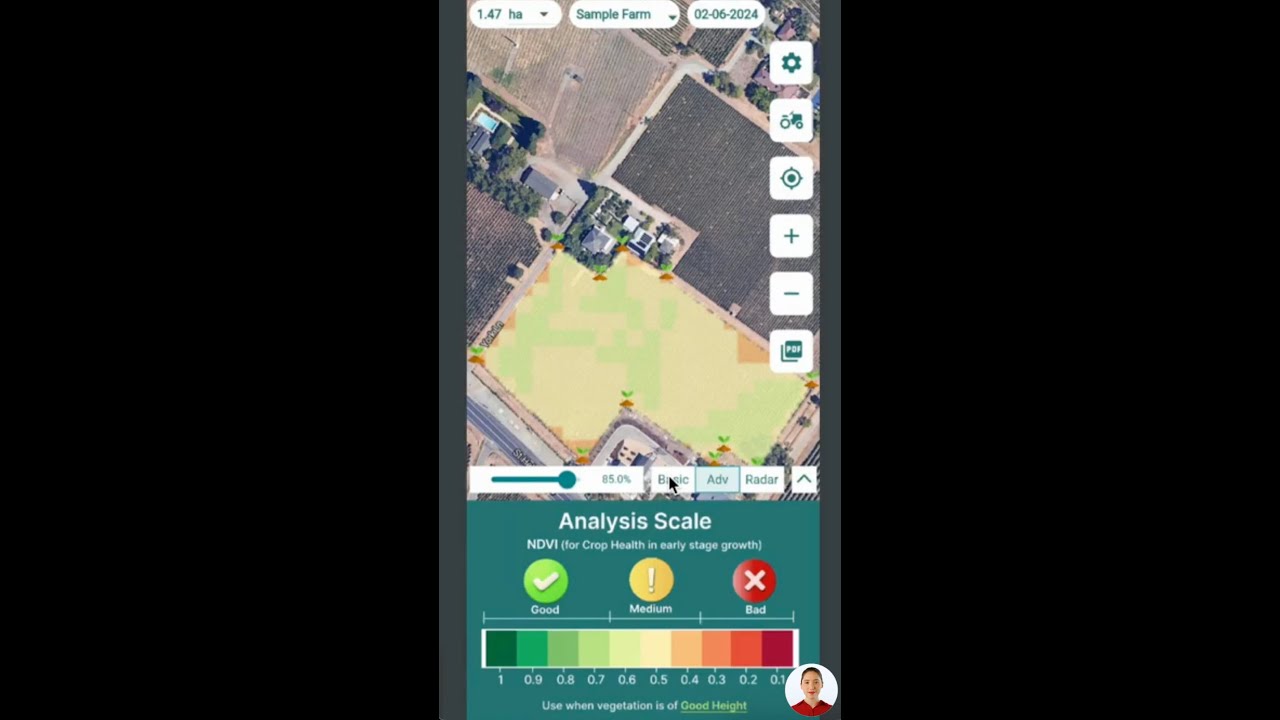
- Multispectral Imaging: Satellites now collect rich data across visible, infrared, and radar bands, enabling more nuanced classification of land cover categories (like detecting crop health, pasture condition, or forest density).
- Real-Time Monitoring: Repeated passes allow nearly “live” updates on land use patterns, ideal for time-sensitive agricultural management decisions.
Farmonaut’s platform (Large Scale Farm Management) harnesses satellite data to monitor thousands of hectares, integrating color-code overlays for actionable insights at any scale.
Artificial Intelligence & Machine Learning
- Pattern Recognition: AI-driven algorithms rapidly classify satellite imagery according to color-coded standards, even as agricultural practices evolve.
- Personalized Advisory: Tools like Farmonaut’s Jeevn AI Advisory System deliver actionable recommendations based on color-coded land use and health data—empowering every grower and land manager with science-based guidance.
Blockchain for Product Traceability
- Transparency in Supply Chains: By assigning immutable, blockchain-verified land use records to every field, Farmonaut’s traceability solution (Product Traceability) assures stakeholders that food and fiber truly originate from sustainably managed, color-coded parcels.
APIs for Seamless Integration
-
Farmonaut API delivers real-time satellite/GIS data—including color-coded land use categories—into any software, platform, or analysis tool.
API Developer Documentation makes integration simple for researchers, agtech companies, and government users.
Challenges and Considerations in Land Use Classification
Despite their power, land use color codes present several challenges that stakeholders must navigate for maximum effectiveness in management and planning.
- Standardization Issues: Regional adaptations of color coding can lead to inconsistencies. If two counties assign different codes to “pastures” or “urban,” integrating state-wide data becomes difficult. International projects face even more mismatch.
- Data Accuracy: The utility of maps depends on timely and accurate data. Outdated satellite images or misclassifications undermine confidence, making regular updates and quality assurance essential.
- Interpretation Variability: Color vision differences among users may cause misinterpretation. Maps must be designed considering accessibility, including alt-text and pattern overlays.
- Technological Gaps: Not all farmers or planners can access cutting-edge GIS tools or real-time satellite feeds. Democratizing access—Farmonaut’s core mission—remains crucial.
Farmonaut: Powering Precision Agriculture With Cutting-Edge Land Use Data
At the intersection of sustainable agricultural progress and next-generation technology lies Farmonaut—an agricultural technology leader leveraging satellite imagery, AI, and blockchain to make precision farming accessible and actionable.
- Democratizing Data: With affordable plans for all—from small farmers to enterprise agribusinesses—Farmonaut makes advanced mapping and land use color code overlays available on Android, iOS, and web apps.
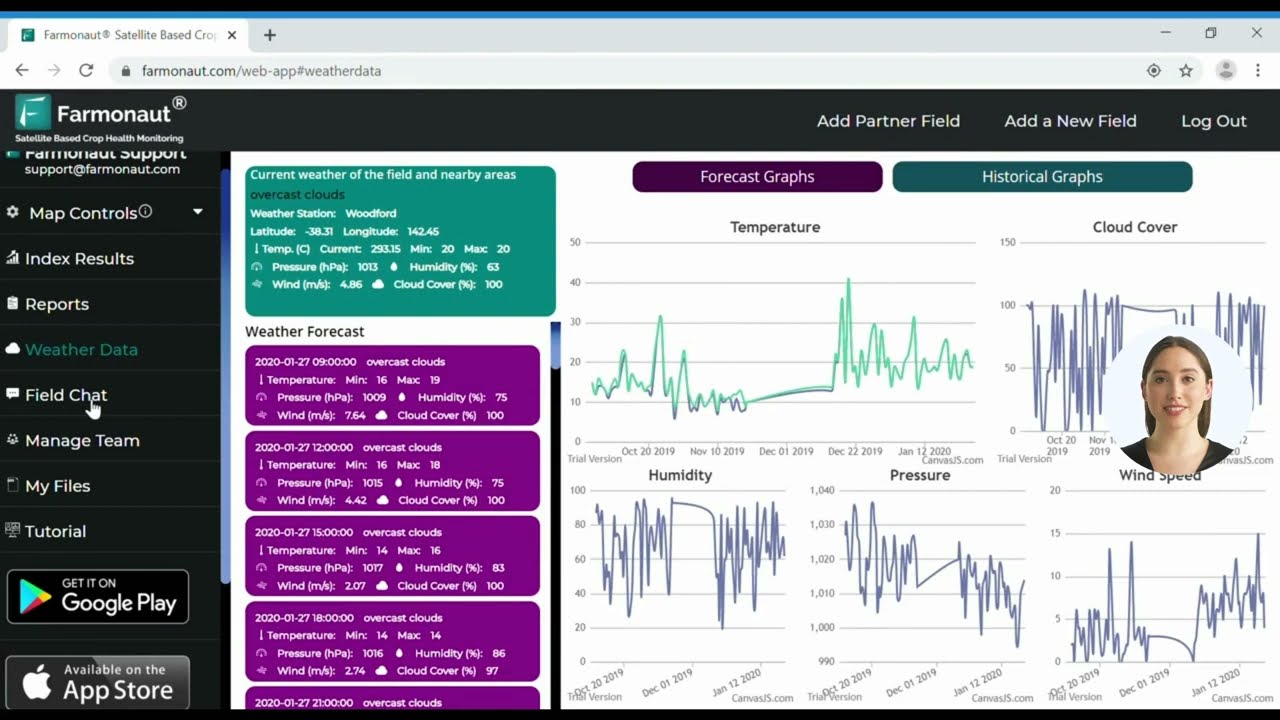
- Real-Time GIS Land Use Analysis: Integrated satellite data, with easy-to-read color codes, help farmers monitor crop health, land cover changes, and resource management all in one dashboard.
- Resource and Carbon Management: Farmonaut users can optimize machinery with Fleet Management, trace their crop journey (see more), and monitor emissions for sustainability reporting.
- Access and Extensibility: Our API supports seamless integration with enterprise or governmental GIS systems. Further details: Farmonaut API | API Documentation
What sets Farmonaut apart is not manufacturing or selling farm equipment, but delivering powerful, data-driven insights—bridging tradition and innovation for more productive, sustainable, and transparent agriculture worldwide.
Learn about managing large-scale farms with Farmonaut!
The Future of GIS Land Use Analysis & Sustainable Management
The field of land use mapping is evolving fast—driven by climate urgency, resource constraints, and technology leaps:
- Real-Time Dynamic Updates: With ever-faster satellites and internet-based platforms, color-coded maps will reflect the landscape in near-real time, enabling adaptive sustainable land management practices for every season and every challenge.
- Standardized Interoperability: Efforts to harmonize classification standards worldwide—drawing from CORINE, ALUMC, and California’s system—are making cross-border analysis and conservation more effective than ever.
- AI-Driven Decision Support: We expect AI to not only categorize and assign colors, but also advise on next steps for agriculture, forestry, and urban planning.
- Transparency & Carbon Accountability: With blockchain and satellite records forming immutable land use data, supply chains will become greener and consumers more informed.
Farmonaut is at the vanguard of these trends, lowering cost barriers and bringing cutting-edge mapping into the hands of millions—helping us all shape a more sustainable Earth.
Frequently Asked Questions
-
What are land use color codes, and why are they essential?
Land use color codes are standardized colors assigned to distinct land categories (such as pasture, crops, forests, urban). They make GIS maps clear, consistent, and actionable for sustainable land management.
-
How does the California Land Use Classification System differ from international systems?
California adapts color codes and classification structures to its local geography—e.g., using unique shades for “Rice” or “Pasture.” While drawing on standards like CORINE, it integrates local mapping needs for agriculture, forestry, and urban growth.
-
What are the benefits of using Farmonaut for land use mapping?
Farmonaut delivers real-time, satellite-based color-coded maps, with AI-powered analysis for crop health, fleet/resource management, carbon tracking, and supply chain transparency. This makes advanced land monitoring affordable and accessible to all.
-
How do I access Farmonaut’s data and technology?
You can use our Web App (linked above), Android/iOS apps, or integrate with your own systems using our API. Subscribe for scalable, affordable access to powerful mapping and insights.
-
What is the impact of accurate color coding on sustainable land management?
Every farming and forestry decision—irrigation, planting, harvesting, land conversion—benefits from up-to-date, accurate color-coded maps. They reduce mistakes, support compliance, and foster more resilient, sustainable practices.
Farmonaut Subscription & Access
Ready to harness the next generation of land management tools? Subscribe and customize your solution for powerful, actionable land use, agricultural, and forestry mapping.
Conclusion
Land use color codes are now integral to agricultural and forestry resource management across California and beyond. Through standardized, technology-powered mapping systems—like those of CORINE, ALUMC, and the California classification system—stakeholders gain the clarity and insight needed for sustainable land use planning and development.
By examining, adopting, and continuously improving these systems, and by integrating GIS, satellite, and AI innovations, we ensure productive, resilient, and responsible stewardship of the Earth’s surface for future generations. Farmonaut remains committed to this mission—making advanced mapping and land intelligence universally accessible to empower everyone from smallholders to large enterprises.
Shape a sustainable future—start your precision land management journey with Farmonaut today.


