

Massachusetts · Crop rankings
Major Crops in Massachusetts: Ranked by Sales and Acres
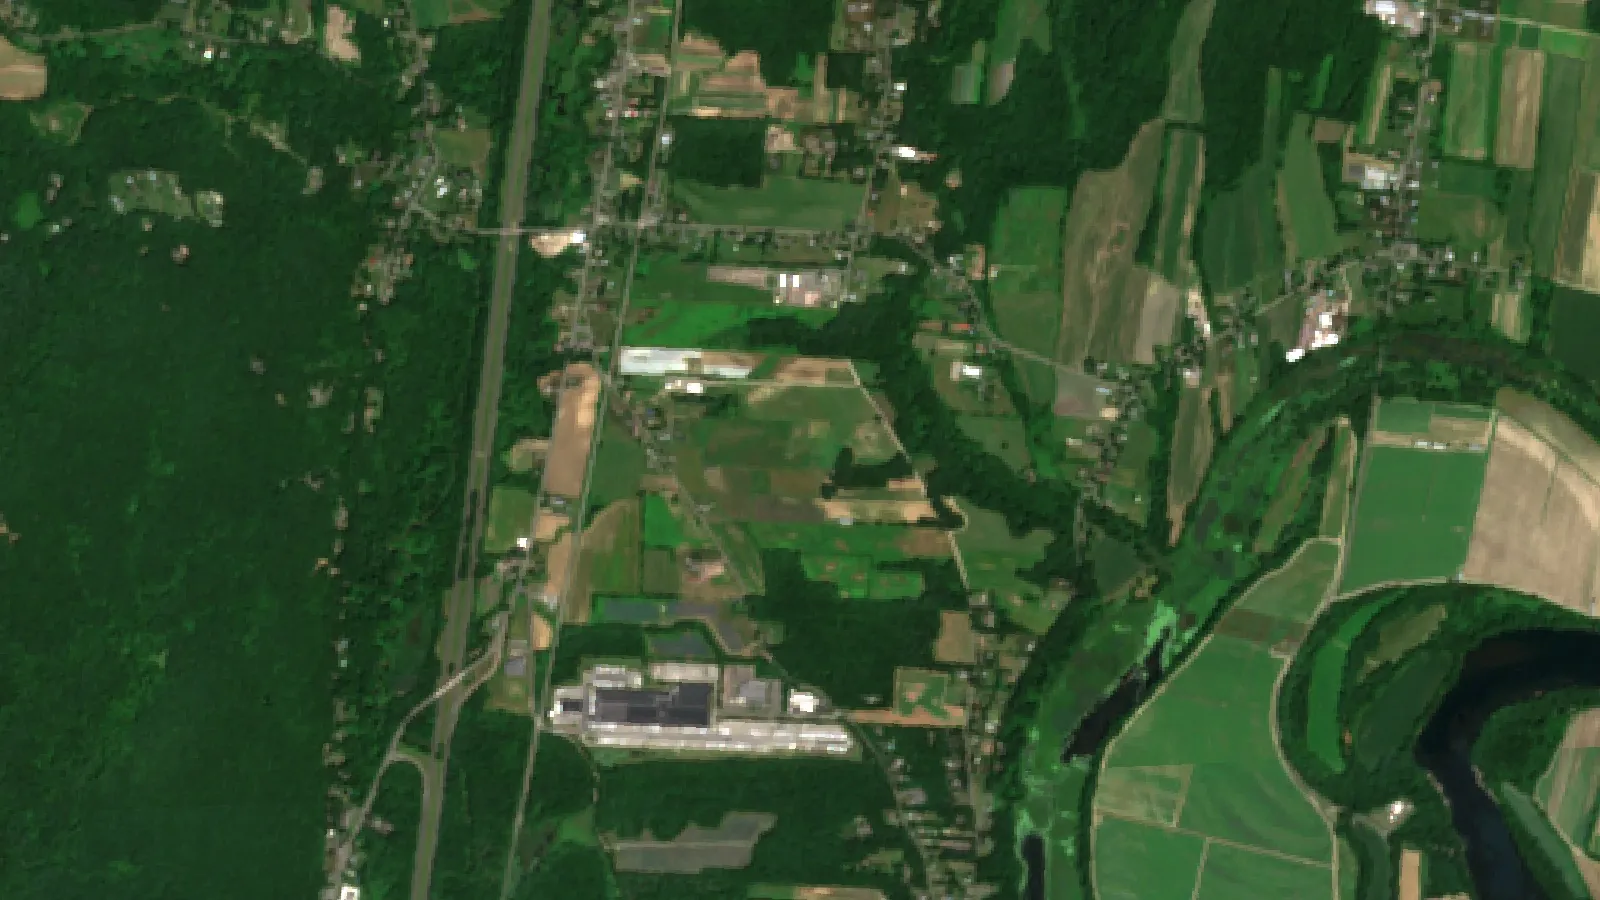
Nursery and greenhouse plants, fruit and berries, and vegetables earn the most on Massachusetts farms; hay and cranberries cover the most land (USDA 2022 Census of Agriculture). Massachusetts grew about 26% of the US cranberry crop in 2025.
Key takeaways
- By sales (2022): nursery and greenhouse US$164.1 million, fruit and berries US$131.6 million, vegetables US$127.1 million.
- By acres (2022): hay and forage 72,649, cranberries 12,875, silage corn 10,727, sweet corn 3,813, apples 3,786.
- Cranberries in 2025: 1,925,000 barrels on 11,000 acres, worth about US$64.5 million, second to Wisconsin (USDA, May 2026).
- The state had 7,083 farms in 2022, with a median size of 20 acres and total sales of US$607.2 million.
- Farm real estate averaged US$15,200 per acre in 2026, against US$4,500 nationally (USDA).
In this article
- Major crops in Massachusetts at a glance
- How Massachusetts farming looks in numbers
- Massachusetts crops ranked by sales
- Massachusetts crops ranked by acres
- Cranberries: the signature Massachusetts crop
- Fruit: apples, peaches, blueberries and more
- Vegetables, maple syrup and specialty crops
- What has changed since 2017
- Is a crop paying on your acres?
- Challenges for growers
- How to use this data when choosing a crop
- FAQ
The major crops in Massachusetts by farm sales are nursery and greenhouse plants (US$164.1 million), fruit and berries (US$131.6 million, with cranberries the best known) and vegetables (US$127.1 million), according to the 2022 Census of Agriculture, the newest full count. By land, hay and forage come first at 72,649 acres, and cranberries come second at 12,875 acres.
This guide ranks the crops both ways, because the two lists differ. It also gives the newest cranberry figures for 2025, shows what changed since 2017, and includes a per-acre calculator you can run with your own numbers.
Major crops in Massachusetts at a glance
The table lists the main crops and crop groups. The census does not publish sales for each single crop, so sales by group appear in the ranking further down. All figures in the table are from the 2022 census.
| Crop | Acres (2022) | Farms (2022) | What it is used for |
|---|---|---|---|
| Hay and forage | 72,649 | 2,167 | Feed for dairy cows, beef cattle and horses |
| Cranberries | 12,875 | 394 | Mostly processing, plus fresh fruit |
| Corn for silage | 10,727 | 172 | Dairy and beef feed |
| Sweet corn | 3,813 | 306 | Farm stands, stores, wholesale |
| Apples | 3,786 | 550 | Fresh sales, pick-your-own, cider |
| Corn for grain | 3,629 | 87 | Feed and grain sales |
| Potatoes | 3,550 | 361 | Fresh and wholesale markets |
| Squash and zucchini | 2,049 | 687 | Direct and wholesale sales |
| Pumpkins | 1,529 | 475 | Autumn retail and agritourism |
| Blueberries | 960 | 498 | Fresh sales and pick-your-own |
Nursery and greenhouse plants are missing from the acre ranking because the census reports much of their area as square feet under cover. Nursery stock alone had 1,756 acres in the open. They are still the largest crop group by money. That is why a list based only on acres gives the wrong picture of what pays on Massachusetts farms.
How Massachusetts farming looks in numbers
The state is small in farm area but high in value per acre. The census counted 7,083 farms on 464,451 acres in 2022. The average farm had 66 acres and the median farm had 20 acres. Only 131,731 acres were harvested cropland.
Total sales reached US$607.2 million in 2022, up from US$475.2 million in 2017. These are not adjusted for inflation. Crops, including nursery and greenhouse plants, made US$458.4 million, about 75% of the total. Livestock, poultry and their products made the other US$148.8 million.
USDA’s Farms and Land in Farms report (February 2026) gives a newer estimate of 6,900 farms and 470,000 acres for 2025. That estimate uses a survey, not a full count, so it should not be read as a direct change from the census.
Many operations are very small. In 2022, 2,825 farms sold less than US$2,500 of products, while 932 farms sold US$100,000 or more. The 932 larger farms, about 13% of the total, made about 87% of sales (US$530.1 million), and a typical farm may depend on off-farm income or farm-related income such as agritourism. Total production expenses were US$640.3 million. Net cash farm income, which also counts government payments and farm-related income, averaged US$13,511 per farm.
Massachusetts crops ranked by sales
Sales show where farm income comes from. Here is how the crop groups rank, with their 2017 figures so you can see the direction.
- Nursery, greenhouse, floriculture and sod: US$164.1 million. Up from US$139.7 million in 2017. 841 farms reported these sales. Demand comes from homes, landscapers and garden centers in a densely populated state.
- Fruit, tree nuts and berries: US$131.6 million. Up from US$88.4 million. Berries made up US$93.4 million of this, and tree fruit and nuts US$38.2 million.
- Vegetables, melons and potatoes: US$127.1 million. Up from US$102.1 million, across 1,478 farms.
- Other crops and hay: US$20.4 million. Includes US$3.2 million of maple syrup.
- Grains, oilseeds, dry beans and dry peas: US$7.3 million. Corn made up US$6.8 million of this.
- Christmas trees: US$4.5 million. From 308 farms.
- Tobacco: US$3.3 million. Down from US$5.7 million, on 31 farms.
For comparison, milk from cows brought in US$61.4 million in 2022 and aquaculture US$37.7 million. Milk came from just 97 farms, down from 128 in 2017. Dairy farms matter to crop farming because they use hay and silage corn.
Chart
Massachusetts farm sales by commodity group
US$ million, 2022, selected groups (not adjusted for inflation)
Massachusetts crops ranked by acres
Land use tells a different story. Hay and forage cover more than half of harvested cropland, because they suit small, rolling fields and feed local animals. Hay sells for less per acre than fruit or vegetables, so its large area does not translate into a large share of sales.
Chart
Massachusetts crops by acres
Acres, 2022, selected crops; fruit includes non-bearing acres; Christmas trees (2,952) not shown
Corn is grown mainly for feed. In 2022, 172 farms grew 10,727 acres for silage and 87 farms grew 3,629 acres for grain. USDA’s Crop Values summary (February 2026) put the state’s field crops at about US$20.2 million for 2025.
Vegetables took 17,217 acres on 1,463 farms in the census. The largest were sweet corn, potatoes, squash and pumpkins. Many vegetable farms grow a long list of crops on a few acres each. Tomatoes in the open were grown on 739 farms but only 520 acres, and peppers, cucumbers, lettuce and kale show the same pattern.

▶ How soil and water shape crop results, and what that means for field decisions. · 9:40
Cranberries: the signature Massachusetts crop
Massachusetts was the second-largest cranberry state in 2025, behind Wisconsin. Growers produced 1,925,000 barrels, about 26% of the US crop of 7,508,000 barrels, according to USDA‘s Noncitrus Fruits and Nuts 2025 Summary (May 2026). A barrel is 100 pounds.
Chart
Cranberry production in the top two states
Million barrels of total production, 2023 to 2025 (1 barrel = 100 lb)
The crop was grown on 11,000 harvested acres in 2025. The yield was 175.2 barrels per acre, against 241.0 in Wisconsin and 220.5 in Oregon. The average price was US$33.80 a barrel, and the value of the crop sold was about US$64.5 million. That is down from US$80.9 million in 2024, when both the crop and the price were higher.
The bogs are in the southeast of the state, around Plymouth and Barnstable counties. Note the two acre figures in this guide: the census counted 12,875 total acres of cranberries in 2022, of which 11,950 were bearing, and the USDA fruit survey gives 11,000 harvested acres in 2025. They come from different surveys and years, and the census total includes young plantings.
Fruit: apples, peaches, blueberries and more
Apples are the main tree fruit. The census found 3,786 acres on 550 farms in 2022. Peaches were next on 641 acres and 318 farms, followed by pears on 181 acres. Grapes covered 255 acres on 126 farms.
Among berries other than cranberries, blueberries led with 960 acres on 498 farms. Strawberries took 303 acres on 249 farms, and raspberries took 121 acres on 255 farms. These crops fit small farms close to buyers, because customers can pick the fruit themselves.
Vegetables, maple syrup and specialty crops
Maple syrup is small but steady. USDA’s Crop Production 2025 Summary (January 2026) estimated 190,000 taps and about 47,000 gallons in Massachusetts in 2025. The 2022 census found 261 maple farms with US$3.2 million in sales.
Organic sales were US$29.6 million in 2022 from 176 farms, down from US$32.8 million in 2017, and 157 farms held USDA organic certification. If you are looking at organic methods, our guide to sustainable soil management practices covers cover crops and soil testing. Greenhouse and indoor growers can compare energy use in our page on vertical farming energy consumption.
What has changed since 2017
Between the two censuses, the number of farms fell slightly from 7,241 to 7,083, while total sales rose about 28% before inflation. The chart shows where the gains and the falls were.
Chart
Massachusetts farm sales, 2017 and 2022
US$ million, not adjusted for inflation; channel rows overlap the crop rows
Direct sales to consumers fell from US$100.5 million to US$84.2 million, with 1,860 farms reporting them in 2022. Sales through stores, institutions and food hubs of local or regional products rose about 77%, from US$57.2 million to US$101.2 million. The census does not say whether the same buyers switched between these channels. Sales of value-added products fell from US$43.8 million to US$25.7 million.
Precision tools remain uncommon on these small farms. Only 266 farms reported using precision agriculture practices in 2022, under 4% of the total. Our page on agriculture innovation and technology trends covers the options, and the guide to farm tools and their uses covers the basics.
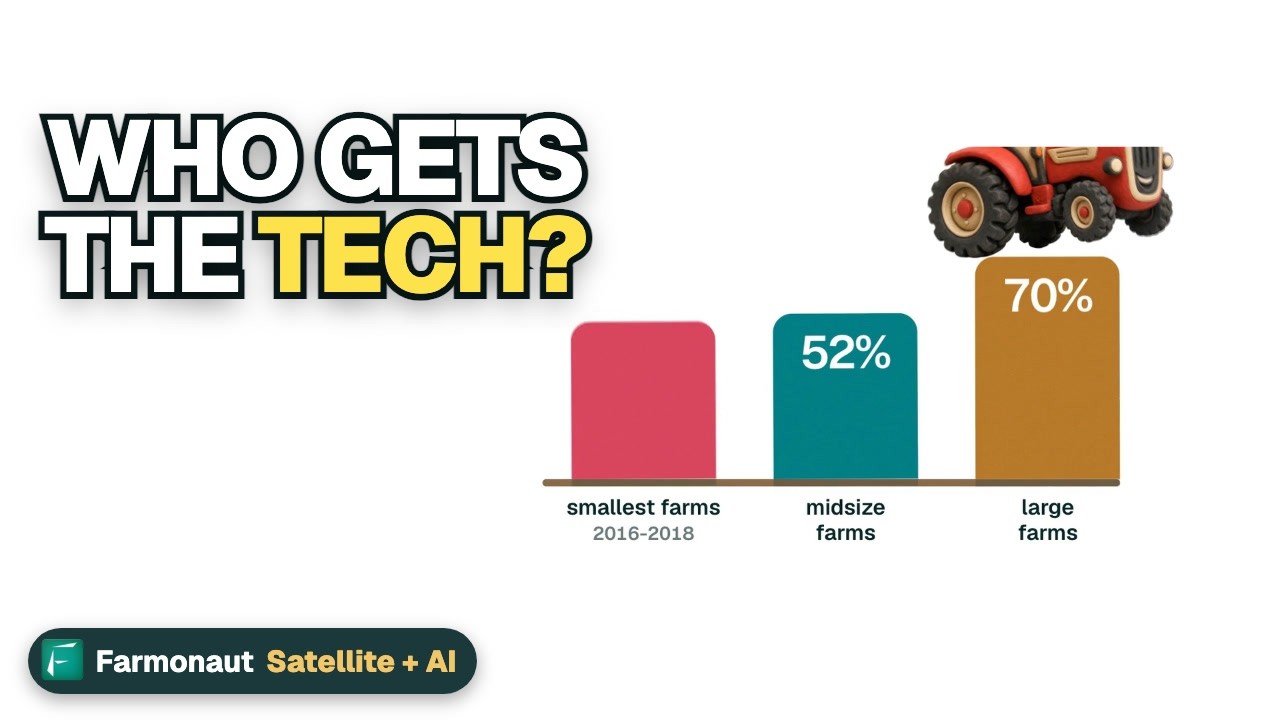
▶ What farm technology does for money, jobs and internet in rural towns. · 3:50
Is a crop paying on your acres?
High land costs mean each acre has to earn its place. Use the calculator below with your own yield, price and costs. The example uses a cranberry yield and price close to the 2025 state figures and a made-up cost, so the result sits near break-even.
Try the numbers for your own farm below.
Calculator
What does this crop leave you per acre?
Enter your own acres, yield, price and costs.
- Income per acre (US$): $5,950
- Margin per acre (US$): $50
- Break-even price per unit (US$): 33.71
Example values only, not a benchmark or forecast. The yield and price sit close to USDA’s 2025 Massachusetts cranberry figures (175.2 barrels per acre, US$33.80 a barrel); the cost is a made-up example, so use your own records.
Challenges for growers
Land cost and development
Farm real estate in Massachusetts averaged US$15,200 per acre in 2026, up 2.0% from 2025, compared with a US average of US$4,500, according to USDA’s Land Values 2026 Summary. That figure includes land and buildings. The census reports that 863 farms had land under a conservation easement in 2022. Easements pay owners to limit future building on the land under purchase programs, and the Farmland Information Center tracks these state programs. Check current terms with the state agriculture department and take legal advice before you sign one.
An aging workforce
The average producer was 58.7 years old in 2022. Of 13,284 producers counted, 8,894 were 55 or older, about 67%. Only 1,113 were counted as young producers. Women made up 6,038 of the producers, about 45%.
Water and weather
The census found 23,990 irrigated acres on 1,856 farms in 2022. Dry spells can still matter in a wet climate, especially for shallow-rooted vegetables and berries. Drought.gov showed about 177,300 state residents in drought areas when we checked on 5 November 2026. Check the local map before you plan irrigation.
Rules for produce growers
Fruit and vegetable growers should know the federal FDA Produce Safety Rule, whose compliance dates depend on average produce sales and whose very small business tier covers farms above US$25,000 and up to US$250,000. Check the rule, the pesticide label and state rules for your farm, and ask your extension office or an adviser if you are unsure.
How to use this data when choosing a crop
- Start with your buyer. The census shows sizable sales through direct and local channels, so a nearby market can matter as much as yield.
- Compare per-acre margin, not gross sales. Use the calculator with costs from your own records.
- Match the crop to the land. Cranberries need bog systems and a reliable water supply, while hay suits fields that are hard to cultivate.
- Plan the labor. Fruit and mixed vegetables need much more hand work than hay.
- Watch each field. Yield gaps often show up field by field. Farmonaut Satellite + AI Farm Monitoring System gives satellite vegetation maps of your fields through the season, which can show where to walk first. It shows changes in plant cover, not the cause. You can start in the web and mobile app.
Related pages on our site: climate-smart farming tips, large farm administration, farm carbon tracking, crop loan and insurance checks, farm fleet logistics, food traceability, satellite and weather API documentation, satellite data API, and corn yield by state.

▶ A step-by-step tutorial on monitoring fields with satellite imagery in the Farmonaut web app. · 8:43
FAQ
What is the number one crop in Massachusetts?
By sales, the largest group is nursery, greenhouse, floriculture and sod, at US$164.1 million in 2022. By land, it is hay and forage at 72,649 acres. Cranberries are the largest single fruit crop by acres, at 12,875.
How much of the US cranberry crop comes from Massachusetts?
About 26% in 2025: 1,925,000 of 7,508,000 barrels, according to USDA. Wisconsin grew 4,605,000 barrels, the most of any state.
What vegetables grow most in Massachusetts?
By acres in 2022, sweet corn (3,813), potatoes (3,550), squash and zucchini (2,049) and pumpkins (1,529) lead. By number of farms, tomatoes in the open (739) and squash (687) were among the most widely grown.
How many farms are in Massachusetts?
The 2022 census counted 7,083 farms on 464,451 acres. A USDA survey estimate gives 6,900 farms and 470,000 acres for 2025.
How much is Massachusetts farm output worth?
Farms sold US$607.2 million of products in 2022, and about 75% of that came from crops. This is the most recent full census total.
Is Massachusetts farmland expensive?
Yes, compared with the country as a whole. USDA put farm real estate at US$15,200 per acre in 2026, against US$4,500 nationally.
Farmonaut crop monitoring
See your own fields from space
Draw your fields once and Farmonaut shows satellite vegetation maps for them through the season, on web, Android or iOS.




Keep reading

Sources
- USDA NASS, 2022 Census of Agriculture, Volume 1 (2024): nass.usda.gov
- USDA NASS, Noncitrus Fruits and Nuts 2025 Summary (May 2026): release.nass.usda.gov
- USDA NASS, Crop Production 2025 Summary (January 2026): release.nass.usda.gov
- USDA NASS, Crop Values 2025 Summary (February 2026): release.nass.usda.gov
- USDA NASS, Farms and Land in Farms (February 2026): esmis.nal.usda.gov
- USDA NASS, Land Values 2026 Summary: usda.library.cornell.edu
- NIDIS, Drought.gov, Massachusetts page (checked 5 November 2026): drought.gov
- US FDA, FSMA Final Rule on Produce Safety: fda.gov
- American Farmland Trust, Farmland Information Center, Data and Statistics: farmlandinfo.org
- USDA NASS, Organic Agriculture surveys, program page: nass.usda.gov
Discussion
Questions, corrections or field experience? Share them below. First-time comments are reviewed before they appear, and your email is never published.
No comments yet. Be the first to add a question or your experience.

 YelloSkye
 GalaxEye Space
 Sun Palm Australia
 Grandstream Algérie
 XOS Realty
 Geospatial Lab Africa
 Agro La Gándara
 HIPSAC
 ZOL Zimbabwe
 Juligerm
 AdBio
 MISE Maroc
 NWNS
 Red August Group
 Farm Inc
 WeMe Global
 Agrotoken
 Blue BearX
 Insignito

 Licence holder · Niger · Gold
 Licence holder · Nigeria · Gold + lithium
 Client · Somalia · Gold
 Client & affiliate partner · Ghana · Gold










