

South Korea · Farm data guide
Agriculture in South Korea: Land, Crops and Imports
South Korea farms about 1.5 million hectares, half of it rice paddy, on plots of 0.87 ha per household. The farm population is old (51.3% aged 65+) and corn imports reach 11.5 million tonnes a year.
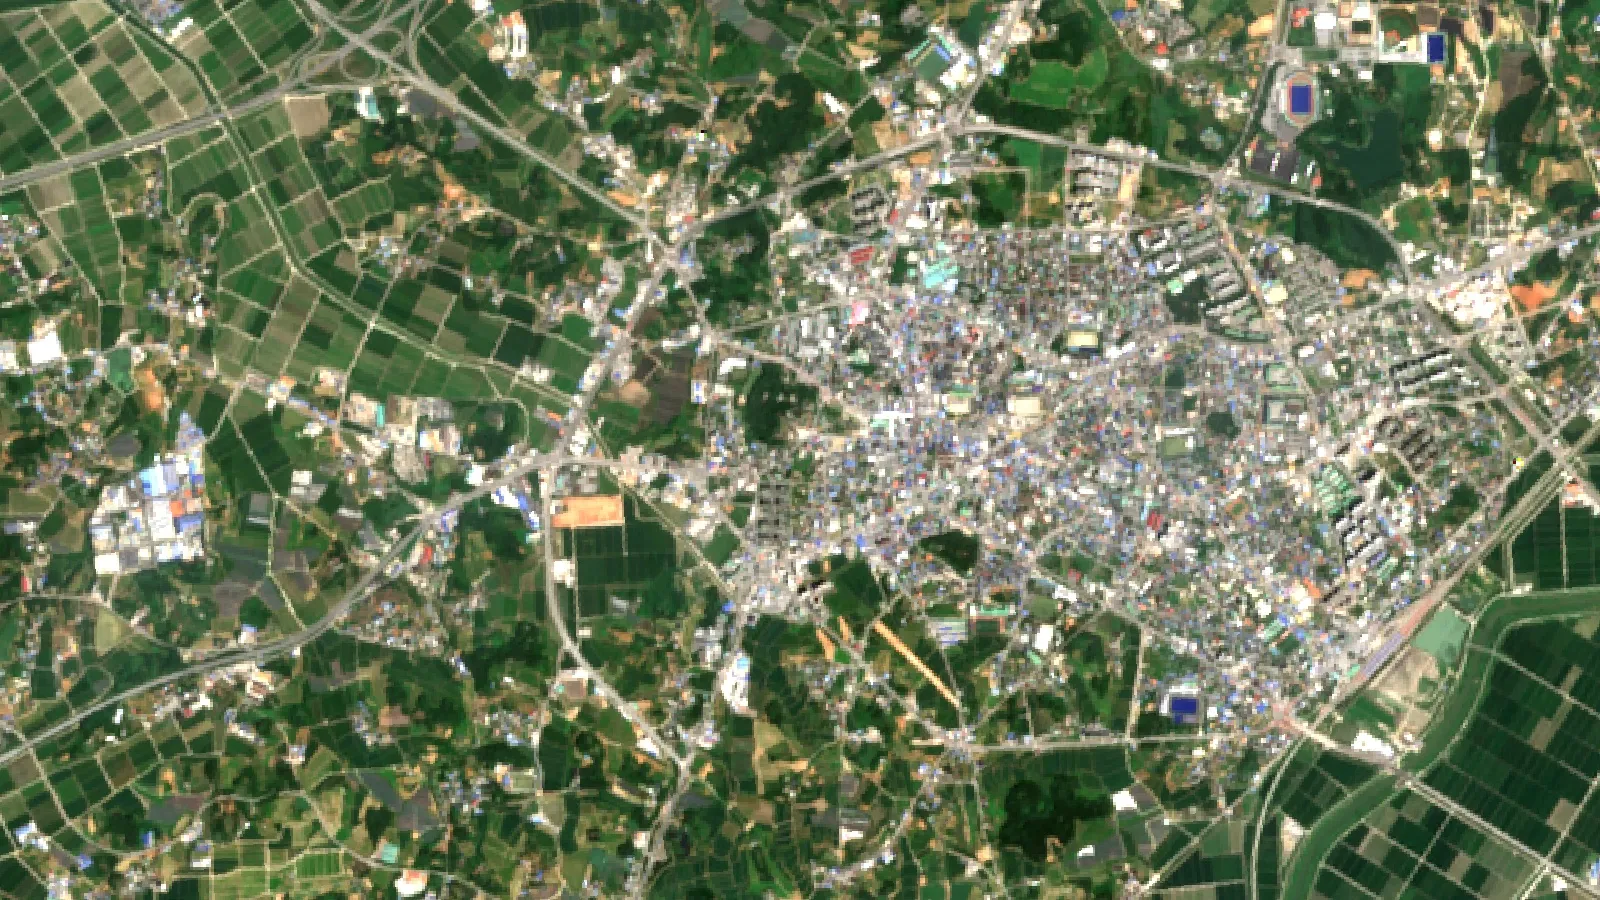
Key takeaways
- Cultivated land was 1.50 million ha at the end of 2025, down 0.3% and the 13th yearly fall; rice paddy is 50.4% of it (Ministry of Data and Statistics).
- Rice area was 678,000 ha in 2025, a record low, and table rice use fell to 53.9 kg per person (Korea Times; USDA FAS Seoul).
- Corn: 0.09 million tonnes grown and 11.45 million imported in 2025/26 (USDA WASDE, October 2026).
- 51.3% of the farm population is 65 or older, operators average 67.7 years and the average farming household cultivates 0.87 ha (Statistics Korea, 2025).
- MAFRA’s 2025-2029 plan targets smart farms on 35% of 55,000 ha of greenhouses and technology on 20% of major field-crop areas.
In this article
- Agriculture in South Korea at a glance
- Farmland: how much is left
- Rice and the other main crops
- How much food South Korea grows and how much it buys
- Farmers: age, plot size and succession
- Smart farming and government policy
- Satellite monitoring on small plots
- What the numbers mean for growers, buyers and exporters
- South Korea and the United States compared
- How we checked the numbers
- FAQ
Agriculture in South Korea works about 1.5 million hectares of farmland, and the people who farm it are old: 51.3% of the farm population was 65 or older in the 2025 census (Statistics Korea, preliminary results). Rice paddies take half of the farmland, yet the country buys nearly all of its corn abroad: USDA counts 0.09 million tonnes grown at home against 11.45 million imported in 2025/26 (USDA’s October 2026 WASDE).
This page gives the land, crop, farmer and trade numbers with their dates and sources, five charts, a table against the United States and a calculator that compares your farm with the Korean and US averages.
Agriculture in South Korea at a glance
South Korea has just under 52 million people (USDA ERS, 2025), and farming is a small share of its jobs and output. The table collects the main measures. Each has its own year, because land, census and trade data are published on different cycles.
| Measure | Latest figure | Source and date |
|---|---|---|
| Arable land | 13.3% of land area | World Bank, 2024 |
| Agricultural land | 16.0% of land area (15,610 km²) | World Bank, 2024 |
| Cultivated land | 1.50 million hectares | Ministry of Data and Statistics, end of 2025 |
| Share of jobs | 5.1% of total employment | World Bank (ILO model), 2025 |
| Share of GDP | 1.5% (agriculture, forestry, fishing) | World Bank, 2025 |
| Farm households | 1.242 million (5.5% of households) | Statistics Korea census, preliminary, 2025 |
| Plot size | 0.87 ha per farming household | Ministry of Data and Statistics, 2025 |
| Farm imports | US$37.4 billion | USDA ERS, 2025 |
The land figures differ because they measure different things. The World Bank counts arable land and permanent crops from international datasets. The Korean statistics office measures cultivated land from satellite images taken between May and November. Use each as a guide to direction and scale, not as the same number.
Farmland: how much is left
Korea’s arable land is 13.3% of its land area in the World Bank series for 2024, below the United States (16.6%) and above China (11.6%), Japan (11.0%) and Australia (4.1%). The World Bank puts agricultural land, which includes pasture, at 16.0% of Korea’s area against 46.1% in the US and 47.3% in Australia.
Chart
Arable land as a share of land area
percent of land area, 2024, five countries
The national statistics office reports that cultivated land fell for the 13th year in a row, to 1.50 million hectares at the end of 2025, down 0.3% on 2024. Rice paddies fell 0.7% to 755,952 hectares, which is 50.4% of all cultivated land (Korea Times, reporting the ministry data, February 2026). The Korea Times ties the loss to falling rice consumption, and USDA’s Seoul office notes that the government pays farmers to switch from rice to other crops.
The World Bank series moves in bigger steps than the national count: it shows 14.9% for 2023 and 13.3% for 2024. Read the direction (slowly down since 2012), not any single-year jump.
Chart
South Korea arable land share, selected years
percent of land area; 2013, 2015 and 2017 not shown
Rice and the other main crops
Rice is the anchor of Korean farming and the crop at the centre of government policy. The rice area was a record-low 678,000 hectares in 2025, the smallest since the statistics office began its series in 1975, and output of 3.54 million tonnes was the second lowest on record (Korea Times, November 2025). The 2026 crop is forecast at 670,000 hectares and 3.51 million tonnes, 0.6% below the revised 3.53 million tonnes of 2025 (Ministry of Data and Statistics, October 2026). The ministry links the fall to government support for farmers who switch to other crops.
Chart
Table rice eaten per person
kilograms per person per year, calendar years
People are eating less of it. Table rice use per person was 53.9 kg in 2025, down from 55.8 kg in 2024 and 56.4 kg in 2023, as home-meal products and wheat-based foods replace rice meals (USDA FAS Seoul, Grain and Feed Annual, April 2026).
Other crops have mixed fortunes. The table lists what the sources show for each.
| Crop | What the sources show | Source and date |
|---|---|---|
| Rice | 678,000 ha and 3.53 Mt in 2025; area still falling | Ministry of Data and Statistics, 2026 |
| Wheat | 37,886 t on 9,072 ha in 2025/26; target of 8% self-sufficiency by 2030, now about 1-2% | USDA FAS Seoul, 2026 |
| Feed corn | Government pays 1.5 million won per ha (about US$994) to move paddy land to corn | USDA FAS Seoul, 2026 |
| Apples | Area 33,800 ha in early 2024, expected to fall to 30,900 ha by 2033 (-8.6%) | Korea Rural Economic Institute, via KED Global, 2024 |
| Ginseng | Exports US$203.48 million in 2025, down from US$269.72 million in 2022 | KATI, via Financial News, 2026 |
| Kimchi cabbage | Named with apples as open-field smart-farming hubs in the national plan | MAFRA, February 2025 |
Apples show how climate and farm age meet. Apple area in North Gyeongsang Province shrank 44% over 30 years to 20,151 hectares, according to the Rural Development Administration, and national apple output fell 30% to 394,000 tonnes in 2023 (KED Global, March 2024). The same report adds that the number of apple orchards in Gangwon Province, further north, has more than tripled over the past three decades.
Ginseng, once a flagship export, has fallen for four years in a row. Exports reached US$61.7 million in the first half of 2026, 33.2% below the same period a year earlier (Financial News, October 2026, citing KATI).
Livestock is also under pressure. Avian influenza and African swine fever outbreaks since autumn 2025 have made herd sizes more volatile, USDA’s Seoul office reports, in a compound feed market that uses about 21 million tonnes a year.
How much food South Korea grows and how much it buys
Korea grows its own table rice, with a small import quota, but depends on imports for feed grain and wheat. USDA’s October 2026 supply estimates give the gap, in million tonnes, by marketing year.
Chart
Home output versus imports, 2025/26
million tonnes, USDA estimates; rice on milled basis
| Item (Mt) | 2024/25 | 2025/26 | 2026/27 |
|---|---|---|---|
| Rice, produced | 3.59 | 3.54 | 3.49 |
| Rice, imported | 0.33 | 0.41 | 0.41 |
| Corn, produced | 0.09 | 0.09 | 0.09 |
| Corn, imported | 11.44 | 11.45 | 11.50 |
Rice is milled basis. Source: USDA WASDE, October 2026; 2025/26 is an estimate and 2026/27 a projection.
Rice imports arrive under a WTO tariff-rate quota. Seoul resumed twice-weekly auctions of imported US table rice on 6 March 2026 after a pause of more than two years, and over 96% of the quantity offered sold (USDA FAS Seoul, April 2026). USDA’s Seoul office forecasts wheat imports of 4.4 million tonnes in 2026/27 and reports that the US supplied 53% of Korean corn imports in 2024/25.
The wider trade picture: South Korea imported US$37.4 billion of agricultural goods in 2025, and the United States was the leading supplier, with US$9.8 billion of exports to Korea (USDA ERS, updated April 2026). That is about a quarter of the import value USDA reports. Other agencies count “agricultural and related products” more widely and show higher totals, so compare figures only from the same source.
Farmers: age, plot size and succession
Korean farm work is done by an ageing population on small plots. In the preliminary 2025 census the farm population was 2.507 million people, of whom 1.286 million (51.3%) were 65 or older, up from 42.3% in 2020. For comparison, 20.3% of all Koreans were 65 or older. The average age of a farm operator was 67.7, and operators aged 40 or younger were 5.5% of the total.
Chart
How old is the farm population?
share of group, preliminary 2025 census
Households are shrinking too. Farm households averaged 2.0 members, and single-person households were 27.1%, up 7.1 points from 2020. Statistics Korea added farmland registers and other administrative lists to its survey roster this time, so simple comparisons with the 2020 census can mislead.
The final 2025 results, published in September 2026, count 1.27 million farming, forestry and fishing households, 210,000 more than in 2020. Average cultivated area per farming household fell to 0.87 hectares, 0.2 hectares less than in 2020 and the lowest since the 0.82 hectares of 1960 (Korea Times, reporting ministry data, September 2026). Just 12.4% of farming households sold more than 30 million won (about US$22,000) of farm products in the year.
Fewer, older farmers and shrinking plots explain the push for machinery, shared services and smart-farm tools. Use the calculator to place your own land beside the two averages.
Try the numbers for your own farm below.
Calculator
How does your farm compare with Korea and the US?
Enter your own acreage; the two averages are inputs you can change.
- Your farm in hectares: 40.5 ha
- US average in hectares: 187.4 ha
- US average vs Korean average: 215 times
- Your farm as share of US average: 21.6 %
Example values only, not a benchmark. The Korean figure is average cultivated area per farming household, 0.87 ha (Ministry of Data and Statistics, 2025); the US figure is average land in farms, 463 acres per farm (USDA Census of Agriculture, 2022). The two use different definitions. One acre is 0.4047 hectares.
Smart farming and government policy
The Ministry of Agriculture, Food and Rural Affairs (MAFRA) set out its first five-year smart-farming plan for 2025 to 2029 in February 2025. Its main targets are to turn 35% of the country’s 55,000 hectares of greenhouses into smart farms and to apply at least one smart-farming technology to 20% of the major field-crop producing areas. The plan also:
- designates four smart-farming fostering zones in 2025, with long-term leased smart farms for young farmers;
- doubles field-training institutes from 2 to 4 and creates a licensed “smart-farming manager” role;
- widens the Smart-Farming General Fund, which offers loans at lower interest;
- funds drones, robots and autonomous machinery for open fields, with testing standards.
These steps are in the ministry’s English press release (MAFRA, 26 February 2025). Check MAFRA for the current subsidy rules before relying on any support figure.
Alongside smart farming, crop policy pushes land out of rice. The corn subsidy of 1.5 million won per hectare and the wheat target (8% self-sufficiency by 2030, cut from 10%) are the two measures USDA’s Seoul office highlights.
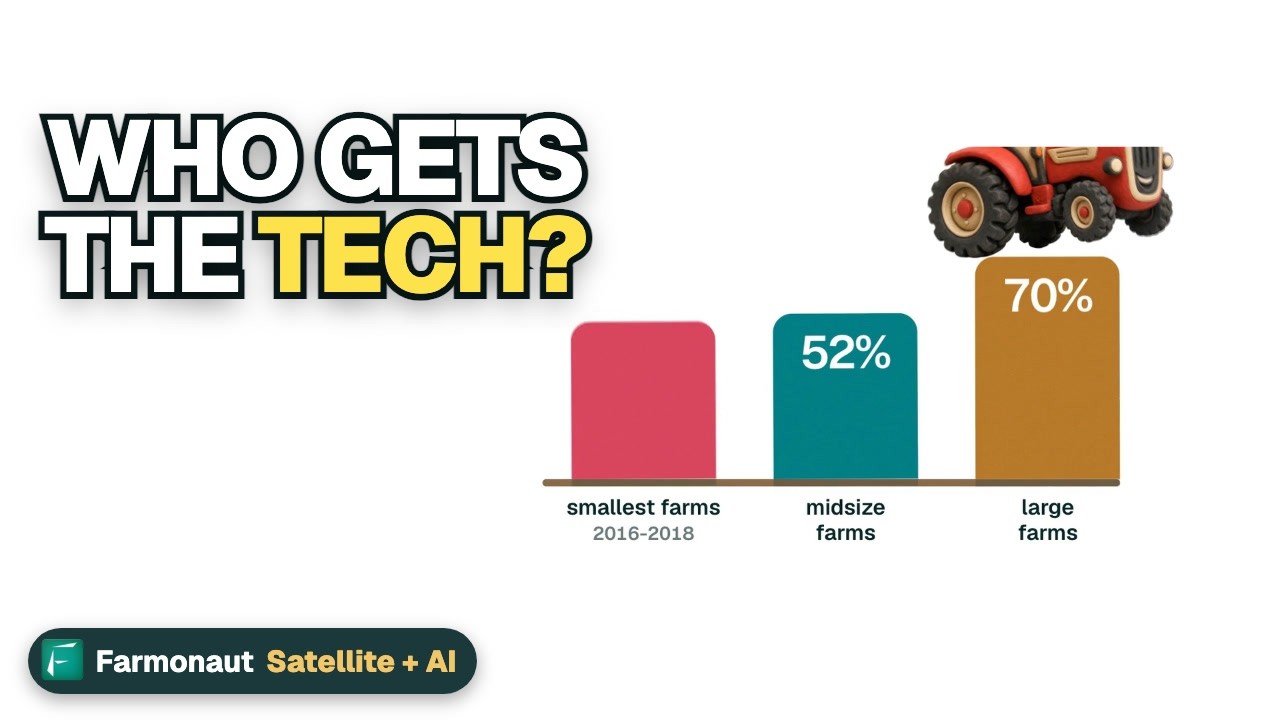
▶ What farm technology does to jobs, money and internet access in a rural town. · 3:50
Satellite monitoring on small plots
Small plots decide which satellite data fits. A Sentinel-2 pixel is 10 metres wide in four bands, so a 0.87 hectare plot covers about 87 pixels (Copernicus SentiWiki). That is enough to compare fields and spot patches that grow differently, but not single plants.
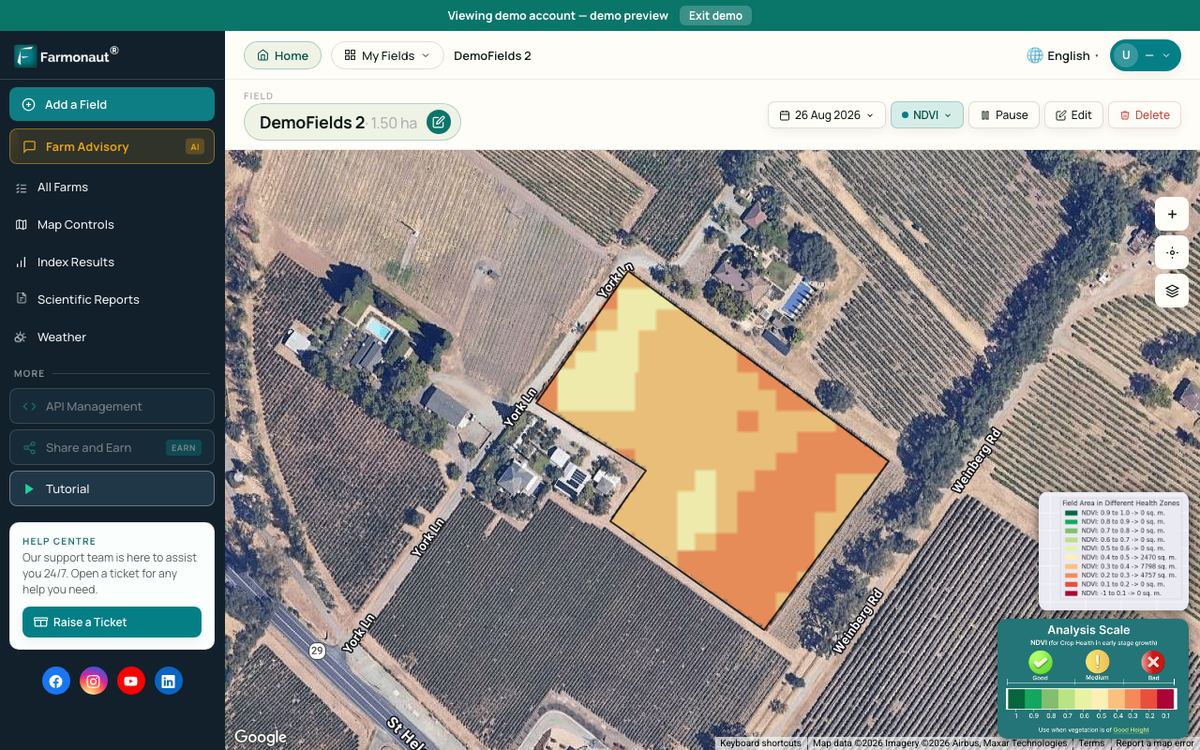
Cloud is the other limit. Optical images fail under cloud, and cloud is common in the summer rainy season. Sentinel-1 radar gives day-and-night, all-weather imagery (European Space Agency). Korea’s land survey itself used satellite images from May to November. Farmonaut Satellite + AI Farm Monitoring System builds vegetation maps from this kind of imagery for a field boundary you draw. It shows where plant cover changes, not the reason, so walk the field before you act.
▶ Why optical satellite pictures fail on cloudy days and how radar imagery sees through cloud. · 2:37
What the numbers mean for growers, buyers and exporters
For growers in Korea, the pattern is a squeeze from both sides. Rice area keeps falling by design, and the government pays 1.5 million won per hectare (about US$994) to move paddies into corn, while plots are small and the people who work them are 67.7 years old on average. Machinery sharing, contract services and smart-farm tools aim at this gap, not at larger fields.
For exporters, the market is large and shaped by quotas and prices. Korea imported US$37.4 billion of agricultural goods in 2025, corn imports run at about 11.5 million tonnes a year, and USDA’s Seoul office expects feed wheat to take some feed-corn demand when world wheat supplies are ample. Rice is the exception: imports sit under a WTO quota, and at the pace of 400 tonnes a week USDA expects US table rice sales to stay below 17,000 tonnes in 2026.
For anyone checking a claim about Korean farming, ask three things: which year the figure belongs to, whether it counts households or farms, and whether the source is a census, a survey or a model. The five charts and the tables above each state those answers beside the number.
South Korea and the United States compared
The two countries sit at opposite ends of most farm measures. Each row has its own year and source, because census cycles differ.
| Measure | South Korea | United States |
|---|---|---|
| Arable land share | 13.3% (World Bank, 2024) | 16.6% (World Bank, 2024) |
| Farm size | 0.87 ha per farming household (2025) | 463 acres (187 ha) per farm (USDA census, 2022) |
| Farm units | 1.242 million farm households (preliminary, 2025) | 1,900,487 farms (2022) |
| Average age | 67.7 years, operators (2025) | 58.1 years, producers (2022) |
| Jobs in farming | 5.1% of employment (2025) | 1.5% of employment (2025) |
| Farm trade, 2025 | Imports US$37.4 billion in all, 2025 (USDA ERS) | Exports US$9.8 billion to Korea, 2025 (USDA ERS) |
Sources: World Bank, USDA 2022 Census of Agriculture, World Bank employment data and the Korean sources above. The unit differs: Korea counts cultivated area per farming household, the US counts land in farms per farm.
How we checked the numbers
We opened each source named above in October 2026 and give the year beside every figure. Where agencies disagree we say so and keep their figures apart: farm households (1.242 million preliminary versus 1.27 million farming, forestry and fishing households in the final count), and farm import value (USDA ERS versus wider “agricultural and related” tallies). Prices, subsidies and targets can change, so confirm them with MAFRA, USDA or the national statistics office before you make a decision. This page is general information, not legal, trade or financial advice.
FAQ
How much of South Korea is farmland?
The World Bank puts arable land at 13.3% of the land area and agricultural land at 16.0% in 2024. The national statistics office counts 1.50 million hectares of cultivated land at the end of 2025, and half of it is rice paddy.
What crops does South Korea grow?
Rice is the main crop, on 678,000 hectares in 2025. Wheat and corn are grown in small volumes (about 38,000 tonnes of wheat in 2025/26 and 0.09 million tonnes of corn). Apples, kimchi cabbage and ginseng are named in government and trade sources. Feed grain comes from imports.
Does South Korea import its food?
Yes. It imported US$37.4 billion of agricultural goods in 2025, and the US was the leading supplier at US$9.8 billion (USDA ERS). It grows its own table rice but imports about 11.45 million tonnes of corn a year, and corn is the main ingredient of its compound feed (9.2 million tonnes used in 2024/25, USDA FAS Seoul).
How old are South Korean farmers?
The average farm operator was 67.7 years old in the preliminary 2025 census, and 51.3% of the farm population was 65 or older. Operators aged 40 or younger were 5.5%.
What is South Korea’s smart-farming plan?
The 2025-2029 plan aims to make 35% of the 55,000 hectares of greenhouses smart farms and to bring at least one smart technology to 20% of major field-crop areas, with training, loans and four fostering zones (MAFRA, February 2025).
Related pages on our site: farm storage and infrastructure types, large-scale farm management, farm monitoring apps, product traceability, farm fleet management, carbon footprint tracking, crop loans and insurance, satellite data APIs, weather API documentation, agricultural revolutions, sustainable farming methods and rice yield.
Farmonaut crop monitoring
See your own fields from space
Draw your field boundary once and view satellite vegetation maps for it through the season, on web, Android or iOS.



Keep reading

Sources
- World Bank, Arable land (% of land area): data.worldbank.org
- World Bank, Agricultural land (% of land area): data.worldbank.org
- World Bank, Employment in agriculture (% of total employment, modeled ILO estimate): data.worldbank.org
- World Bank, Agriculture, forestry, and fishing, value added (% of GDP): data.worldbank.org
- USDA, World Agricultural Supply and Demand Estimates, October 2026 (9 October): usda.gov
- USDA FAS Seoul, Grain and Feed Annual, KS2026-0009 (April 2026): apps.fas.usda.gov
- USDA ERS, Japan and South Korea (updated April 2026): ers.usda.gov
- USDA NASS, 2022 Census of Agriculture, Volume 1 Chapter 1 US: nass.usda.gov
- MAFRA, First Master Plan for the Smart-Farming Industry 2025-2029 (press release, 26 February 2025): mafra.go.kr
- Korea Times, Korea’s arable land shrinks for 13th year (27 February 2026): koreatimes.co.kr
- Korea Times, No. of farming households rebounds in 2025 (29 September 2026): koreatimes.co.kr
- Seoul Economic Daily, Over half of Korea’s farm population now aged 65 or older (28 April 2026): en.sedaily.com
- Korea Times, Korea’s rice production projected to fall 0.6% in 2026 (8 October 2026): koreatimes.co.kr
- Korea Times, Korea’s rice production falls for 4th year in 2025 (13 November 2025): koreatimes.co.kr
- KED Global, Korea faces apple crisis amid climate, demographic change (March 2024): kedglobal.com
- Financial News, South Korea’s ginseng exports flash warning signs (October 2026, KATI data): en.fnnews.com
- ESA, Introducing Sentinel-1: esa.int
- Copernicus SentiWiki, Sentinel-2 mission: sentiwiki.copernicus.eu
Discussion
Questions, corrections or field experience? Share them below. First-time comments are reviewed before they appear, and your email is never published.
No comments yet. Be the first to add a question or your experience.

 Blue BearX
 Insignito
 Croptimum
 Dalmia Bharat Sugar
 DnCubed
 Pistachio ST
 Field Capacity
 Indosistim Teknologi
 Liquify Digital
 CU Foods
 BeyondTech Global
 Rouge VC
 AgroGreen Dynamics
 AgroRisk
 Oath Inc
 Reddane Farming
 Esri North East Africa
 Cresol
 MDCV UK

 Licence holder · Niger · Gold
 Client · Tanzania · Gold
 Client · Somalia · Gold










