

Farm data · Evidence guide
How Does Big Data Improve Farming? Evidence and Calculator
Big data improves farming by turning yield, soil, satellite and model records into field-level choices. USDA estimated, from 2010 survey data, the gain on US corn farms at 1.1% to almost 3% of operating profit, so the real question is which data pays on your acres.
Key takeaways
- Mapping, guidance and variable rate tools each raised corn farm operating profit by an estimated 1.1% to almost 3% (USDA ERS, 2010 survey data).
- 22% of US farms used a precision practice in 2025, against 27% in 2023 (USDA NASS).
- Data farming creates simulated data. Data mining finds patterns in real records. Some forecasts combine real records with simulation.
- On organic farms, data can help with timing, weed planning and traceable records.
- Start with one decision and test it in a strip trial before you scale up.
In this article
How does big data improve farming? It turns records from yield monitors, soil maps, satellites and simulation models into field-level choices about seed, nutrients, water and timing. USDA’s Economic Research Service estimated, from 2010 survey data, the profit gain on US corn farms at 1.1% to almost 3% of operating profit, depending on the tool. That is real money, but it is small, so the question for a farm manager is which data pays back on which acres.
This guide gives the evidence, separates data farming from data mining, covers what changes on an organic farm, and includes a calculator that tests whether a data tool pays on your own numbers.
How does big data improve farming? Six ways with evidence
“Big data” on a farm rarely means a giant database. It means several ordinary records, joined by field and by date, so that a pattern shows up that no single record could show. Here are the six uses with the clearest support. Each one lists who it suits best.
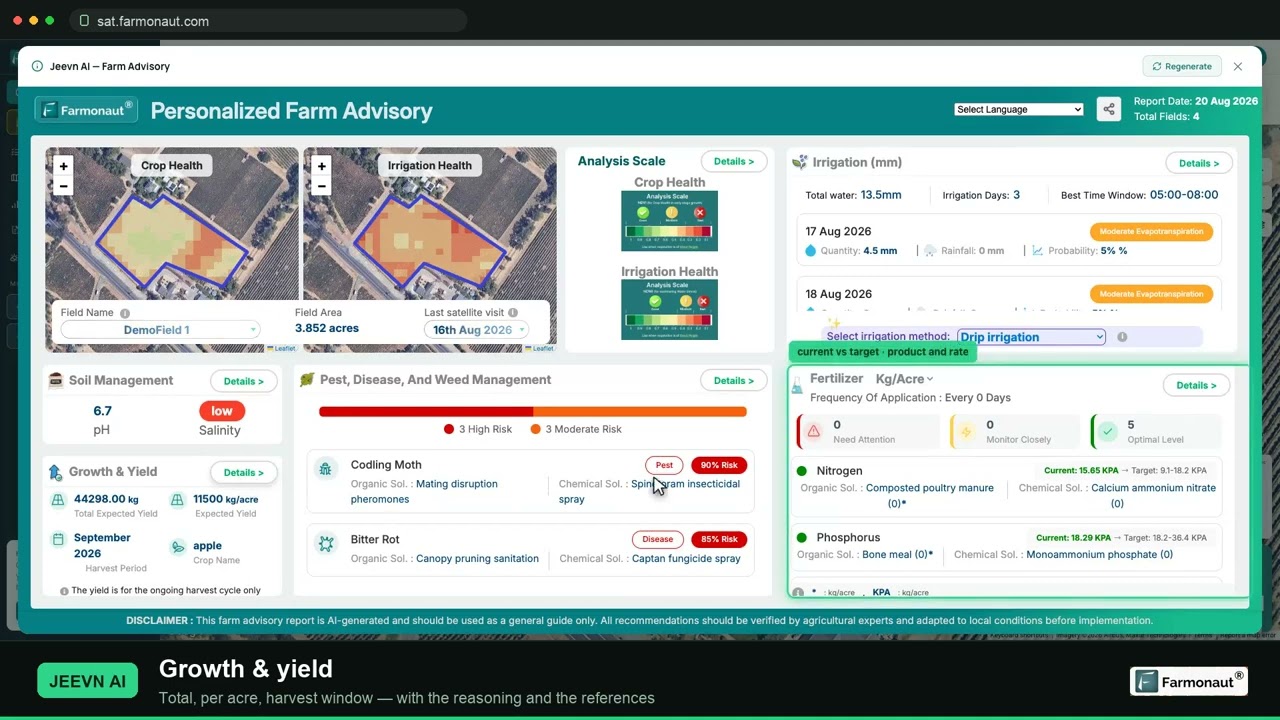
▶ A full walkthrough of reading satellite crop maps and pulling a field report. · 19:36
1. It shows where a field differs
A yield map shows that a field is not one field. Low areas, sandy ridges and old fence lines show up year after year. USDA says yield monitor data feed yield maps, pest maps and profitability maps. Yield maps covered 43.7% of US corn acres in 2016 and 43.8% of soybean acres in 2018, according to the USDA report on precision agriculture in the digital era.
Best for: row crop farms with a combine that already records yield.
2. It places inputs where they can respond
Variable rate technology changes the rate of seed, fertilizer, lime or pesticide as the machine crosses a field. The map behind it comes from soil tests, past yields or imagery. Adoption differs widely by crop, as the chart shows. Check the product label and local rules before changing any application rate, and ask a qualified adviser about rates for your soil.
Best for: fields with mapped soil differences and a high input bill.
3. It cuts overlap in field passes
Guidance is the most common precision tool in US row crops. USDA reports that auto-steer and guidance went from 5.3% of planted corn acres in 2001 to 58% in 2016. Estimates for 2019 were 72.9% for sorghum and 64.5% for cotton. USDA suggests part of the appeal may be lower costs from fewer skips and overlaps in fuel, seed, nutrients and pesticides.
Best for: large fields and long operating days.
4. It helps schedule water
Water is where the evidence needs the most care. A Nebraska study of variable rate irrigation in Frontiers in Big Data (2019) used a Landsat-based water model on a center pivot. In 2018 the prescribed water for the fully irrigated treatment was 265 mm against 282 mm for uniform irrigation. In 2017 there was no significant difference. Grain yield did not differ significantly in either year. So on this one field, the data trimmed prescribed water in one of two seasons, with no yield gain. The authors also found no detectable drop in deep percolation or actual crop water use. Whether that pays depends on your water and pumping costs.
Best for: irrigators with costly or limited water.
5. It forecasts a season while it can still be managed
Crop models combine weather, soil and management records to estimate yield before harvest. In the US Corn Belt, a multi-university team uses local management data, soil types, real-time weather and the Hybrid-Maize model for its University of Nebraska corn yield forecasts. In Australia, Yield Prophet from the Birchip Cropping Group and CSIRO gives growers a practical front end to the APSIM model.
Best for: rainfed grain growers making in-season nitrogen and marketing choices.
6. It spots a problem you have not walked to yet
Satellites make a repeat record of every field. The two Sentinel-2 satellites are designed for a five-day revisit at the Equator and carry bands at 10 m, 20 m and 60 m resolution. A patch that falls behind the rest of the field tells you where to scout. It does not tell you why. Clouds can also block a pass, so imagery supports field walks and does not replace them.
Best for: managers with many fields, rented land or long driving distances.
Chart
Variable rate technology use by US crop
Percent of planted acres, selected crops, survey year shown per crop
What the profit numbers show
The most useful single figure comes from USDA’s Farm Profits and Adoption of Precision Agriculture report. It modelled US corn farms of average size using USDA’s 2010 corn farm survey, so the figures are old. GPS mapping raised operating profit by almost 3% and net returns by almost 2%. Guidance raised operating profit by an estimated 2.5% and net returns by 1.5%. Variable rate technology raised both by an estimated 1.1%.
Three limits apply. These are corn farm estimates, so they do not carry over directly to vegetables, orchards or pasture. They are averages, so one farm can do much better or worse. And they are percentages of profit, not of yield. Be careful with any claim of a 25% to 30% gain from data alone unless it names the trial, the crop and the baseline.
Chart
Estimated gain in corn farm operating profit
Percent, average-size US corn farm, by technology
Who actually uses farm data
Adoption is lower than the marketing suggests. The USDA National Agricultural Statistics Service asks farms whether they used any precision practice in the past 12 months, including GPS guidance, yield monitoring, soil mapping, variable rate inputs, drones, electronic tagging, precision feeding and robotic milking. Its Technology Use report of August 2025 puts the US share at 22% of farms in 2025, against 27% in 2023. The same report says 85% of farms had internet access in 2025, so access alone does not explain the gap.
These figures count farms, not acres. Small farms pull the share down. USDA’s earlier report found that at least half of relatively large row crop farms use yield maps, soil maps, variable rate tools or guidance, while under 25% of smaller farms do, cotton aside.
A DTN summary of a 2024 US Government Accountability Office report notes that up-front cost can be a barrier for some growers. It also observes that most northeastern states sit below the national average and suggests smaller farm sizes as one possible cause.
Chart
Farms using precision agriculture practices
Percent of farms, crops or livestock, selected states and US total
Data farming vs data mining
People often use these two terms as if they meant the same thing. They do not. Data mining looks for patterns in records that already exist. Data farming creates new records on purpose by running a simulation many times.
| Point | Data farming | Data mining |
|---|---|---|
| Starting point | A simulation model and a question | Records already collected |
| Data type | Synthetic, designed output | Observed, often messy |
| Typical sources | Crop models such as APSIM or DSSAT | Yield monitors, satellites, sensors, sales records |
| Typical methods | Designed experiments, many model runs | Regression, clustering, machine learning |
| Good question | What if we plant 10 days later in a dry year? | Why does this corner lag every year? |
| Main risk | The model is wrong for your soil | A pattern that is chance or has another cause |
| Who runs it | Researchers, advisers, tool makers | Farm managers, agronomists, analysts |
What is data farming?
The term did not start in agriculture. By 2015 it had been used in defense simulation for over a decade. A 2015 keynote paper by Susan Sanchez calls it a descriptive metaphor for generating data on purpose to get the most information “yield” from a simulation model. A 2012 Winter Simulation Conference paper describes a NATO task group testing the same method for military decision support.
Farm science has long done something similar under other names. The APSIM agricultural systems simulator and the DSSAT cropping systems model let researchers run many combinations of crop, soil, weather and management on a computer. Useful farm examples include:
- Crop growth: simulating wheat under many rainfall and irrigation patterns to see the likely range of yield.
- Nutrient planning: comparing compost or fertilizer rates in the model before a field trial.
- Pest design: running many virtual cases of companion planting or biological control, where a suitable model exists.
- Climate planning: testing how planting dates perform under hot or dry seasons.
The output is only as good as the model. It should be calibrated with local data and then checked in a real strip trial. A simulation narrows the options. It does not replace the field.
What is data mining in agriculture?
Data mining means searching real records for useful patterns. The sources include sensors, satellites, drones, weather stations, farm equipment and market reports. Common methods are regression, clustering, pattern recognition and machine learning.
- Finding drivers: how soil moisture and temperature relate to crop health over several seasons.
- Using inputs better: comparing water, fertilizer and pest control records against yield by zone.
- Early warnings: flagging abnormal growth in imagery or sensor records so that someone goes and looks.
- Market timing: joining on-farm costs with price records to inform what to plant and when to sell.
The main trap is that a pattern is not a cause. If one zone yields less, the reason could be drainage, compaction or an old planter problem. Test the cause before you spend on a fix.
How the two work together
The two methods feed each other. Mined field records calibrate a simulation. The simulation then tests ideas that the records cannot, such as a rotation you have never tried. Real results from the next season check the model. A forecast such as the Nebraska one shows the blend: real weather and management records go in, and simulated yield comes out.
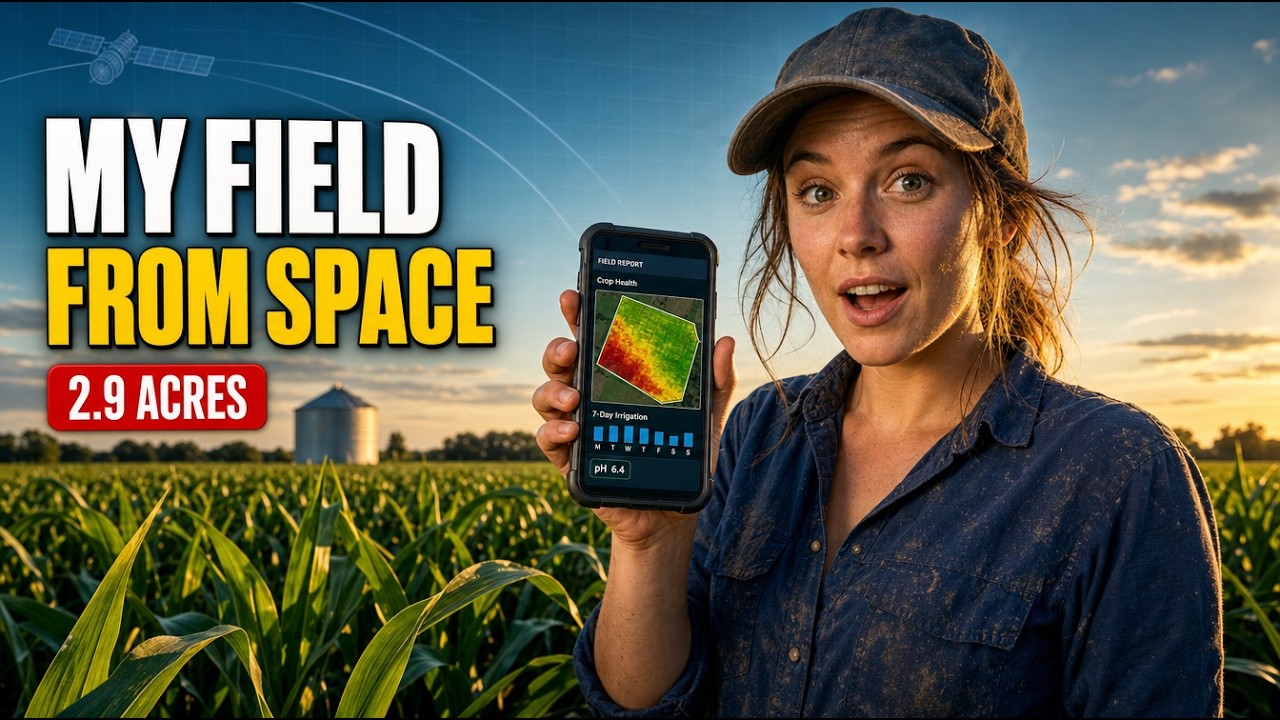
▶ How a satellite farm advisory flagged a drop in the expected yield of a maize field. · 9:13
Big data in organic farming
Organic is a distinct US market with its own record needs. The USDA 2021 Certified Organic Survey counted 17,445 certified farms, 4.9 million certified acres and US$11.2 billion in sales, up 13% from US$9.9 billion in 2019. California led with 3,061 farms and 813,710 acres.

▶ How AI is used to diagnose plant disease and detect pests. · 11:10
Organic growers cannot rely on the same quick synthetic fixes, so timing and prevention carry more weight. Data helps in four places.
- Nutrients: soil tests and model estimates help time compost, mulch and green manure so nutrients release when the crop needs them.
- Weeds: field records and imagery show where pressure builds, which helps plan cultivation. Our guide to mechanical weed control covers the machines.
- Pests and disease: weather and scouting records help target biological controls and field checks. Follow the product label, your certifier’s approved list and local rules.
- Rotations: yield history combined with simulation helps compare rotations before a multi-year commitment.
Records for organic certification
Records are where data most directly affects organic farms in the US. USDA’s Strengthening Organic Enforcement rule took effect on 20 March 2023, with implementation on 19 March 2024. It covers recordkeeping and product traceability, among other topics, and aims to improve traceability from farm to market. Digital records make an audit easier, but the format does not decide compliance. Ask your certifier what they accept, and get professional advice on legal questions.
Blockchain is often raised here. USDA lists distributed ledgers as a newer digital farm technology. A ledger can make a record harder to alter, but it cannot prove that the first entry was true. Good field records and audits still come first.
Which farm data to collect first
Do not begin with a platform. Begin with one decision. Then work through these steps.
- Name the decision. For example: which fields get the second nitrogen pass, or which block gets water first?
- List what you already have. Yield files, soil tests, spray records, invoices and rainfall logs often sit in separate places.
- Join them by field and date. Use the same field names everywhere. This step is dull, and it matters most.
- Add one new layer. Satellite imagery has low setup work because no hardware goes in the field. Sensors suit high-value irrigated blocks.
- Run a strip trial. Compare the data-led choice against your normal practice in the same field.
- Count the result in money. Put the trial result into the calculator below and decide whether to scale up.
Who owns the data?
Read the contract before you upload. The Privacy and Security Principles for Farm Data (2015), signed by US farm groups and technology providers, state that farmers own the information generated on their farms and that providers should write contracts in plain language. These principles are a voluntary statement. Your contract is what counts, so check who can see, share or sell your data and whether you can export it when you leave. Get legal advice on large agreements.
Will a data tool pay on your farm?
Use this calculator as a first test. The USDA range of 1.1% to almost 3% of operating profit, from corn farms, gives a sensible reference, though your own trial result is better. If the tool only breaks even at a much higher figure, ask the seller for trial evidence on your crop.
Try the numbers for your own farm below.
Calculator
Will a farm data tool pay for itself?
Enter your own area, profit, expected gain and tool cost.
- Yearly gain from the tool: 2,000 US$
- Break-even gain needed: 2.0 %
- Break-even area at this gain: 1,000 acres
Example values only, not benchmarks or forecasts; they are set near break-even and every number is your input. For reference, USDA ERS (ERR-217, 2016), using 2010 survey data, estimated gains of 1.1% to almost 3% of operating profit on average-size US corn farms. Other crops and farms will differ. Money is in US$; use today’s price for the tool.
Farm data beyond the field
Farm data can also serve lenders, buyers and fleet managers. Satellite records can support crop loan and insurance checks. Field operations can feed product traceability records. Input and fuel records support carbon footprint estimates. Machine records support fleet scheduling. On large operations, a multi-farm admin dashboard puts these in one view. Agtech teams can connect imagery and weather through a satellite data API, using the developer documentation.
Farmonaut provides satellite crop monitoring on web, Android and iOS for farms that want the imagery layer without field hardware. You can open it through the app page.
Related pages on our site: gold mining methods.
What to expect next
Three pressures are likely to keep data on the agenda: traceability demands from regulators and buyers, the cost of inputs and water, and the wider use of machine learning on farm records. The figures here also show that uptake does not rise in a straight line, since the USDA share fell between 2023 and 2025. Expect steady gains on the farms where the numbers work, and do not assume every farm needs every tool.
FAQ
How does big data improve farming in simple terms?
It joins records such as yield, soil, weather and imagery so you can treat each part of a field according to what it needs. USDA estimated profit gains on US corn farms at 1.1% to almost 3% of operating profit, from 2010 survey data, depending on the tool.
What is the difference between data farming and data mining?
Data farming creates new data by running simulation models many times. Data mining finds patterns in data that already exist, such as yield maps and sensor logs. Some forecasts combine real records with simulation.
How many US farms use precision agriculture?
USDA NASS reports 22% of US farms in 2025 and 27% in 2023, excluding Alaska and Hawaii. The share of acres on major row crops is much higher for some tools, such as guidance.
Does big data help organic farmers?
Yes, mainly for timing, weed and pest planning, rotations and records. Organic rules also require recordkeeping and traceability, so organized data helps with inspections. Your certifier decides what meets the standard.
Can simulation replace field trials?
No. Simulation can narrow many options to a few, which saves time and trial space. Local strip trials still confirm whether the result holds on your soil and in your season.
Who owns the data from my farm?
US industry principles state that farmers own information generated on their farms, but those principles are voluntary. Your contract sets the actual terms, so read the sharing and export clauses and get legal advice if needed.
Farmonaut crop monitoring
Add a satellite layer to your farm data
Draw your fields once and Farmonaut shows satellite vegetation maps for them through the season, on web, Android or iOS.




Keep reading
Sources
- USDA ERS, Precision Agriculture in the Digital Era: Recent Adoption on U.S. Farms, EIB-248: ers.usda.gov
- USDA ERS, Farm Profits and Adoption of Precision Agriculture, ERR-217 (2016): ers.usda.gov
- USDA NASS, Technology Use (Farm Computer Usage and Ownership), August 2025: nass.usda.gov
- USDA NASS, Organic Farming Highlights: 2021 Certified Organic Survey (2022): nass.usda.gov
- USDA AMS, Strengthening Organic Enforcement rule: ams.usda.gov
- Variable Rate Irrigation of Maize and Soybean in West-Central Nebraska, Frontiers in Big Data (2019): pmc.ncbi.nlm.nih.gov
- University of Nebraska-Lincoln CropWatch, 2026 corn yield forecasts: approach: cropwatch.unl.edu
- Birchip Cropping Group, Make better decisions with Yield Prophet (2020): bcg.org.au
- Copernicus SentiWiki, Sentinel-2 mission: sentiwiki.copernicus.eu
- Sanchez, Simulation experiments and data farming, MODSIM keynote (2015): mssanz.org.au
- NATO MSG-088 case study on data farming, Winter Simulation Conference (2012): informs-sim.org
- APSIM Initiative, APSIM: apsim.info
- DSSAT, overview: dssat.net
- DTN, 5 states top list, summary of GAO precision agriculture report (2024): dtnpf.com
- Privacy and Security Principles for Farm Data (2015): cotton.org
Discussion
Questions, corrections or field experience? Share them below. First-time comments are reviewed before they appear, and your email is never published.
No comments yet. Be the first to add a question or your experience.

 Abhishta Agri
 SP Farms
 Indosistim Teknologi
 Liquify Digital
 CU Foods
 BeyondTech Global
 Rouge VC
 AgroGreen Dynamics
 AgroRisk
 Oath Inc
 Reddane Farming
 Esri North East Africa
 Cresol
 MDCV UK
 Zerella Group
 Etech Consulting Madagascar
 Vestlandsforsking
 Delicio

 Exploration consultancy · South Africa · Gold
 Licence holder · Niger · Gold
 Client · Tanzania · Gold
 Client · Somalia · Gold










